What is WAR in Baseball? An Introduction to College WAR
The cWAR dashboard has not been updated after the 2021 season.
What is WAR in Baseball?
Wins Above Replacement Level, or WAR, is nothing more than a framework that attempts to summarize the entirety of a player’s contribution (fielding, baserunning, batting, or pitching) in one catch-all number. Certainly, like all metrics, baseball WAR is not perfect and it has its limitations depending upon whom you ask and what iteration you’re using. However, whatever your opinion is on the matter, it’s undeniable that in the year 2020, WAR in baseball has helped change the game forever.
In the past 2-3 years alone, WAR has influenced MVP and Cy Young races, helped sports writers rank and organize free agent lists, given fans a platform to evaluate the open market, and allowed analysts to determine how much a single draft selection is worth in present-day dollars.
In this sense, although WAR is just a framework by design, it functions as much more than that for those around the game. For us, baseball WAR is a gateway to better analyses, better evaluations, and better comprehension of the sport itself.
Integrating WAR in Baseball At The D1 Level
Given the importance of WAR at the MLB level, we felt it was time to expand the same principles and methods to the college realm, as, to the best of our knowledge, calculations of NCAA WAR have not been attempted by any prior public analyst or organization.
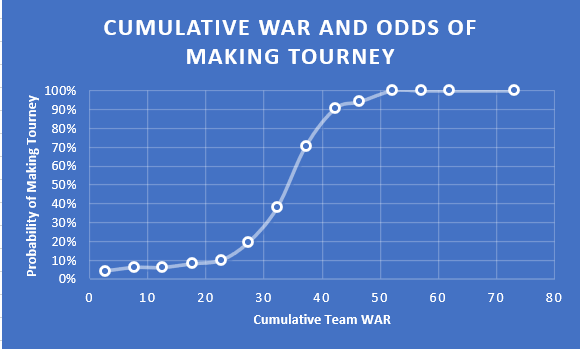
(The visualization above shows the odds of making the NCAA tournament based on the cumulative WAR produced by each team from 2017-2019. The target threshold for D1 teams should be ~35-40 WAR per year.)
We model our WAR for NCAA D1 players after Fangraphs WAR baseball calculations. On the hitting side, we use park-adjusted, as well as strength of schedule-adjusted (SOS), wOBA, estimated base-running runs (BsR estimate), estimated fielding runs (UZR estimate), and a positional adjustment for comparing different positions. On the pitching side, our WAR is based on FIP rather than RA9, following Fangraphs’ methodology.
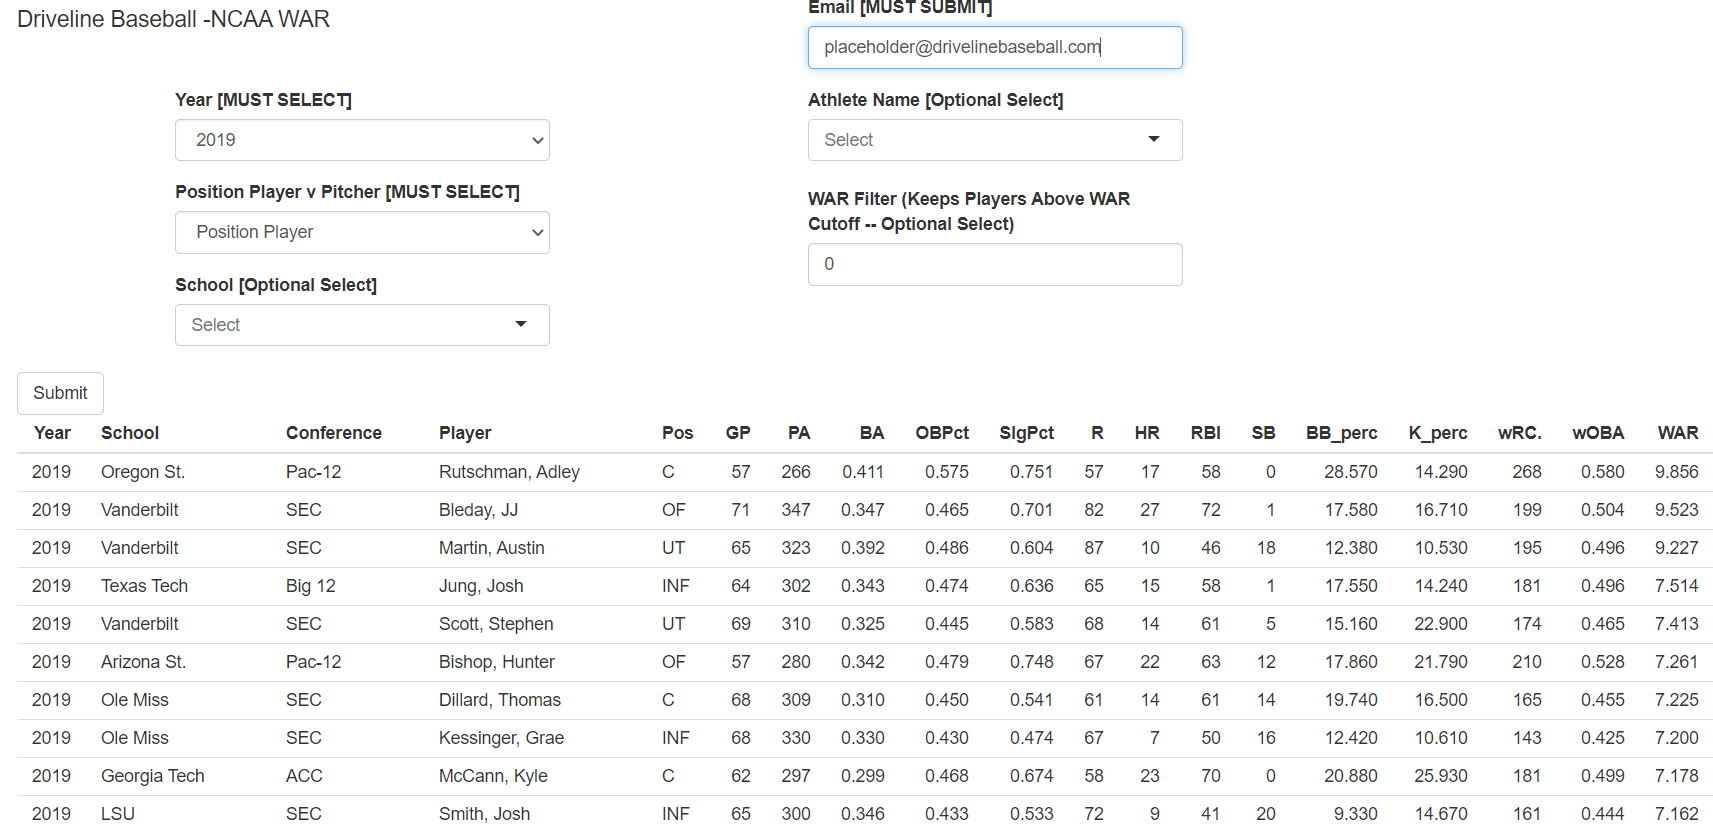
Given the limitations of the metrics found on the NCAA’s website, we were able to calculate Pitcher WAR from 2013-2020 and Position Player WAR for those who cleared the requisite playing time threshold from 2017-2020.
In this blog, we will detail the steps involved in our calculations (based on Fangraphs’s methods detailed here for position players and here for pitchers), and then address the limitations of our version of WAR.
Position Player WAR
WAR = (Batting Runs Above Replacement + Positional Adjustment + Base-Running Runs + Fielding Runs ) / (Runs Per Win)
With position player WAR in baseball, perhaps the most burdensome limitation in our dataset was the lack of detailed fielding positions at the NCAA level. These are difficult to obtain yet necessary for applying positional adjustments and estimating defensive runs saved. Thus, we only have baseball WAR for position players from 2017 onward, as we were fortunate to obtain positions for the vast majority of players with significant playing time (> 150 ABs) across these years via D1Baseball’s stats page.
Batting Runs
To determine a player’s offensive value, we first calculate wOBA for each player, which is derived using NCAA D1 year-specific wOBA coefficients (available on our GUTS page). Given the large amount of variability in offensive environments and strength of schedule across D1 teams, we control for seasonal context by adjusting wOBA using park factors and SOS adjustments via mixed models.
Once we have Replacement Level defined (see below), we calculate wOBA above replacement, then convert wOBA Above Replacement to Runs/PA above Replacement, and multiply by PA’s to get Batting Runs above Replacement Level.
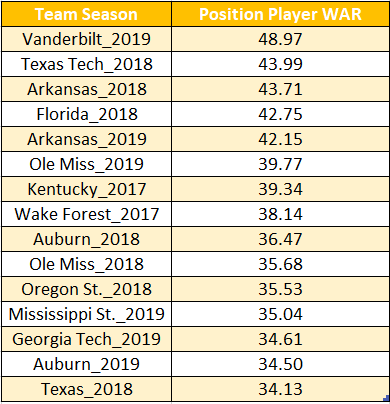
(Leaders in cumulative position player WAR from 2017-2019.)
Replacement Level
Defining replacement level is less straightforward at the collegiate level, as the talent level of non-scholarship athletes / bench players will vary widely across D1 schools. Thus, any specific attempt to define replacement level by looking at the performance of bench players may not reflect a talent level readily available to all schools.
With that constraint in mind, we approached calculating replacement level from a couple avenues. First, we looked at the estimated run differentials of the worst performing D1 college baseball teams over the past 8 seasons relative to D1 average.
We then assumed that 1/2 of their well-below average run differential was attributed to replacement level hitting, giving us a platform to calculate how many runs per plate appearance below average a replacement level D1 team/player produces at the plate.
When Replacement Level Runs Per Plate Appearance is converted to wOBA using the wOBA scale, it produces a similar wOBA output to the subset of players with less than 10 games played during a given season. Thus, we define offensive replacement level as the average production level of players with 0-10 games played in that year.
Note, given the shortened season in 2020, we used the 2019 value for offensive replacement level for 2020.
Positional Adjustments
Without reliable defensive metrics at our disposal, our positional adjustments were based on the relative average wOBA by position, with an additional ad-hoc adjustment to recognize the value provided by playing a premium position. The values we used are below:
Adjustments per 250 PA’s
SS/C: + 3 runs
2B/3B/CF: +1.5 runs
LF/RF: -1.5 runs
1B/DH: -3 runs
Baserunning Runs
Fangraphs uses their comprehensive base-running statistic BsR in their baseball WAR calculation. However, given a lack of baserunning data at the NCAA level, we instead approximate this value by building a model on MLB data to predict BsR per Game using terms from Bill James’s speed score. We then scale these estimates up to the number of the games played for each athlete.
Fielding Runs
As with base-running, we are not able to precisely calculate fielding runs (UZR) at the level of detail used for MLB WAR calculations. As a workaround, we instead approximate UZR using the defensive statistics we have available (i.e. put outs, assists and errors). Given vast differences in positional demands, we built separate models for each position and added some safeguards to correct for a large amount of uncertainty with our values.
Converting Runs to Wins
We convert Runs to Wins using the same methodology as Fangraphs, which was developed by Tom Tango as a simplified version of the Pythagpat formula listed below:
Runs Per Win = 9*(NCAA D1 Runs Scored / NCAA D1 Innings Pitched)*1.5 + 3
In calculating this runs per win value for each season, we find that a win equates to roughly 11-12 runs at the D1 level. We then use this conversion rate to translate Runs above Replacement Level to Wins above Replacement level.
Pitcher WAR
As referenced above, we base our Pitching WAR off of FIP rather than RA9 to better control for the greater variance in park factor and defensive talent that occurs across the D1 level. While the process for pitching WAR encompasses fewer individual components than position player WAR, there are still several steps to go through to calculate it.
WAR = ((Avg FIP – Pitcher FIP)/Dynamic Runs Per Wins + Wins Between Avg and Replacement Level per Nine) * IP/9
Fangraphs starts by adjusting FIP to include IFFBs as Strikeouts, but we, unfortunately, do not have IFFB% by pitcher available to us. Thus, we proceed with standard FIP as the basis of our WAR values (the FIP constants by year can be found on our GUTS page).
Convert to RA9 scale
To translate FIP into units of runs and eventually wins, we need to first convert our FIP metric to be on the same scale as RA9. We accomplish this by adding a scaling adjustment of .92 to each pitcher’s FIP.
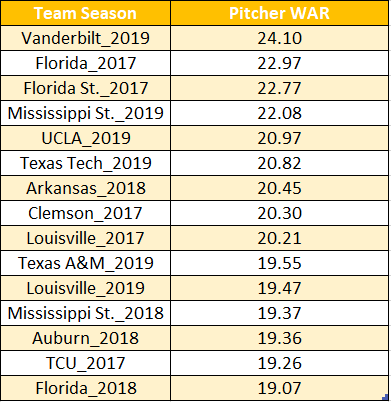
(Leaders in cumulative pitcher WAR from 2017-2019.)
Park and SOS Factor
Similar to Position Player WAR, we want Pitcher WAR to be independent of Park Factor and Strength of Schedule, so we control for both using the same multiplicative park and SOS adjustment factors as above. Note that since we are adjusting FIP and not RA9 or ERA, park factor will be regressed heavily to avoid overfitting on a metric that does not consider non-HR BIPs.
Relative to Avg
Now that we have a park and SOS-adjusted metric on a runs per game scale, we can calculate Runs Above Avg Per 9. To compare each player’s numbers to league average, we repeat the steps above for league average FIP and subtract each pitcher’s RA9 scale-adjusted FIP to this league average value to get Runs Above Avg Per 9.
Dynamic Runs Per Win
While we were able to apply a flat Runs per Win conversion factor for all hitters in a given year, pitchers need to be treated differently given that they significantly influence the number of runs required to win a specific game. As a result, we calculated a specific adjustment to the Runs to Wins conversion factor. For this dynamic runs per win factor, we mirror what Fangraphs uses in their formula:
Dynamic Runs/Inning = [(IP/G)*pitcher’s FIPR9 + (18 – IP/G)*Average FIPR9 ] / 18
The first term in the numerator corresponds to a pitcher’s average number of runs allowed per appearance, while the second term corresponds to the number of runs an average pitching staff would allow in the remainder of the 18 total innings in a game (2*9) that the given pitcher did not pitch.
After calculating the formula above, we convert this dynamic number of runs/inning to output Runs Above Avg Per Nine and subsequently Wins Per Game Above Average.
Replacement Level
Our threshold of Replacement Level, described in the position player WAR section above, is used again for pitcher WAR. However, since position players also contribute to run prevention with their performances in the field, only 43% of the total WAR at the NCAA level per season is given to Pitchers (the same split used across all MLB WAR metrics).
Additionally, since Starters are tasked with longer appearances as well as a larger “times through the order penalty” relative to relievers, we needed to find a more relaxed replacement level to account for the additional challenges they face. To accomplish this, we scale Fangraphs’s replacement level adjustments for Starters and Relievers (0.380 and 0.470 Win percentages respectively) to our NCAA combined pitching replacement level to get Starter/Reliever specific NCAA replacement levels.
These NCAA replacement levels are then translated to Wins Per Game Above Replacement and applied to every pitcher in the dataset based on their proportion of appearances as a starter or reliever.
Scale to IP
Now that we have a rate statistic for Wins Above Replacement per game, we convert this metric to a cumulative value by multiplying by IP/9. This gets us the total number of Wins that a player contributed above replacement level throughout the year.
Additional Scaling
To ensure that we still observe a 57/43 split in WAR amongst position players and pitchers, we apply a small per-inning or per-PA adjustment to the pitching and hitting WAR figures we’ve calculated.
Limitations
While we have made our best efforts to incorporate as much data as possible, the available collegiate data is not as detailed as MLB data.
On the position player side, the main limitations we faced involved calculating Base-Running Runs and Fielding Runs. As detailed above, we do not have direct measurements of these metrics, so we instead approximate and regress as accurately as we can.
While our methods provide decent proxies for both stats, they inevitably miss the finer details that advanced metrics (BsR and UZR) are able to account for. As such, any precise estimates of an individual player’s zone rating / BsR is quite a far stretch and regressed heavily in our calculations.
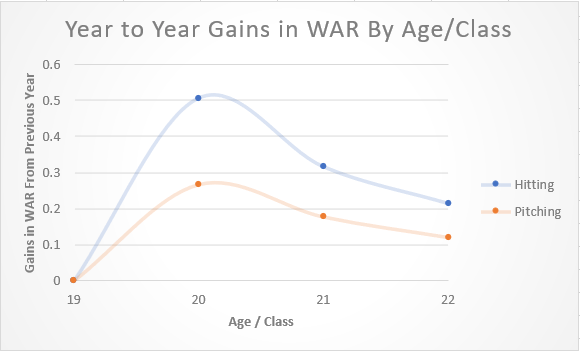
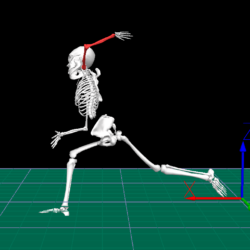
(WAR aging curves at the NCAA level. Improvement in performance is expected each subsequent year in college, with the largest gains occurring from Freshman to Sophomore year)
Our fielding runs model is also dependent upon the position labels we have available. In certain instances, we have found those labels to be incorrect or incomplete. We remove some of the obvious outliers (outfielders with 100 assists, who presumably played in the infield as well), but less conspicuous cases may be included.
Athletes who played multiple positions (especially completely different positions) will throw off our fielding runs model. To control for this uncertainty, we significantly down-weight these fielding runs in our total WAR. Thus, premium defenders will receive less credit than is deserved because of this safeguard.
On the pitching side, the two limitations we face are not adjusting FIP to reward pitchers for Infield Flies, and not adjusting for pitcher leverage. Thus, pitchers with a disproportionate number of infield fly outs and relievers who consistently produce results in high-leverage situations will not receive the full credit that they would receive in MLB-level WAR.
Conclusion
With all of those caveats in mind, we hope that you see as much value in developing WAR at the NCAA level (cWAR) as we do. Like all iterations of WAR, cWAR has its shortcomings, limitations, and potential biases that we won’t shy away from. However, to our knowledge, it also serves as the first stand-alone, park, and SOS adjusted metric that attempts to measure NCAA performance in a scalable manner across all conferences.
That alone will help advance the college game and provide the industry with something we have all wanted for a very long time. We hope you enjoy the dashboard and please let us know any thoughts or feedback you might have.
Comment section
Add a Comment
You must be logged in to post a comment.


Confused statistician -
Great article, I have a quick question however: How does Adley Rutschman have a higher wRC than plate appearances? That doesn’t seem to make much sense to me, many of the players have very high wRC. Does your WAR use wRC+ instead?
David Besky -
Thanks for the kind words. The wRC. listed in the Dashboard is for wRC+ rather than wRC, the ‘+’ character was replaced by a ‘.’ hence the confusion. The batting runs component of our WAR was calculated using the wOBA values from that Dashboard, we just include wRC+ as another related metric of potential interest in the table.
ALEXANDRO -
its simple. the best of the best . incredible article !! recommended full