Hitting Biomechanics

Barrel Direction
At its core, hitting is a matter of hitting the ball hard at productive launch angles. In a physics-sense, that means creating an efficient collision between the bat and the ball.
The direction in which the bat and ball are traveling as they collide plays a role in how energy is transferred between the two objects and in what direction the ball is hit. It’s easiest to illustrate why the direction of two objects matters in a collision by taking a look at a few simple examples (these visuals are from University of Colorado’s Collision Lab simulator, which you can check out to get a better sense of some of the physics principles at play during collisions):
Objects moving on the same path:
Objects moving on the same path:
.
Figure 1. Small changes in the direction of two colliding objects can have large influences on the final velocities and directions of the objects.
These examples aren’t meant to precisely model what is going on during the bat and ball collision, but they do show that small changes in the direction of the velocity vectors of objects can significantly impact the resultant velocities and directions of the objects after they collide. These are two-dimensional examples so there are only two components to the velocities of the objects (x and y). In the above examples the objects start with the same initial x and y velocities, but you can see that by making small changes to how they collide the resulting velocities are very different.
We can use this idea to think about the direction the barrel and ball are traveling in as they collide during the swing, which gives us a good understanding of why a certain swing may lead to a given batted-ball outcome.
In the following analysis we look at four different discrete variables that give a good picture of the direction and position of the barrel when contact happens: vertical attack angle, horizontal attack angle, vertical bat angle, and horizontal bat angle. These four variables give a description of what the position of the bat is and in what direction it is moving at contact, which will help us better understand why different swing characteristics lead to different batted-ball outcomes.
Attack Angle
Vertical Attack Angle
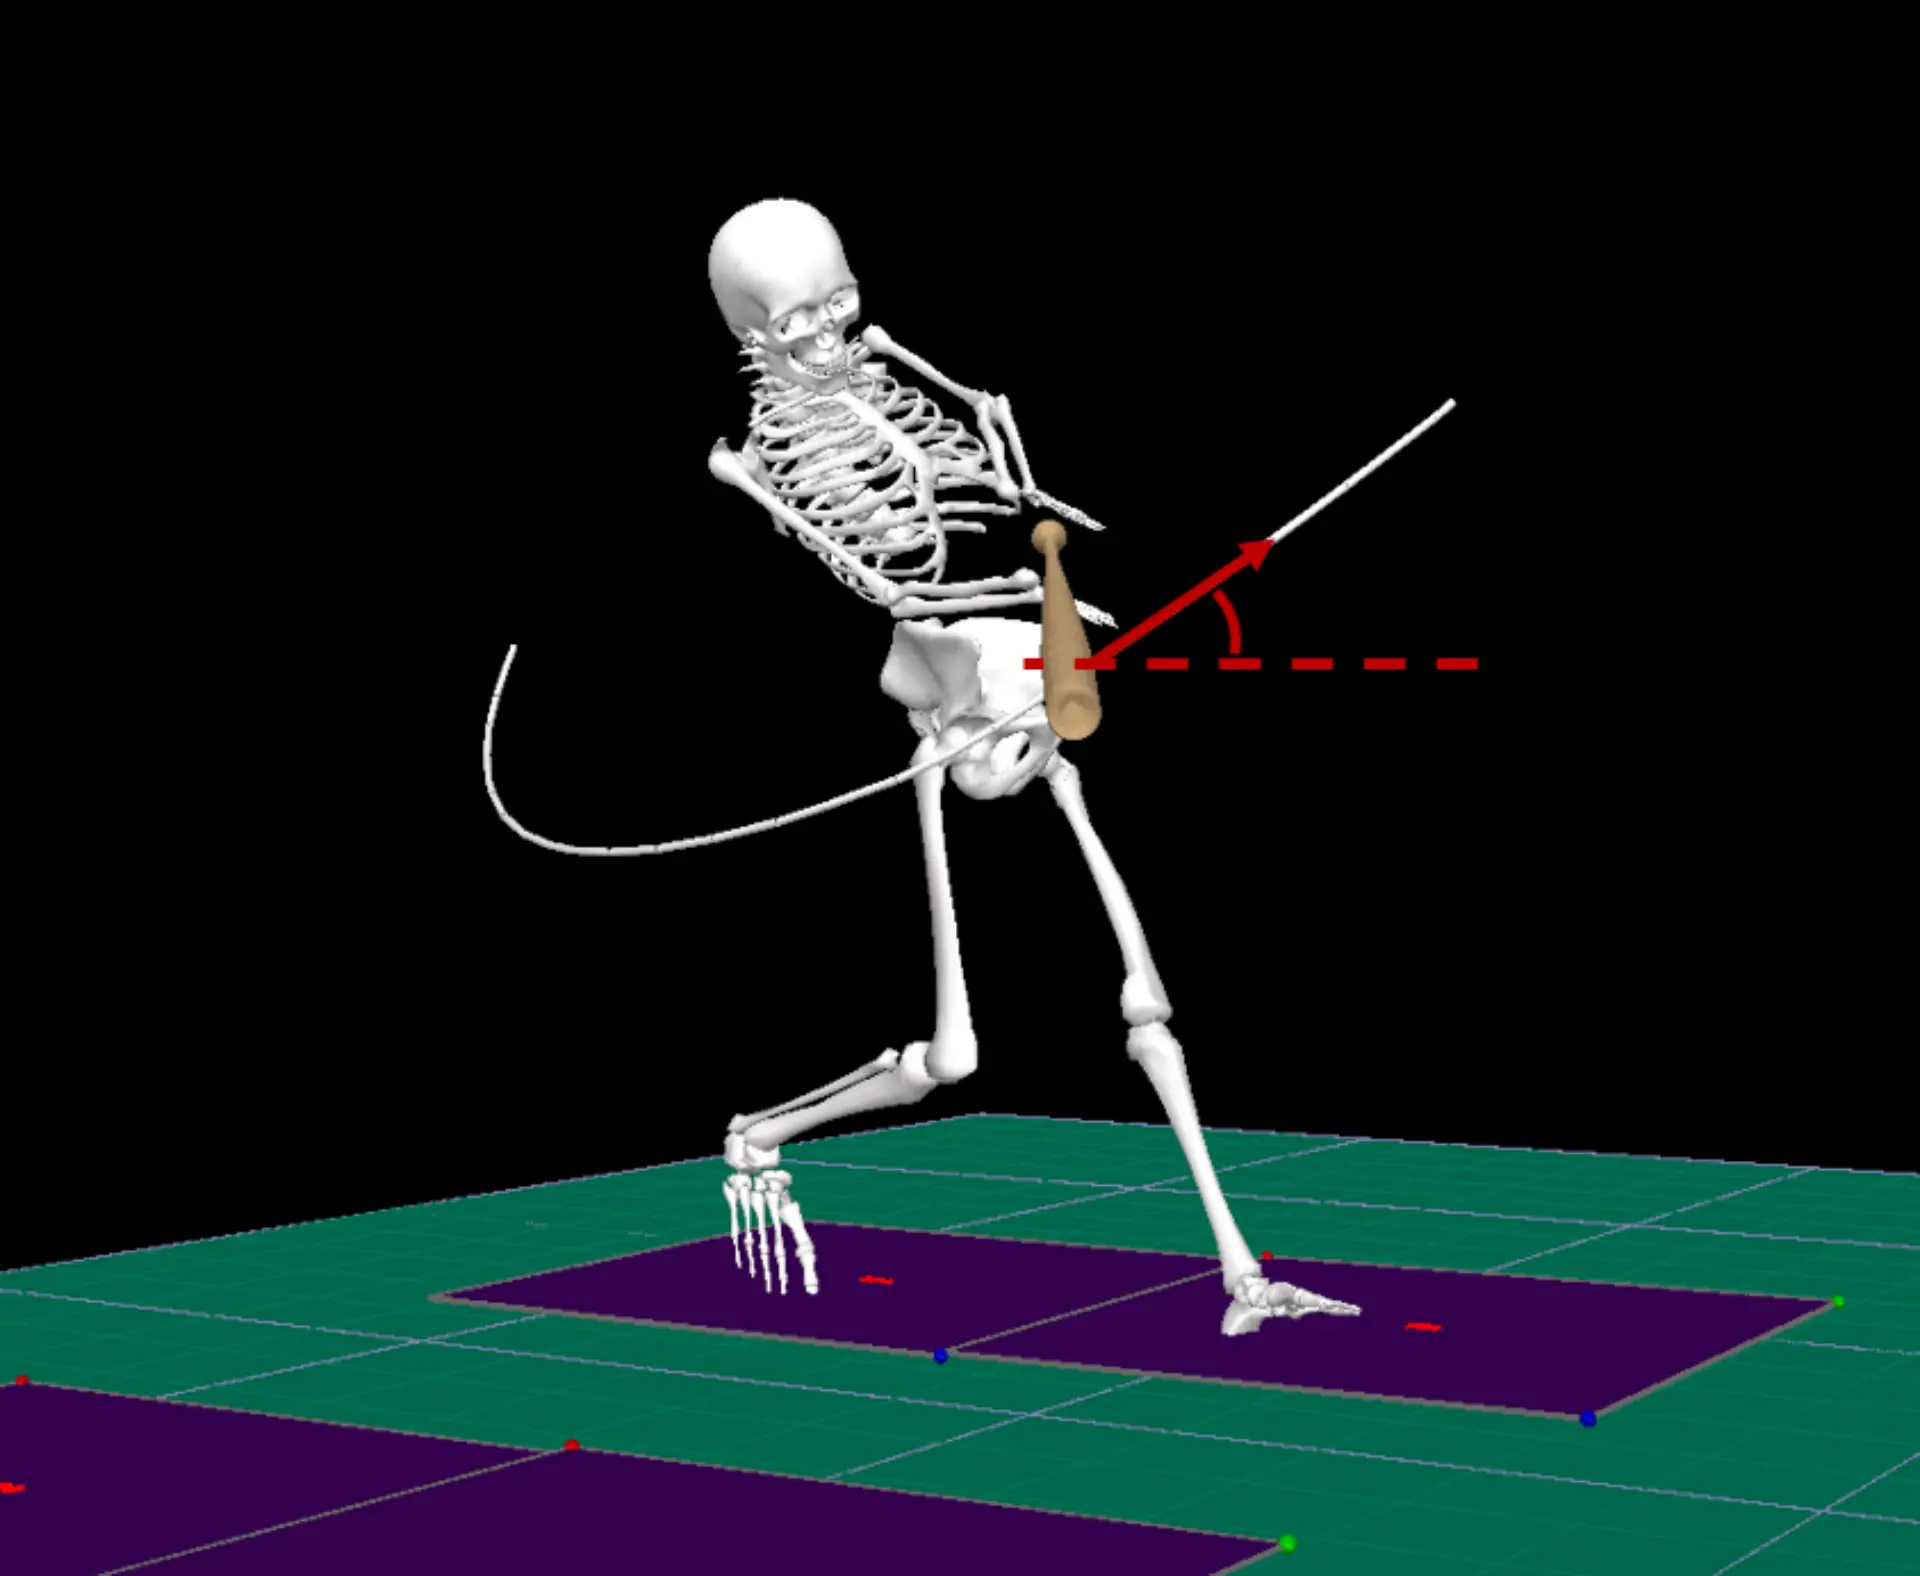
Vertical attack angle (VAA) is a metric that most people reading this are probably familiar with and one we talk about a lot when training athletes. VAA describes the angle between the resultant velocity vector of the sweet spot of the bat and the ground (figure 2). Zero degrees occurs when the barrel is traveling parallel to the ground. A positive attack angle occurs when the barrel is moving upward and a negative angle occurs when the barrel is moving toward the ground.

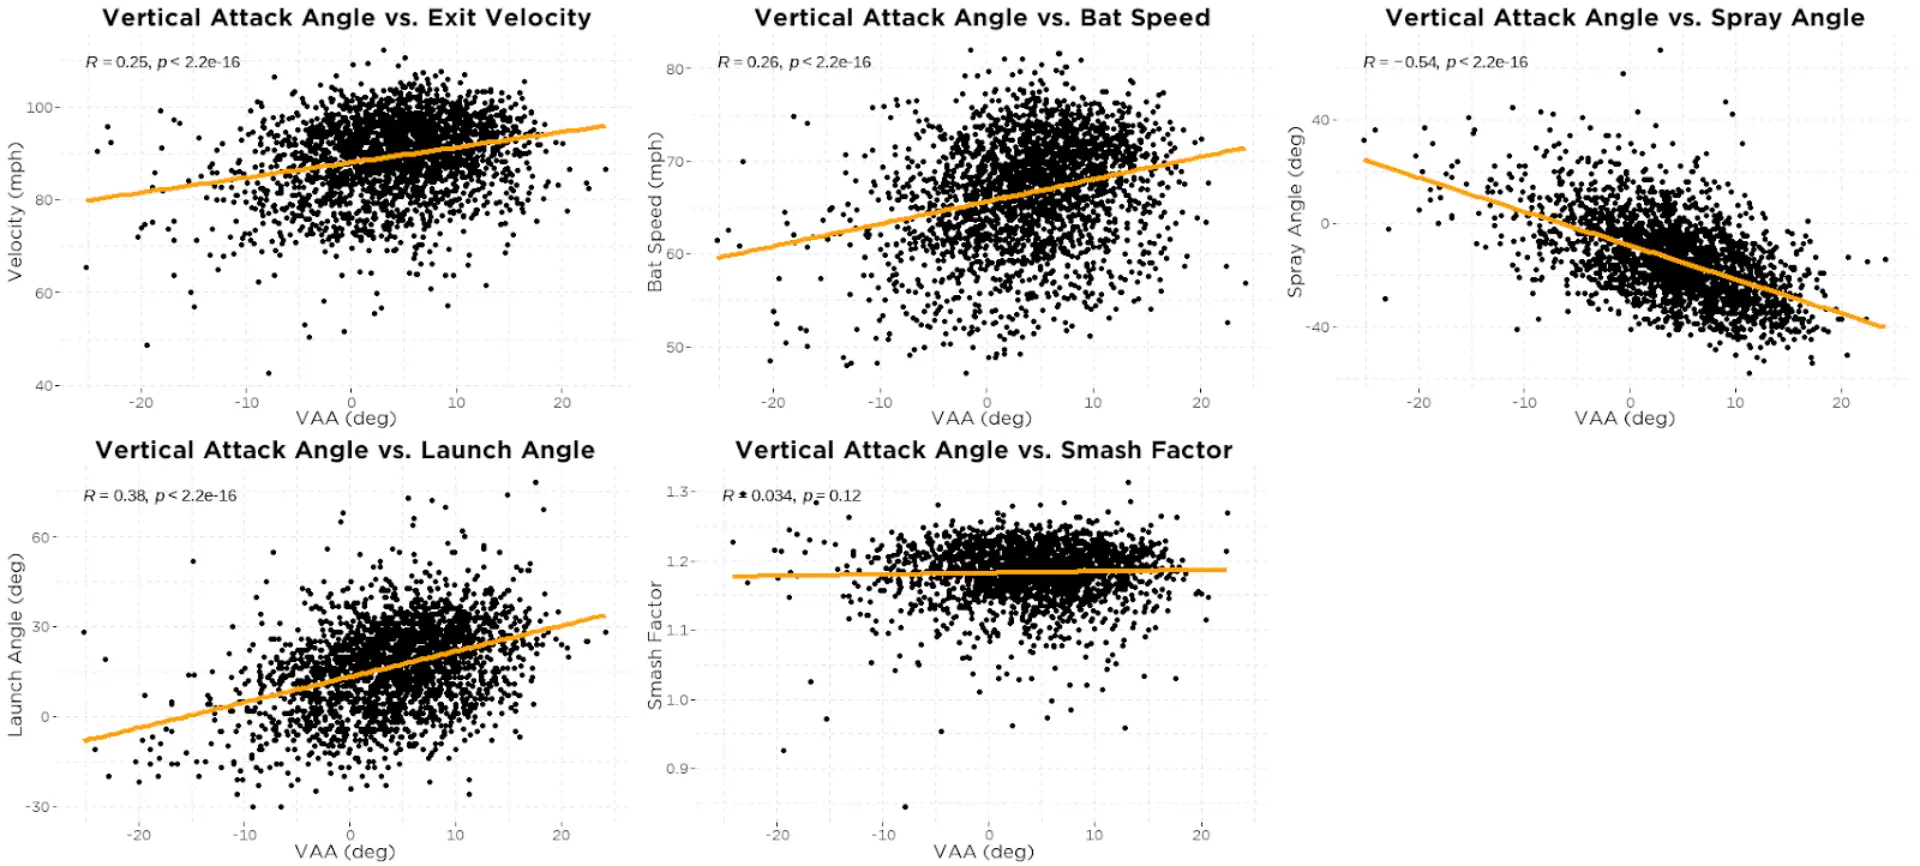
Below we can see how VAA relates to various batted-ball outcomes:

The positive relationship between VAA and exit velocity/bat speed is due to the fact that VAA increases as the POC increases, and both bat speed and exit velocity also increase with POC. The same is true for the negative relationship between VAA and spray angle. Unsurprisingly, launch angle increases with an increase in VAA.
We don’t see any relationship between smash factor and VAA here. This is likely because we only use the 8 best swings of a hitter’s motion capture assessment, so smash factor will be relatively higher for all swings which may make it difficult to see larger trends. It’s possible that this relationship is a little different when taking into account a larger sample of swings, including mishits.
But how does a higher/lower than expected VAA affect batted-ball outcomes? We’ll first need to take a look at how VAA relates to both POC and pitch height to create an expected VAA model (figure 4).

We see that VAA is dependent on both POC and pitch height. This intuitively makes a lot of sense.
For a typical bat path, VAA is going to climb the further out in front contact is made. Similarly, it’s hard to “chop down” or have a steep downward VAA when swinging at pitches at the top of the zone compared to swings at the bottom of the zone.
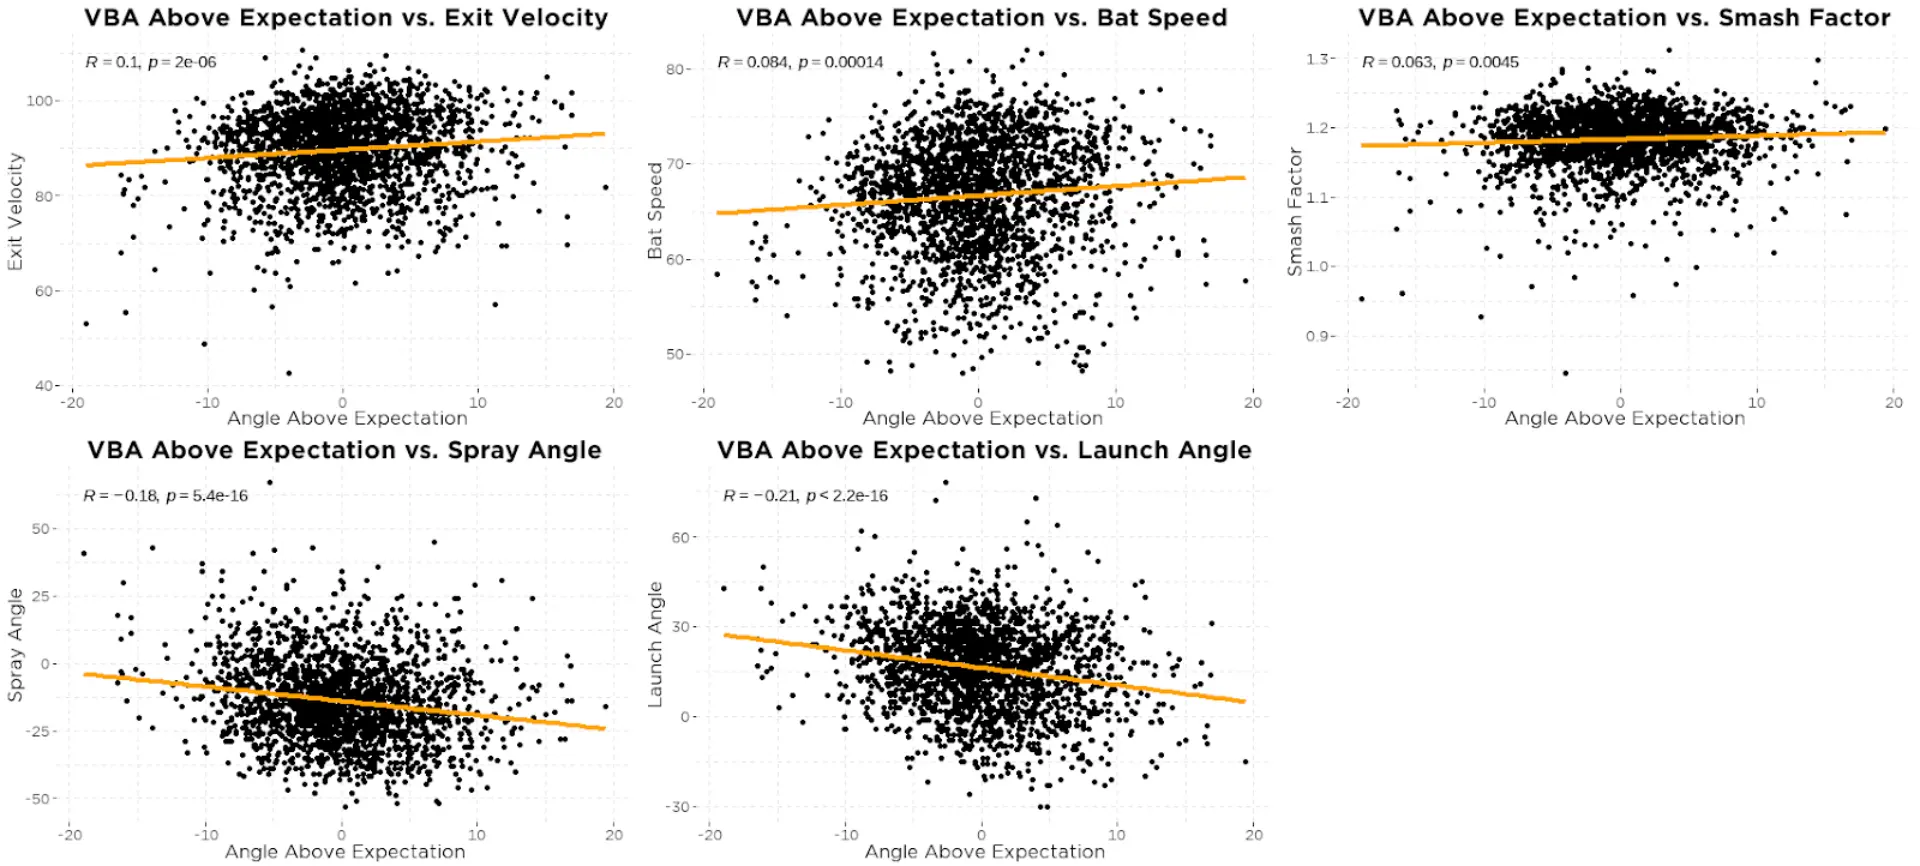
Using these two relationships we can create a model of what we would expect VAA to be given a certain POC and pitch height. And from this model we find that the combination of POC and pitch height explains 61% of the variance in VAA. Taking this a step further, we can use this model to see how hitters who fall above and below their expected value based on this model perform. In other words, we can see how having a VAA above what we would expect at a given POC and pitch height affects batted-ball outcomes (figure 5).

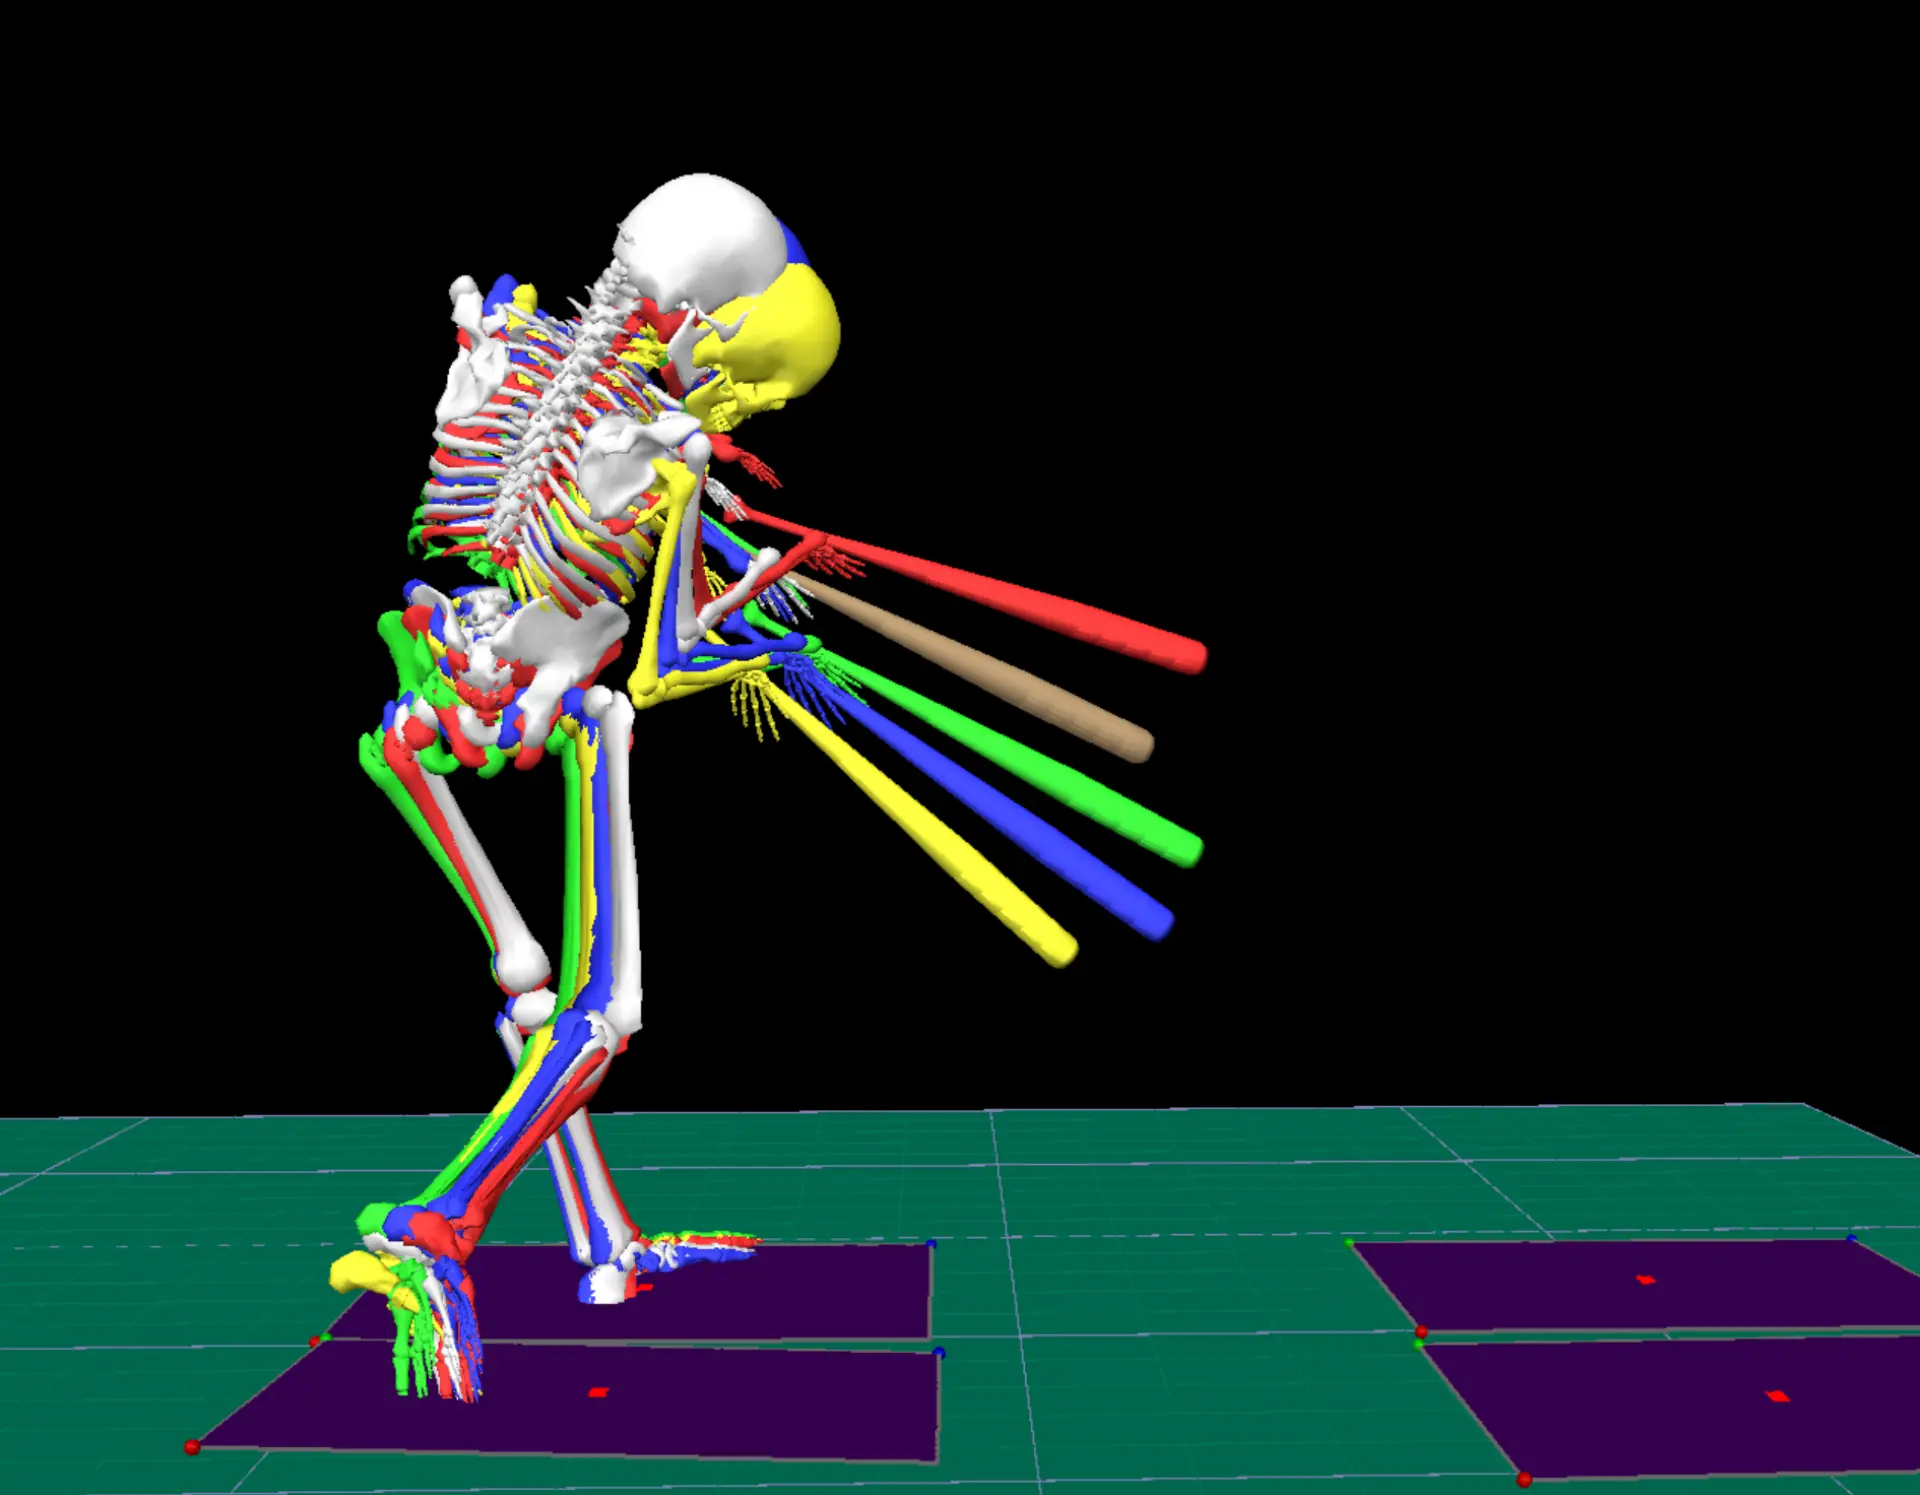
Figure 6. Example of a hitter with a higher than expected VAA (white) and a hitter with a lower than expected VAA (red).
Unsurprisingly, the only variable that seems to have any relationship to higher/lower than expected VAA is launch angle. Hitters that have a higher than expected VAA based on POC and pitch height tend to hit the ball at slightly higher launch angles than those with lower than expected VAA.
Horizontal Attack Angle
Here’s where things start to get really interesting. Unlike VAA, horizontal attack angle (HAA) is something that is talked about less and fewer people are probably familiar with what this is. HAA describes the angle between the resultant velocity vector of the sweet spot of the bat and an imaginary line between home and the mound (figure 7). Zero degrees occurs when the barrel is moving directly toward the mound. A positive attack angle occurs when the barrel is moving toward the pull-side and a negative attack angle occurs when the barrel is moving toward the opposite field.
One of the motivations behind looking at HAA was to attempt to quantify how much a hitter “stays through” the ball. The thought being that a swing with a higher than expected HAA is one that tends to lead to slicing the ball instead of “staying through”. Additionally, measuring HAA may allow us to quantify what coaches often refer to as out-to-in or in-to-out bat paths.

Below we see how HAA relates to the same batted-ball outcomes (figure 8). Similar to VAA, the positive relationship between HAA and exit velocity/bat speed and the negative relationship between HAA and spray angle are due to the fact that HAA increases with POC. This is likely also the case for why we see a positive relationship with HAA and launch angle. HAA and VAA increase as POC increases leading to higher launch angles. And like with VAA, we don’t see a relationship between HAA and smash factor.

Figure 9 helps to better understand why some of the relationships between HAA and batted-ball outcomes shown above exist. We can clearly see that HAA is largely dependent on where contact is made relative to the body.

You’ll also notice that HAA changes with the angle of the bat, which we’ll talk about later and is referred to as the horizontal bat angle or HBA. The more the bat is angled so that the barrel is pointing toward the pitcher, the larger the HAA and vice versa. And we can see below (figure 10) that both POC and HBA have very strong relationships to HAA:

The reason for these similar relationships to HAA becomes obvious when we look at how POC relates to HBA (figure 11):

Before creating an expected HAA model, it’s important to take into account the location of the pitch as we would have reason to believe this could influence HAA. We see that horizontal pitch distance does indeed have a relationship to HAA (figure 12).

HBA happens to be a slightly better predictor of HAA (R2 = 0.87) compared to POC (R2 = 0.82), so HBA was used to create an expected HAA model. Using HBA and horizontal pitch distance we are able to create a model that explains 88% of the variance in HAA, and with this model we can identify swings that have a higher or lower HAA than we would expect.
When looking at how HAA above expectation affects batted-ball outcomes, here is what we see:

Figure 14. Example of a hitter with a higher than expected HAA (red) and a hitter with a lower than expected HAA (white).
Higher than expected HAA appears to be associated with lower exit velocity, bat speed, and launch angle, but there might be more at play here. Without context, it doesn’t make a ton of sense why launch angle would be affected by a higher than expected HAA. When digging a little deeper it becomes clear that this relationship is likely due to the fact that a lower than expected HAA is associated with a higher VAA (figure 15).

We can use a case study to better demonstrate why this relationship exists. Looking at separate swings from two different professional hitters helps us to begin to understand why this may be. These two hitters took very different approaches to hitting nearly identical pitches:

When looking from an overhead view we can see the different bat paths of Athlete A (red skeleton) and Athlete B (white skeleton). From this angle it looks like Athlete A takes more of an out-to-in path to the ball whereas Athlete B uses a more in-to-out path.

This is somewhat of an illusion created by this perspective. When looking at the behind (figure 17) and side (figure 18) views we can see that Athlete A’s and Athlete B’s paths are a bit more similar than they initially looked in the overhead view. The paths have very similar arcs but appear to occur on different planes. In fact, it looks like some of this could possibly be attributed to the difference in torso position between the two hitters.
 |  |
| Figure 17. Behind view showing bat path of swings from Athlete A (red) and Athlete B (white). | Figure 18. Side view showing bat path of swings from Athlete A (red) and Athlete B (white). |
Another reason these swings are ideal for comparison is that Athlete A and Athlete B had a very similar POC and HBA but a different HAA. Looking at the table below we can see that Athlete A has a higher HAA, meaning his barrel is working toward his pull-side more than Athlete B. Indeed, Athlete A’s HAA is 3.4° higher than we would expect given his HBA, compared to Athlete B who’s HAA is 6.1° less than we would expect given his HBA.

However, these swings did result in similar outcomes:

We see that Athlete B achieved this lower HAA by having a lower VBA (meaning his barrel is pointing more toward the ground) and a higher VAA (table 2). This trend is supported by the relationship we see in figure 15 showing the relationship between HAA above expectation and VAA.
Swings with a lower than expected HAA tend to lead to a higher VAA as the barrel works upward rather than around the body, whereas swings with a higher than expected HAA tend to be flatter and on a plane that is closer to parallel to the ground.
Additionally, the difference in posture between athletes in this example appears to be emblematic of hitters that get flagged on either end of the spectrum of expected HAA ⸺ a more upright posture at contact appears to be associated with higher than expected HAA and vice versa. The negative correlation between HAA above expectation and VAA also seems to explain why we see a similar negative correlation between HAA above expectation and launch angle (fourth plot in figure 13). In other words, hitters that swing with a higher than expected HAA tend to have lower attack angles and, because of that, hit the ball at lower launch angles.
You also probably noticed the negative relationship between HAA above expectation and exit velocity (first plot in figure 13), meaning that a higher than expected HAA is associated with lower exit velocities. It’s possible that swings with higher than expected HAA result in less energy transfer from the bat to the ball because the barrel is working in the wrong direction, but it’s also possible that less-skilled hitters with lower bat speed tend to swing with a higher than expected HAA.
When taking into account the negative relationship between HAA above expectation and bat speed (second plot in figure 13), the second hypothesis seems more likely. And looking at the distribution of HAA above expectation across different playing levels (figure 19) we see a trend that, on average, hitters at lower levels tend to swing the bat with a higher than expected HAA when compared to hitters at higher levels (the difference in HAA above expectation between high school hitters and both college and professional hitters is statistically significant).

Given these differences between the playing levels, we can take another look at the relationship between HAA above expectation and exit velocity/bat speed/smash factor, this time split by playing level to see what relationships hold within each playing level group (figure 20):

Across all different playing levels, bat speed is negatively correlated to HAA above expectation (second plot in figure 20). Interestingly, this is not the case when looking at exit velocity (first plot in figure 20). Among professional hitters we don’t see a relationship between exit velocity and HAA above expectation despite there being one for both college and high school hitters. And since professional hitters that have a higher than expected HAA don’t have lower exit velocities despite swinging the bat slower, there is a positive relationship between HAA above expectation and smash factor within this group of hitters.
Some of this may be explained by taking another look at the distribution of HAA above expectation between the different playing levels (figure 19). You’ll notice that there are very few professional and college hitters that have a HAA above expectation over 5 degrees. Compare that to high school hitters that have a wider spread of HAA above expectation and a higher proportion of hitters that swing with a HAA over 5 degrees of what we would expect. This suggests that a very high HAA above expectation is a characteristic of less skilled hitters, and perhaps there is some natural selection at play when we look at higher level hitters. We can see that the negative correlation between HAA above expectation and both exit velocity and bat speed lessens as playing level increases.
Bat Angle
Vertical Bat Angle
Vertical bat angle (VBA) describes the angle between the bat and an imaginary vertical line perpendicular to the ground (figure 21). Zero degrees occurs when the bat is perpendicular to the ground with the knob pointing toward the sky and ninety degrees occurs when the bat is parallel to the ground. Note that this is a slightly different convention than Blast Motion’s VBA metric, but the two are still measuring the same thing.

Below we see how VBA relates to the same batted-ball outcomes. VBA increases (bat gets more parallel to the ground) as POC increases, so we again see similar trends as both VAA and HAA with exit velocity, bat speed, and spray angle. There does seem to be a very small positive correlation between VBA and smash factor (r = 0.11) and no relationship between VBA and launch angle which differs from both VAA and HAA.

As shown below (figure 23 and 24), VBA is dependent on both POC and pitch height. That being said, only 37% of the variance in VBA is explained by both these variables. Just like with the attack angle variables, we can still create an expected VBA model based on both POC and pitch height to see how higher/lower than expected VBA affects batted-ball outcomes.


We see below (figure 25) that swings with higher than expected VBA have a very small correlation to higher exit velocity (r = 0.1) and slightly larger negative correlations to both spray angle (r = -0.18) and launch angle (r = -0.21). And we see no relationship between VBA above expectation and either bat speed or smash factor.

Figure 26. Example of a hitter with a higher than expected VBA (white) and a hitter with a lower than expected VBA (red).
The finding that VBA above expectation is negatively correlated with both spray and launch angle is very interesting but makes sense when thinking about why that might be.
A lower than expected VBA (barrel tipped more toward the ground) is associated with a higher spray angle (ball hit toward the opposite field) and a higher launch angle. This suggests that swings that fall into this category tend to lead to cutting the bottom half of the ball which in turn leads to weaker hit fly balls that tail toward the opposite field. In contrast, higher than expected VBA may lead to hitting the top half of the ball which results in balls hit harder at lower launch angles to the pull side.
Horizontal Bat Angle
Horizontal bat angle (HBA) is the angle between the bat and an imaginary horizontal line that is perpendicular to the line between home and the mound (figure 27). Zero degrees occurs when the bat is pointing directly toward the opposite batters box (when the bat is perfectly perpendicular to the line between home and the mound). The barrel pointing in the direction of the pitcher results in a positive angle, whereas a negative angle occurs when the barrel is pointing in the direction of the catcher.

Like the other variables discussed previously, the relationships shown below between HBA and batted-ball outcomes are a result of a strong relationship between HBA and POC. The most notable and least surprising relationship here is between HBA and spray angle (r = -0.74). An increase in HBA (barrel pointed more toward the pitcher) leads to balls being hit to the pull side.

In the section on HAA we saw how closely related POC and HBA are. However, horizontal pitch distance also dictates HBA to a certain extent (second plot in figure 29). Pitches on the inner half require a slightly larger HBA to make contact and vice versa (figure 30).


Approximately 89% of the variance in HBA is explained by both these variables and we see some interesting things when looking at HBA above expectations (figure 31):

Figure 32. Example of a hitter with a higher than expected HBA (white) and a hitter with a lower than expected HBA (red).
First, you’ll notice that there doesn’t seem to be much of a relationship between HBA above expectations and either exit velocity or bat speed, BUT there is a slight negative relationship with smash factor (r = -0.15). This means swings with higher than expected HBA tend to result in slightly worse contact quality.
There is a small negative relationship between HBA above expectation and spray angle and a small positive relationship between HBA above expectation and launch angle, both of which follow intuition. Hitters that have lower than expected HBA may struggle to pull the ball and hit the ball in the air, whereas hitters with higher than expected HBA tend to pull the ball at higher launch angles.
Key Takeaways
That was a lot of information and there is still much more to look into when it comes to barrel direction and bat path but, for now, here are a couple key takeaways:
● The vertical and horizontal attack angles tell us what direction the barrel is moving in, which provides added context to a hitter’s batted ball profile.
Specifically, a higher/lower than expected VAA may explain a hitters launch angle profile irrespective of where contact is made, whereas a higher/lower than expected HAA may be influencing a hitters exit velocity, launch angle, and smash factor.
● The vertical and horizontal bat angles tell us the position of the barrel of the bat, which can also provide additional context to a hitter’s batted ball profile.
Higher/lower than expected VBA may help explain why a hitter tends to cut balls or hit top-spin ground balls and higher/lower than expected HBA may help explain why a hitter struggles to pull the ball and get the ball in the air or why they tend to have a lower smash factor.
Now that we have a better understanding of how each of these variables relate to performance at a discrete time point in the swing (contact), it will be interesting to conduct full signal analysis to see what is unique about the entire bat path of hitters at different skill levels. So stay tuned for more insights into hitting biomechanics as we continue to dive deeper and deeper into the data!
Comment section