2018 Summer Pitching Review
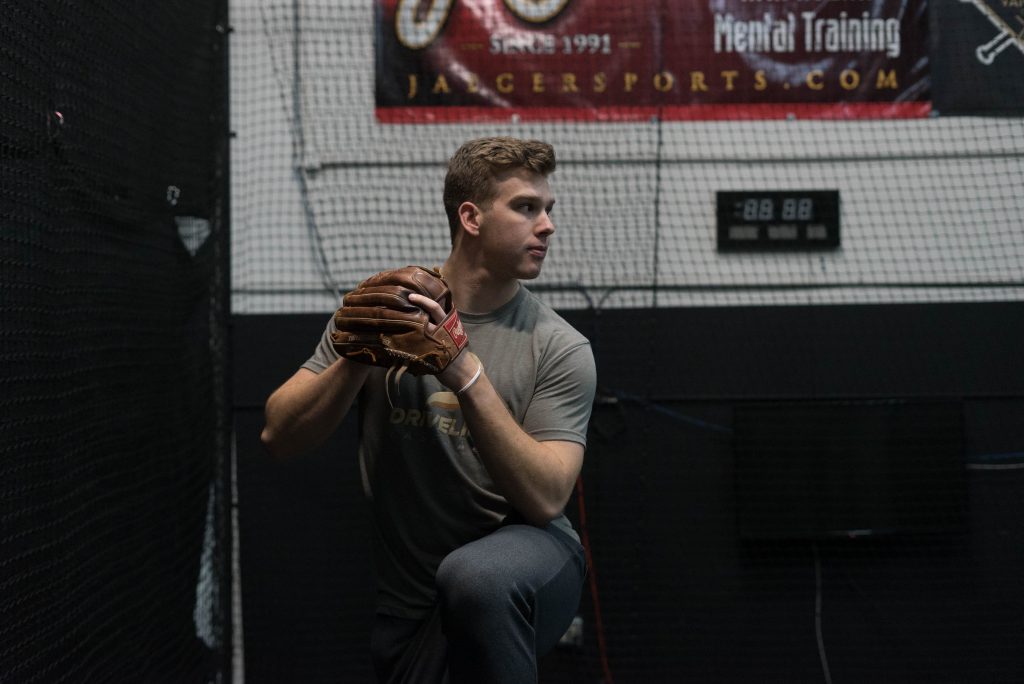
During the summer of 2018, we had over 265 on-site pitching assessments from May to September. Of those 265 athletes that trained at our facility, both entry and exit bullpen data was recorded for 120 pitchers to run analyses on.
To obtain a more objective measurement on the net effect of our program, we revamped our initial bullpen protocols so that we could gain a more accurate baseline-velocity metric for our incoming athletes. Instead of having athletes throw just five fastballs off the mound during their first day at the facility, we decided to move their initial bullpen to day five and instructed them to throw anywhere from five to fifteen fastballs. These changes were designed to better prepare athletes to throw max intent, to mitigate any lingering effects of travel fatigue, and to increase sample size.
Overall, our entire sample of summer athletes gained an average of .74 mph on their fastballs, which increased to .95 mph for athletes who stayed at the facility for at least three weeks.
The average change in velocity for on-site athletes is smaller when compared to previous years. We attribute this change to a variety of reasons:
- Our methods for calculating initial baseline-velocity readings are more objective and better designed for athletes to throw as hard as possible during week one.
- Unlike in years past, athletes are no longer exclusively put on a velocity development program. We now have command, pitch-design programs and of course strength programs that are customized to athlete needs.
- Facilitated through our integration with TRAQ and Online Pitching, training plans can be better optimized for long-term development. As such, it is typical to see a heavier programming emphasis placed on the strength components of training for in-gym athletes.
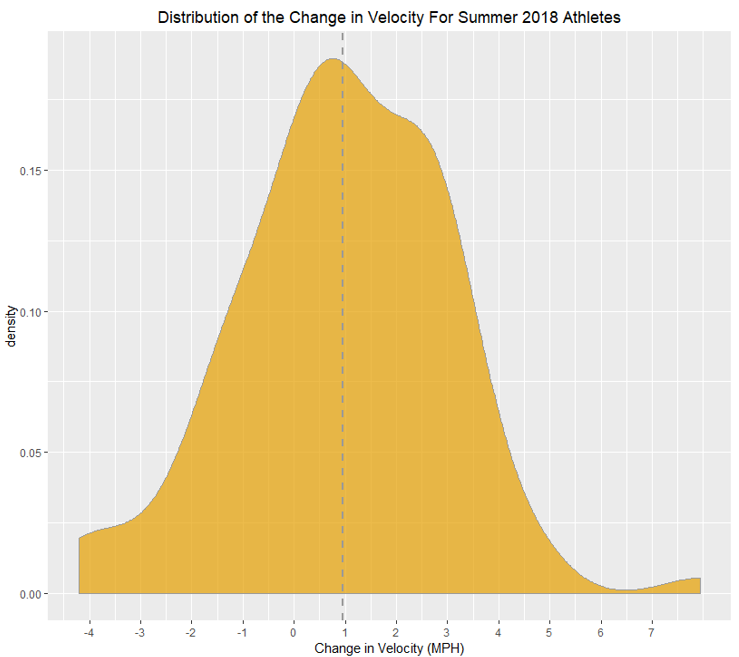
Of course, beyond knowing what the average gain in velocity is for all our athletes, understanding how these gains are distributed is also important. Below is a density plot that illustrates the change in velocity for athletes who stayed longer than three weeks.
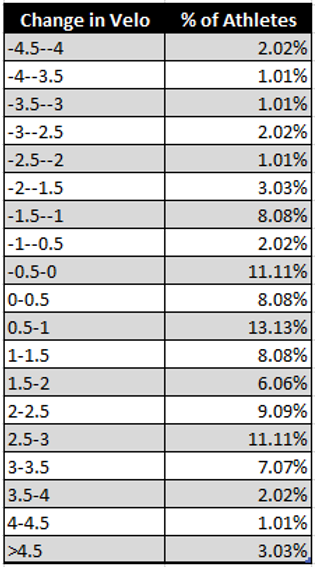
If we grouped the outcomes of our summer 2018 Athletes by the change in velocity in .5 mph increments, we get the table below:
Altogether, 60.61% of our summer 2018 athletes who stayed at least three weeks gained at least .5 mph on their average fastball velocity from initial to exit bullpen, 19.19% maintained about the same average velocity (±.5 mph), and 20.2% lost velocity from entry to exit bullpen.
This highlights a few important concepts in regard to velocity development:
- Gains are not linear nor uniform amongst an entire population. Some athletes experience gains immediately, whereas others do not. Therefore, it is vital that you view training from a long-term perspective, regardless of recent outcomes. This is why over 70% of our on-site athletes continue with us remotely once they leave the facility.
- Nothing is a guarantee when it relates to human performance. Improved velocity will always be a function of hard work, a well-functioning program, and chance. Even a big leaguer’s velocity fluctuates from start to start.
- Everyone’s body is unique and reacts differently to various stimuli. As a result, we constantly assess and reassess our athletes to assure that our programming meets their specific needs.
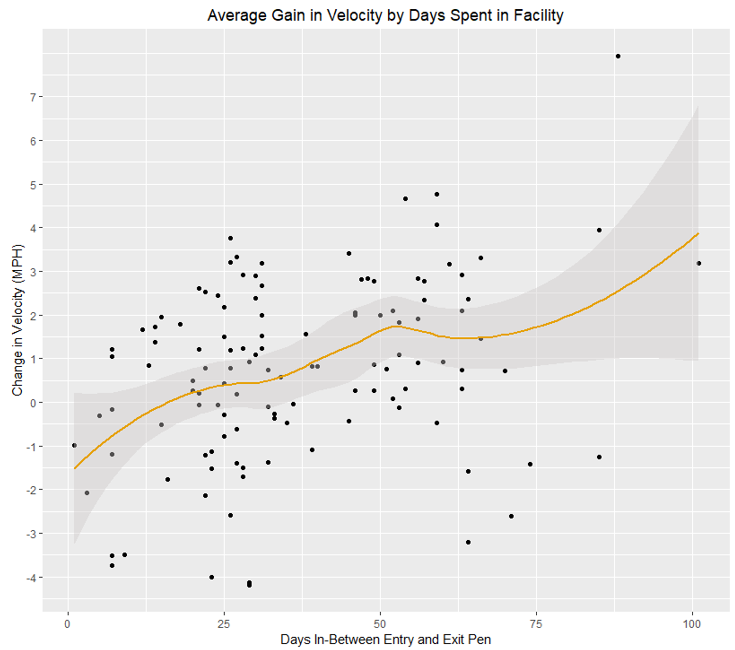
To visualize these concepts, we can plot the change in velocity for summer 2018 athletes by the days they spent in the facility using the scatterplot below.
On average, better outcomes occur for athletes who stay with us for longer periods of time. However, there will always be peaks and valleys (or variance) along the way.
Lastly, as mentioned above, a greater proportion of athletes who have trained on-site with us have shifted their training focus to programming outside of velocity development in its traditional form. With new advances in ball-flight technology, high-speed cameras, and training equipment, athletes can prioritize learning off-speed pitches, optimizing their arsenals, or developing command in more efficient ways.
It should be noted that velocity development is still king and what is most tightly correlated with improved performance. However, for the physically mature pitcher that has reached, or is on the cusp of reaching his velocity ceiling, a pitch design or command focus can help unlock more production out of an already established repertoire and be a more efficient usage of training economy (as measured below).
As always, our data for our summer 2018 athletes is available, as well as our summer 2017 and summer 2016 data.
This article was written by Dan Aucoin
Comment section
Add a Comment
You must be logged in to post a comment.

Ian -
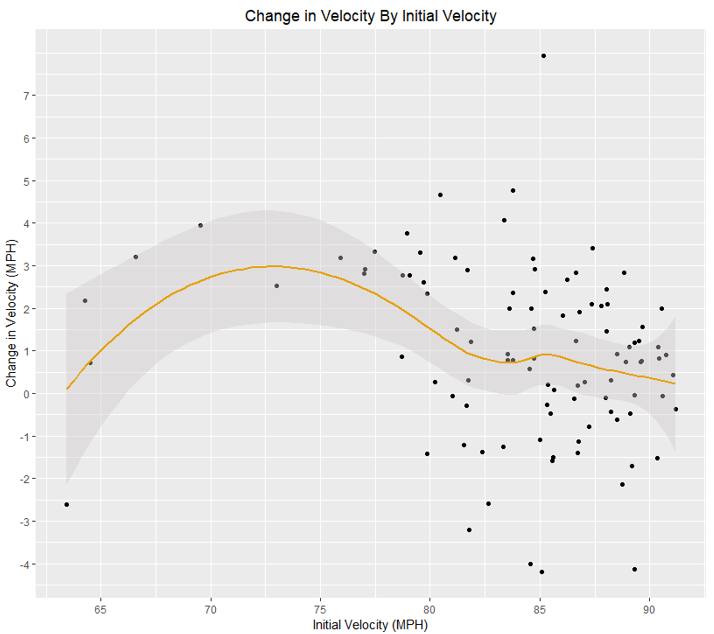
It is interesting that those with velocity under 80 are most likely to see larger positive changes in velocity but your client focus in the facility is on more elite throwers at 85+. Is this due to some easy fixes for younger throwers at the facility?
MICHAEL O'CONNELL -
Generally speaking, the harder an athlete throws the harder it is to throw faster. Compared to each other, it’s easier to go from 80-85 than 90-95.
Strength also tends to be more of an issue for pitchers who are in the 80 MPH range.
Ian -
What min strength benchmarks (to body weight) are you looking to achieve before modifying programming? Would BP 1.5x S 2x DL 2.5x be enough?