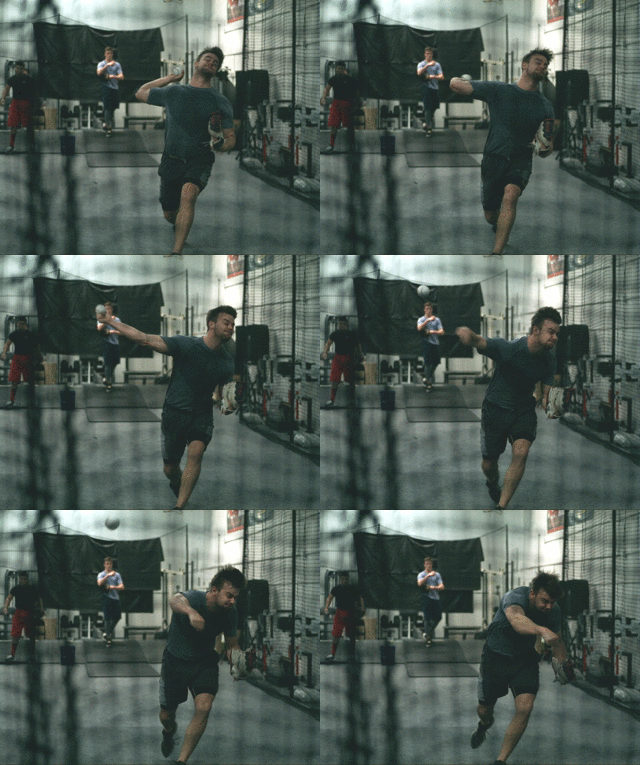
Driveline Baseball Review – College Summer Training Results 2016

182 athletes trained in our facility this summer. To review the results, the average athlete’s mound velocity improved from 86.7 mph to 90.04 mph.
Yes, our college summer athletes averaged 90mph off the mound. Below is some more data we collected on their training.
Weighted Ball Pull-downs and Non-linear Velocity Development
Of those 182 athletes 150 of them were in the facility long enough for them to pulldown in the facility. The average peak pulldown of those 150 athletes was 92.46 MPH.
A critical finding this summer was seeing the longer athlete stayed the more their pulldowns improved.
We’ve had previous blog posts on frustrations with long term velocity gains. Here are some examples of non-linear velocity development with pulldown numbers from this summer.
Does it Transfer? Comparing Pull-downs to Mound Velocity
We were able to get self reported spring velocities from 61 players who threw bullpens. They had an average mound improvement of 3.26 MPH when comparing spring velocity to post Driveline velocity.
We ended up finding a pretty high correlation between pulldown velocity and mound velocity. This includes pitchers who did not have a reported spring velocity.
Here’s what our summer data tells us about where pitchers were on the mound by looking at their pulldown numbers.
You can find the data from this summer here.
We are looking forward to expanding this data collection into the pro offseason!
Comment section
Add a Comment
You must be logged in to post a comment.
Weighted Baseball Research and the Data Supporting Their Use - Driveline Baseball -
[…] between the 5 oz mound velocity and 5 oz crow hop velocity (7.8 MPH) is very large. This last summer we found the average difference to be 5.35, with a sample of 73 pitchers. Our closest comparison to this […]