Relationship Between Vertical Jump Force and Pitching Velocity

Throughout this summer we wanted to investigate the relationship between vertical jump force production and throwing velocity. Instead of looking at vertical jump height, we instead used our Neulog force plates to examine whether the amount of force produced when doing a counter-movement jump (CMJ) was correlated to throwing velocity.
The research on the relationship between vertical jump and pitching performance doesn’t show a strong relationship, but replication of research is always a valuable endeavor.
A study on cricket players did find a moderate relationship between vertical jump and throwing velocity – but only after a multiple regression analysis.
Strength and Power Correlates of Throwing Velocity on Subelite Male Cricket Players
Found a non-significant trend was observed for vertical jump height. But after a multiple regression analysis vertical jump height reached statistical significance (r=0.51). A moderate .47 r-squared was found between vertical jump and stretch velocity. A stronger .51 r-squared was found between vertical jump and shuffle velocity.
Baseball Athletic Test: A Baseball-Specific Test Battery looked at a variety of research studies in order to create a baseball specific athletic test. He found the average broad and vertical jump increased when comparing high school, NAIA and D1 collegiate athletes.
Anthrompometric and Performance Comparisons in Professional Baseball Players found difference between Rookie, A, AA, AAA and MLB vertical jumps, but they were non-linear and showed to be non-significant after analysis.
And last, Correlation of Throwing Velocity to the Results of Lower-Body Field Tests in Male College Baseball Players found non-significant trends between vertical jump and velocity.
Our Study
We ended up with 29 athletes that we had vertical jump force data and pulldown numbers and 17 athletes that we had mound velocities for using Trackman peak numbers.
Each athlete had 3 counter-movement jump (CMJ) trials with one foot on each force plate. The peak forces for the right and left leg were recorded for each jump. The forces of the right and left leg were then added together to create a ‘total force’ number for that one rep. The total for from that jump was then divided by the athletes bodyweight. The three force/bodyweight numbers were then averaged to make one measurement for each athlete.
Below you can see the results that we had when we compared an athletes force/bodyweight to pitchers pulldown and mound velocity.
*Force/bodyweight numbers are in Newtons.
We ended up finding very small r-squared for both, 0.022 when comparing avg force/bodyweight to peak pulldowns and 0.014 when comparing force/bodyweight to peak Trackman velocity.
You can also find the data for your own analysis here.
The relationship that we found between vertical jump force and velocity was nearly zero. So if we were to say that vertical has little to no impact on pitching velocity, what does that mean when looking back at the research?
Correlation Doesn’t Mean Causation
[clickToTweet tweet=”If an athlete trained to throw harder – does that mean he will also jump higher?” quote=”Think of it this way: If an athlete trained to throw harder – does that mean he will also jump higher?”]
Two of the studies mentioned previously saw differences when comparing athletes of different age or performance levels (A, AA, etc). But none showed vertical jump to be predictive of pitching velocity – that’s a very important distinction to make.
In Baseball Athletic Test: A Baseball-Specific Test Battery, is it surprising when comparing the playing levels from high school to different college levels that height, weight, vertical and throwing velocity increased? Not at all. Some of those differences are obviously going to be self-selecting when we start looking at recruiting of different college levels. More importantly: Does that information mean that one directly caused the other(s) to increase? Not necessarily.
Let’s take another quick example: A 16 year old pitcher wants to work on his lower body strength to try and throw harder. He is determined in his goal and ends up sticking to a weight lifting schedule until he finished high school so he can continue to play baseball in college.
So he gets a strength coach, goes in the weight room and trains his legs using deadlifts, squats and single legged exercises. By the time that he is 18, is it surprising that he throws a little harder, jumps a little bit higher, and runs a little bit faster? No. Changes like these are not surprising to see, which is why we need to look closer at correlation and causation.
Just because measurables like vertical jump or 60 yard time increased with playing level doesn’t mean that the players playing in MLB spent hours training their sprinting and vertical jump abilities.
It certainly doesn’t mean that if they did spend time increasing those measurables that it would ALSO make them throw harder.
Planes of Motion
The relationship how athletes measure up in the weight room and their performance metrics (i.e velocity) is clearly intertwined. The likelihood of an athlete training solely to increase his vertical jump in hopes of throwing harder will be very unlikely to succeed. Why?
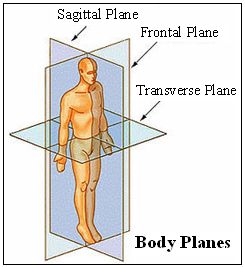
Because strength and power are plane specific. A vertical jump takes place in the sagittal plane while pitching takes place mostly in the frontal and transverse planes. Vertical jump is NOT a complete measure of lower body power, it is a measure of power in one plane of motion.
A sagittal plane exercise would be moving up and down like a squat, a frontal plane exercise would be moving side to side like a lateral lunge, and a transverse plane exercise would be rotation like a medicine ball rotational throw.
One study specifically found bilateral tests such as vertical jumping, horizontal jumping, and running speed in the sagittal plane did not substantially correlate with high throwing velocity. Instead they found high correlations between velocity and lateral to medial jumps for both left and right handed throwers.
“Traditional exercises performed in the sagittal plane (lunges, single-leg squats, deadlifts) should not be excluded but rather serve as a means of increasing overall lower-body power in the initial phases, such as anatomical adaptation, hypertrophy and maximum strength of an off-season strength program.”
What Does This Mean for Training?
Working out is incredibly important to an athlete’s career. Getting stronger in the weight room should be a priority. Simply to be able to keep putting weight on the bar as time goes on is a huge task.
Instead of training for a sport specific skill that isn’t used everyday, such as a vertical jump, your weight training program should be focused on covering all three planes of motion. And if your scratching your head for ideas on how to do so, you’re in luck. We’ve talked about ways that you can train in the frontal and transverse plane before.
Throwing a baseball is in itself is a very sport-specific skill. The best predictor of performance for pitchers is going to be sport-specific skills, which in the case of baseball pitchers is velocity and command, rather than one performance measure like vertical jump distance.
What’s Next?
When looking closer at the existing research, there was one section of Anthrompometric and Performance Comparisons in Professional Baseball Players that stood out as different that the rest.
In looking at a wide range of performance comparisons between different playing levels (Rookie ball, A, AA, AAA and MLB) the authors did find a difference in vertical jump but it was small and it didn’t linearly increase between levels. But they found bigger differences when they compared the mean and peak power (measured in Watts) of the athletes who jumped! This study also looked at baseball players as one group and didn’t differentiate between pitchers and position players.
Look at all three sections and note that the y-axis changes between each measurement. Vertical Jump was measured in centimeters (a 70 cm vertical is about 27 1/2 inches) while power was measured in Watts.
Our next step is looking past vertical jump force production and using linear position transducers like Tendo Power Analyzers and GymAware to look at how athletes jump high. We know that we can test our athletes for vertical jump and they can have the same vertical jump height but we often fail to realize that they can reach that height in difference ways. They can get there with different power metrics.
So we will be examining the peak and mean force of our pitchers so we can see how those numbers relate to velocity.
If you are curious in trying to measure your own peak and average power, we can help you out there as well. The Harman formula – which is an estimate of power output based on jump height and body mass – for calculating peak and average power can be found below:
Peak Power (W) = 61.9 (jump height (cm) ) + 36.0 (body mass (kg) ) +1,822
Avg. Power (W) = 21.2 (jump height (cm) ) + 23.0 (body mass (kg) ) – 1,393
To find your weight in kg: take your body weight in pounds (lbs) and divide it by 2.2.
To find your vertical jump height in centimeters: take your jump height in inches (in) and multiply it by 2.54.
Those will get you some good estimates if you would like to run your own study without expensive equipment such as Tendo/GymAware. Best of luck!
The majority of this article was written by Michael O’Connell, who is our first analyst in the Research and Development department of Driveline Baseball. He also collected all of the data and designed the study. This article was edited and approved by Kyle Boddy, President/Founder of Driveline Baseball.
Want to learn more about strength training as it relates to being a better baseball pitcher? Read all of our articles relating to strength here.
Comment section
Add a Comment
You must be logged in to post a comment.

Analyzing Lower Half Pitching Mechanics Using Force Plates - Driveline Baseball -
[…] have written about studies relating vertical jumps to pitching velocity, as well as conducted our own research on the topic. While our research yielded less than favorable results (r^2 = 0.014), other studies […]