Youth Baseball Pitching Mechanics Analysis Across Age Groups
Written by David Besky, Data Scientist II
As referenced in our look at velocity measurements across the youth data we have from our Driveline Academy athletes, we’re collecting data on a sizable sample of youth athletes as they age, and are extremely excited about the research opportunities that will open up.
In that analysis, we considered the distribution of metrics (pitch velocity, bat speed, and exit velocity) across our different age groups to get an idea of how those tend to change as athletes age (with the caveat that we’re comparing different athletes across each group). Here, we take a similar look at the biomechanics data we’ve collected by having all Driveline Academy athletes throw in our motion capture lab.
Our desire to keep youth pitchers safe and competitive goes beyond just tracking pitch counts. But with our lab, we’re able to take a next-level look at how players move and how they change over time.
Motion Capture Lab
Our markered motion capture lab is a staple of our training programs with our high school, college and pro athletes, and it allows us to track body segments with submillimeter accuracy. This allows us to precisely quantify how athletes are moving—offering unique opportunities for player assessment and research into what distinguishes how the best athletes move.
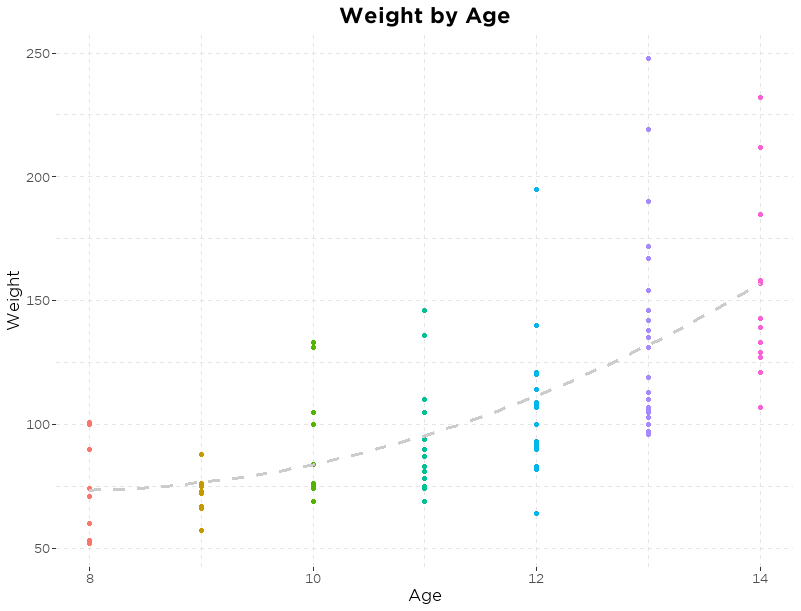
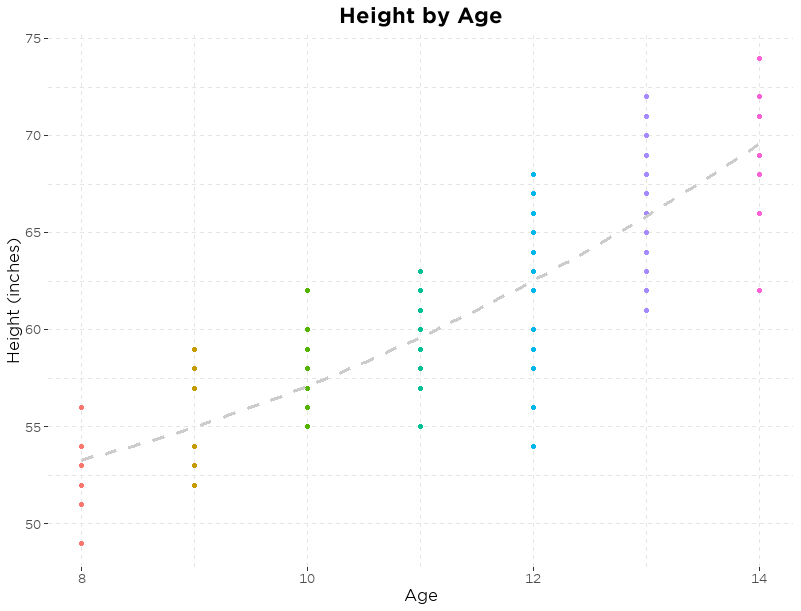
When considering youth data, we see a pretty broad range of heights and weights for the 8-14 year olds in our data set. We do see athletes typically get bigger as they age, but even within a team we see a wide spread in terms of how big (without loss of generality) a 12 year old is.
For this analysis, we largely consider joint angles and angular velocities, which are somewhat agnostic to the weight difference across age groups. That is, we’re looking at how quickly an athlete’s joints are moving, which (as opposed to energy/torque/momentum) isn’t directly a function of the athlete’s weight, so the numbers are naturally scaled to each athlete’s weight.
We had athletes mocap in November of 2020 and then again in the summer of last year to get a test-retest comparison to track their changes. We repeated this process with our increased number of athletes in the Academy this fall to generate more baselines.
For this analysis, we consider only the first mocap from each athlete (we’re still processing many of the athletes from the fall at the time of this writing). We chose to consider their first mocap so that the sample is minimally influenced by any training the athlete has done with us. We see 99 different athletes between the ages of 8 and 14.
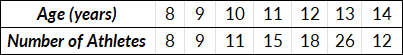
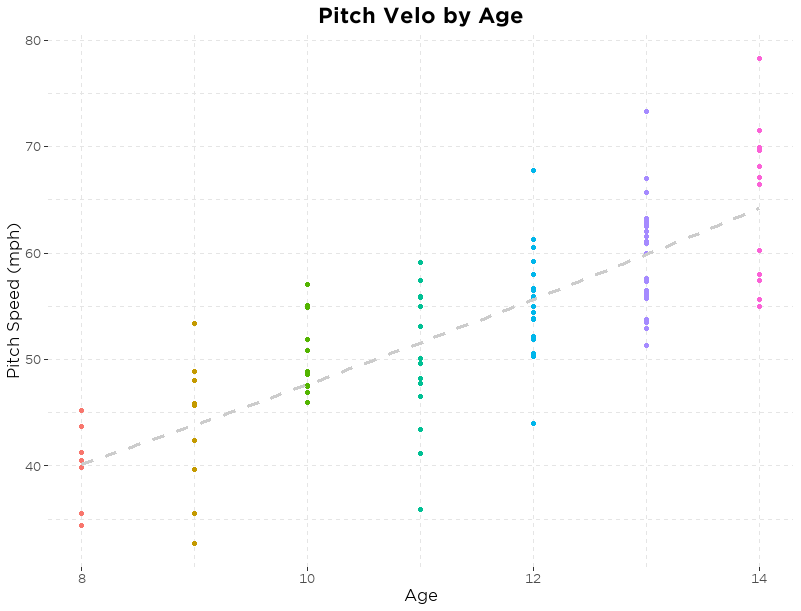
To get a general idea of what we’re working with, here’s a look at the spread of height, weight, and velo by age across this population.
Movements differ on average between younger and older athletes. Here are several of the core metrics we usually consider important indicators of how an athlete is moving, organizing them into lower half metrics, arm action metrics, and posture/core metrics.
Lower Half
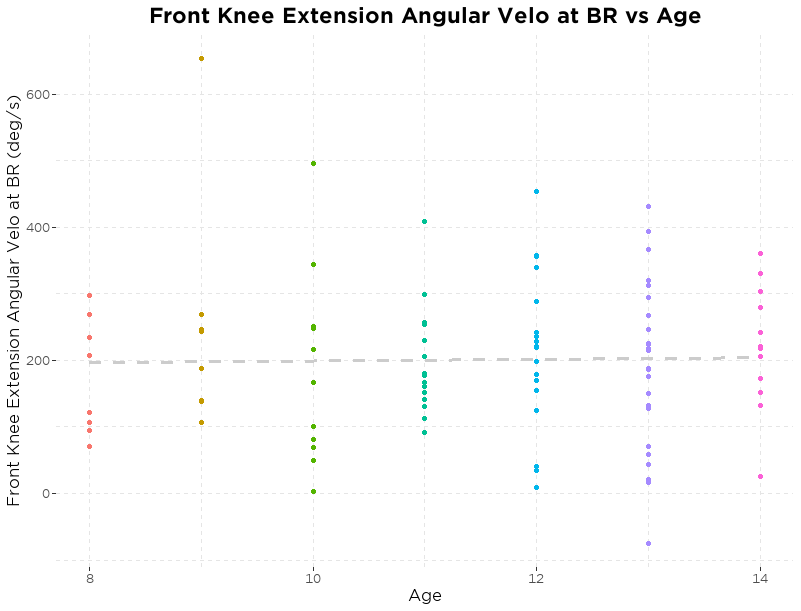
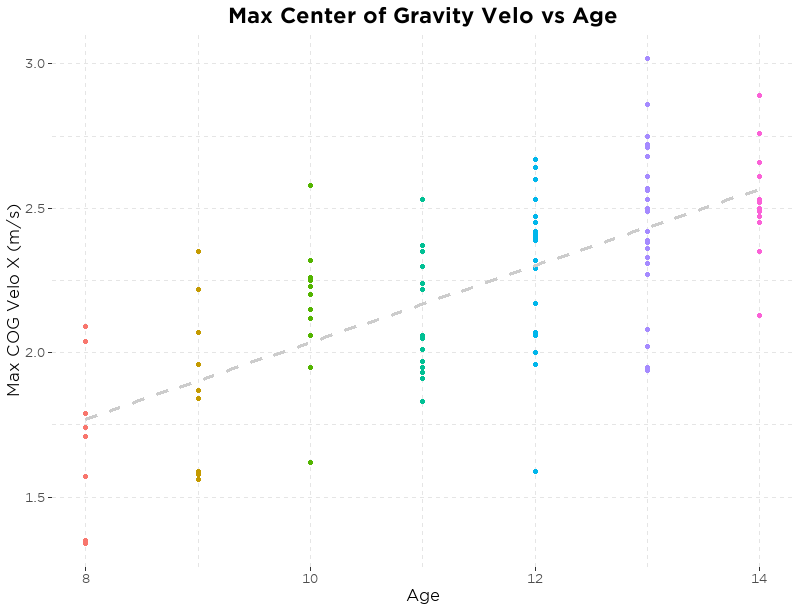
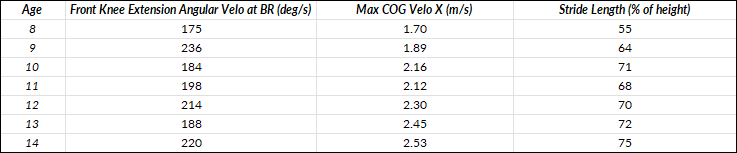
First, let’s take a look at the lower half. We consider three metrics: front knee extension angular velo at ball release (a measure of the lead leg block); center of gravity (COG) velocity (how quickly the athlete moves their body towards the plate); and stride length.
Front knee extension angular velo at BR is pretty consistent on average across age groups. We do see older athletes move their COG more quickly (which may be confounded by height, since a taller athlete will move faster if they move the same distance relative to their height in the same amount of time as a shorter athlete).
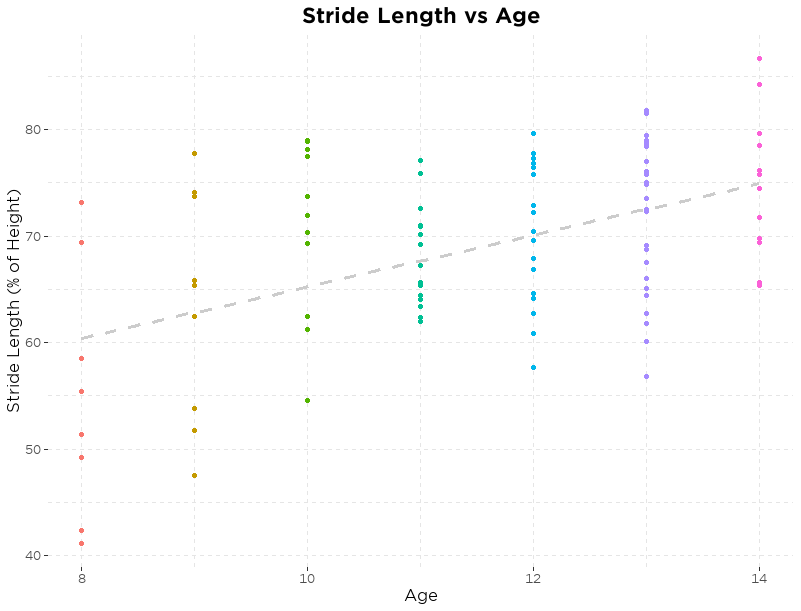
Stride length (when taken as a percentage of the athlete’s height) allows us to look at this same move while controlling for the athlete’s height. When we do this, we do see older athletes still stride longer, though the effect is a little bit smaller than for COG velo.
Arm Action
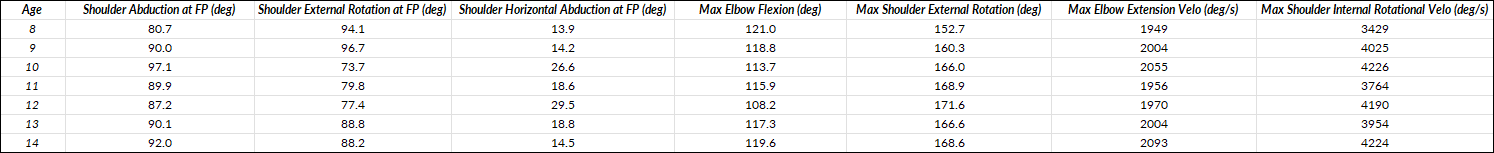
Transitioning to arm action, we typically consider a couple positions at foot-plant: shoulder abduction (if an athlete has a low elbow or is hiking it above the shoulders); shoulder external rotation (how flipped up the forearm is); and shoulder horizontal abduction (scap retraction). In addition, we’ll look at how much external rotation (layback) they get and the max elbow flexion (how much bend they get in their elbow) throughout the delivery.
The last main arm action metric we often reference is elbow extension velo and shoulder internal rotation velo (which measure how quickly the arm is moving in those two movements as they occur during the throw).
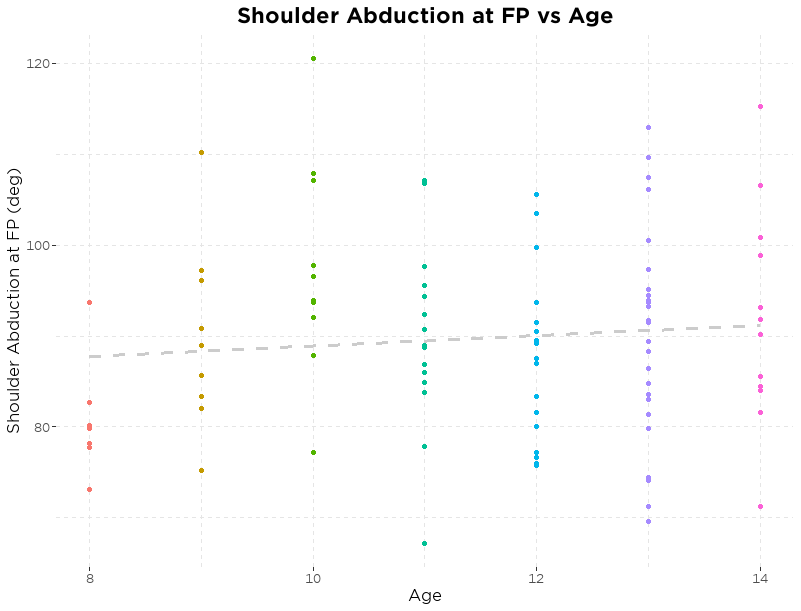
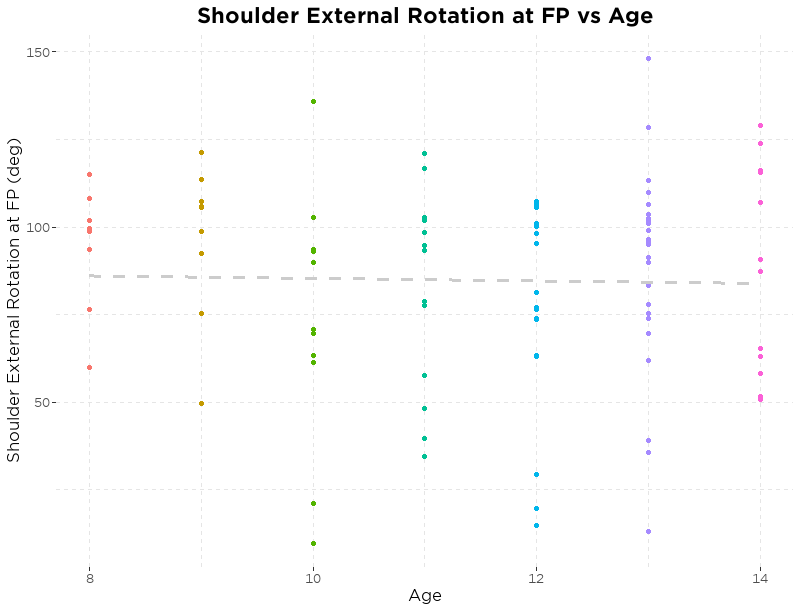
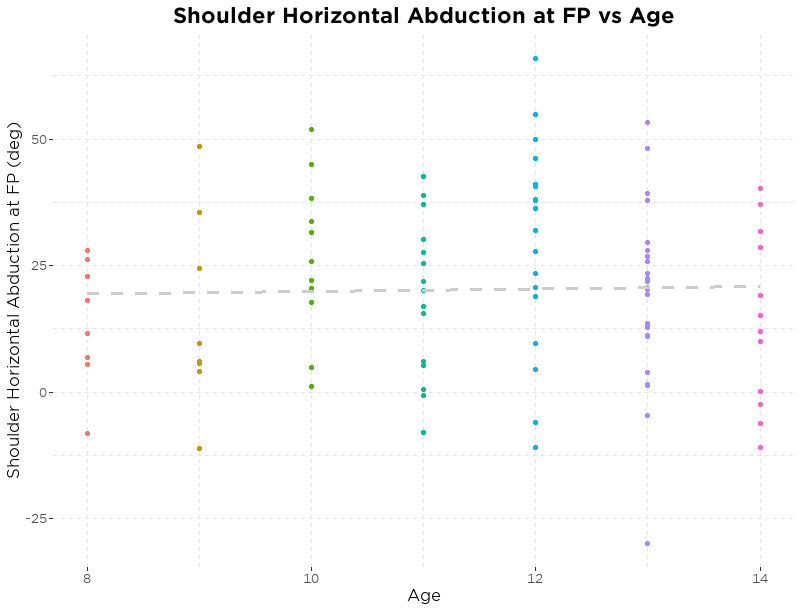
For those landing positions, we don’t see a clear trend for progression as athletes age—and any potential trend is very small relative to the variability we see within each age group in regards to their arm position at foot plant.
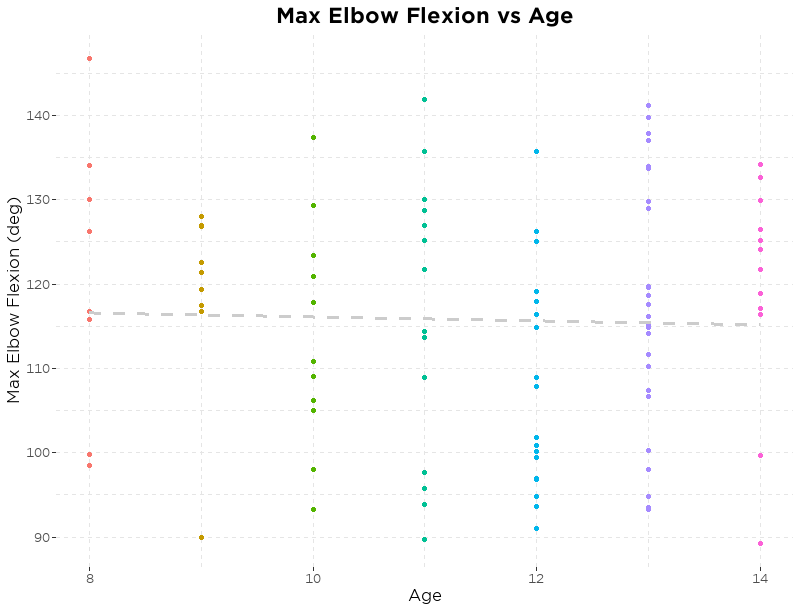
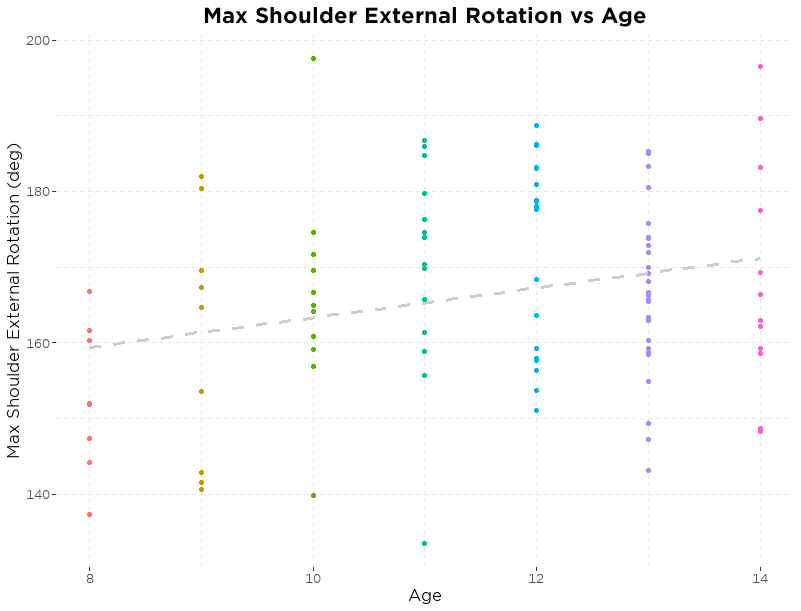
We see average max elbow flexion hold pretty steady across the different teams, but do see some degree of an upward trend for shoulder external rotation (with each year of age, avg MER increases by ~ 2 degrees), though there is a lot of variability between athletes around that trend line.
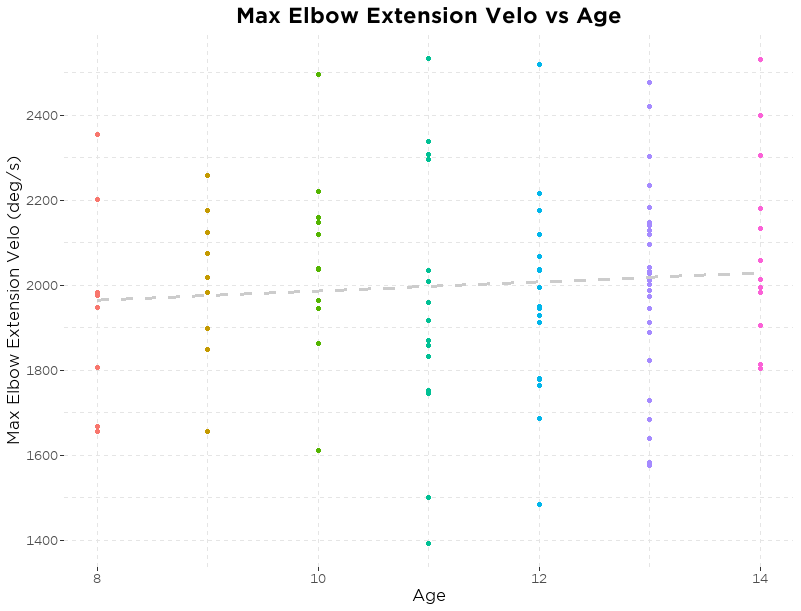
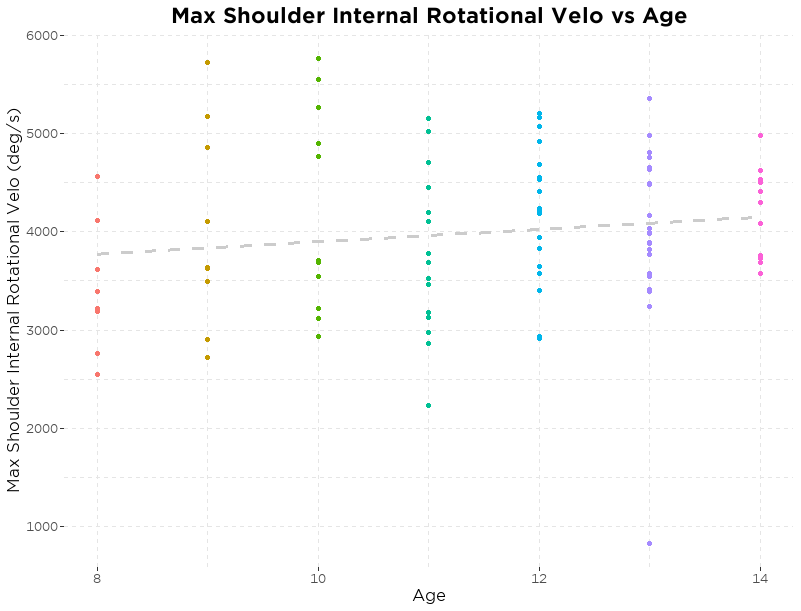
We see a slight increase in average elbow extension velo and shoulder internal rotation velo as athletes get older. This increase may not be as large as we’d expect, but the older athletes are bigger, so even the same velocities would correspond to more momentum and energy.
Posture/Core
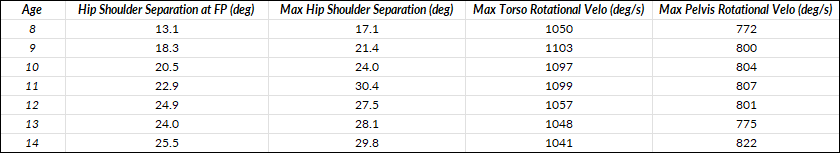
Lastly, we take a look at hip to shoulder separation (at foot-plant and the max value) and torso/pelvis rotational velos.
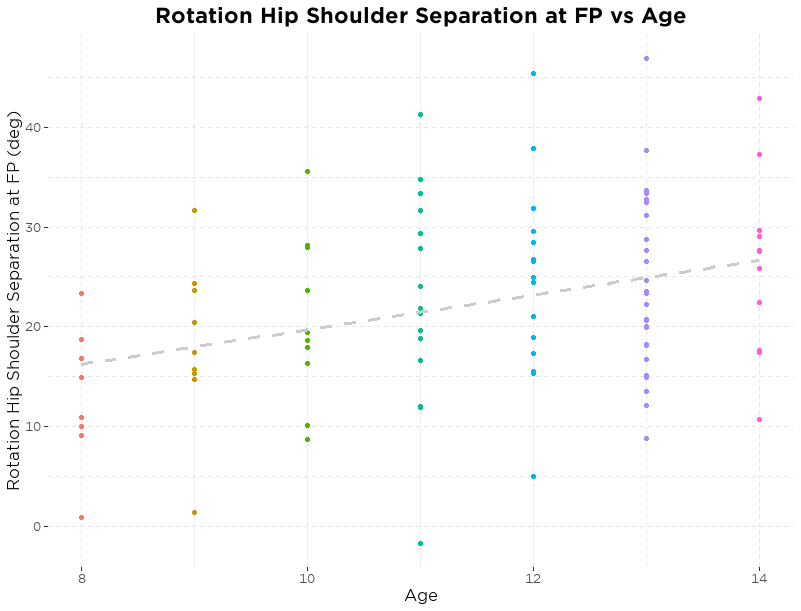
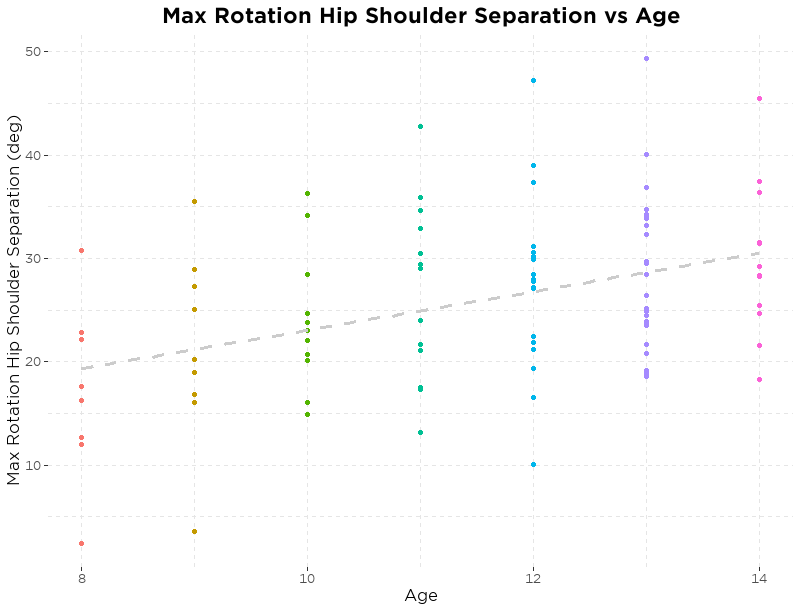
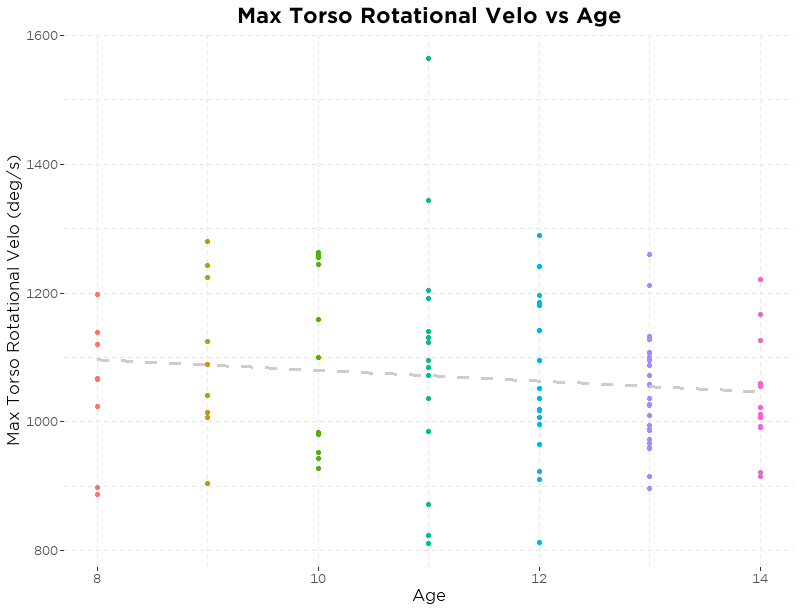
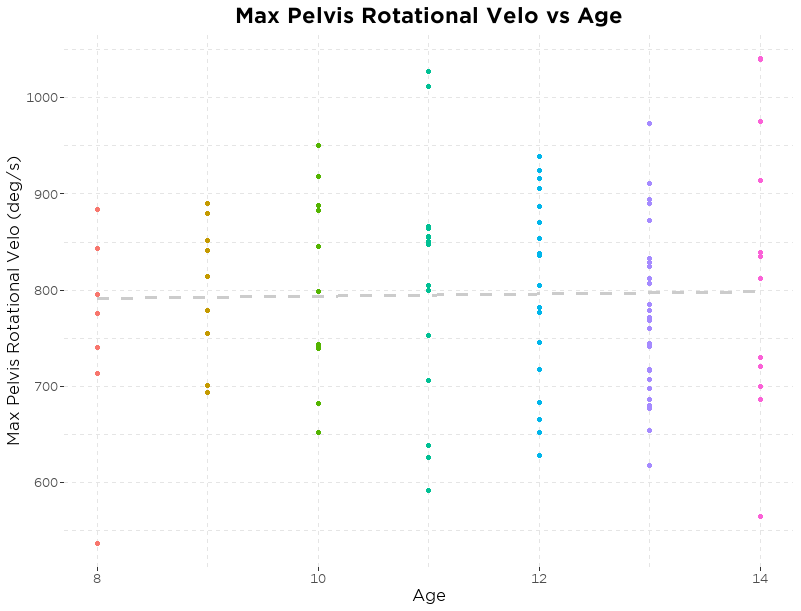
Here we see that older athletes tend to have more hip to shoulder separation (both at its max value and at foot-plant, which we consider to see how effectively they’re able to time up their max hip to shoulder separation). Looking at the torso and pelvis rotation velos, we see them hold steady across the age groups or drop off slightly (which may just be a product of how much more energy is generated from the athlete being heavier relative to a slight drop off in rotational velocity).
Conclusion
In total, we see that some metrics tend to increase slightly among our older athletes, such as their ability to coordinate their body to shift their weight down the mound, get hip to shoulder separation, and get into more shoulder external rotation.
For HSS and external rotation, these trends may result, in part, from the physical development of athletes, which allows them to get into and hold some of the deeper positions that we see our higher level (college and pro) athletes use. This highlights an important point: athletes’ mechanics may reflect technical or physical limitations. Especially with youth athletes but with our older athletes as well, external cueing and self-organization allow for athletes to work within the constraints of their unique physical characteristics to optimally achieve the goal of throwing the ball hard, efficiently and effectively.
While we can identify potential areas for movement improvement based on trends we see across a large body of throwers, different athletes will have different idiosyncrasies that will drive how they move optimally, as evidenced by a lot of variability in movement strategies deployed successfully by the hard throwers in our database, including MLB arms and throws up to 100 mph.
When it comes to youth athletes, we’re sensitive to emphasizing external goals that allow them to use what athleticism they have as they’re still developing coordination. We don’t want to rob them of that by attempting (likely futilely) to dictate a specific set of correct mechanics that they may not be physically equipped to do well at that point in time.
With many of the other metrics (lead knee extension velo, arm positions at foot-plant, torso and pelvis rotational velos), we don’t see a large difference between the different age groups. That said, it is true that the handful of metrics considered in this analysis don’t fully encapsulate everything that’s going on mechanically, so there are elements of coordination and how athletes get into and out of positions that aren’t considered here. Nonetheless, these consistencies in mechanics suggest the importance of prioritizing getting larger, stronger, and more powerful as a route to increasing output, as that’s a notable difference between the older athletes who throw harder and the younger athletes in this sample.
There’s still a lot to explore across our youth motion capture data, such as questions like: Do athletes who throw harder for their age display similar trends as we see when comparing harder throwers in our college/pro population? Do we see decreased variability in mechanics on a throw-to-throw basis for older athletes compared to younger athletes? How does our strength assessment data (from jump testing) relate to these mocap data, and do these relationships mirror what we see with our HS/college/pro athletes?
We hope to touch on these in future pieces as we dig deeper into these data.
Comment section