Optimizing Breaking Ball Shape Through Data-Driven Pitch Design, Part II
By Sam Bornstein, Baseball Ops Analyst
In part one of this breaking ball pitch design series, we introduced a method to calculate expected velocity differentials in breaking balls compared to an athlete’s fastball.
We took a generalized approach to assess an athlete’s breaking ball and fastball characteristics to end up with an expected velocity differential for cutters, sliders, and curveballs. This allows us to say, for example, how much velocity we’d expect a certain athlete’s slider to drop relative to his average fastball speed in that time period.
The use case for this model is fairly straightforward: If an athlete is throwing a pitch slower than what our model expects, we can predict that this athlete may have low feel for a breaking ball and still have room to improve the pitch, overall.
If we recommend that the athlete increase the pitch’s speed to match the expected velocity, we would like to know if that potential improvement comes with additional considerations or tradeoffs worth quantifying.
In this piece, we introduce the velocity-spin efficiency tradeoff and explain how we can utilize that relationship to foresee potential changes in pitch shapes if velocity is increased.
Spin Efficiency Basics
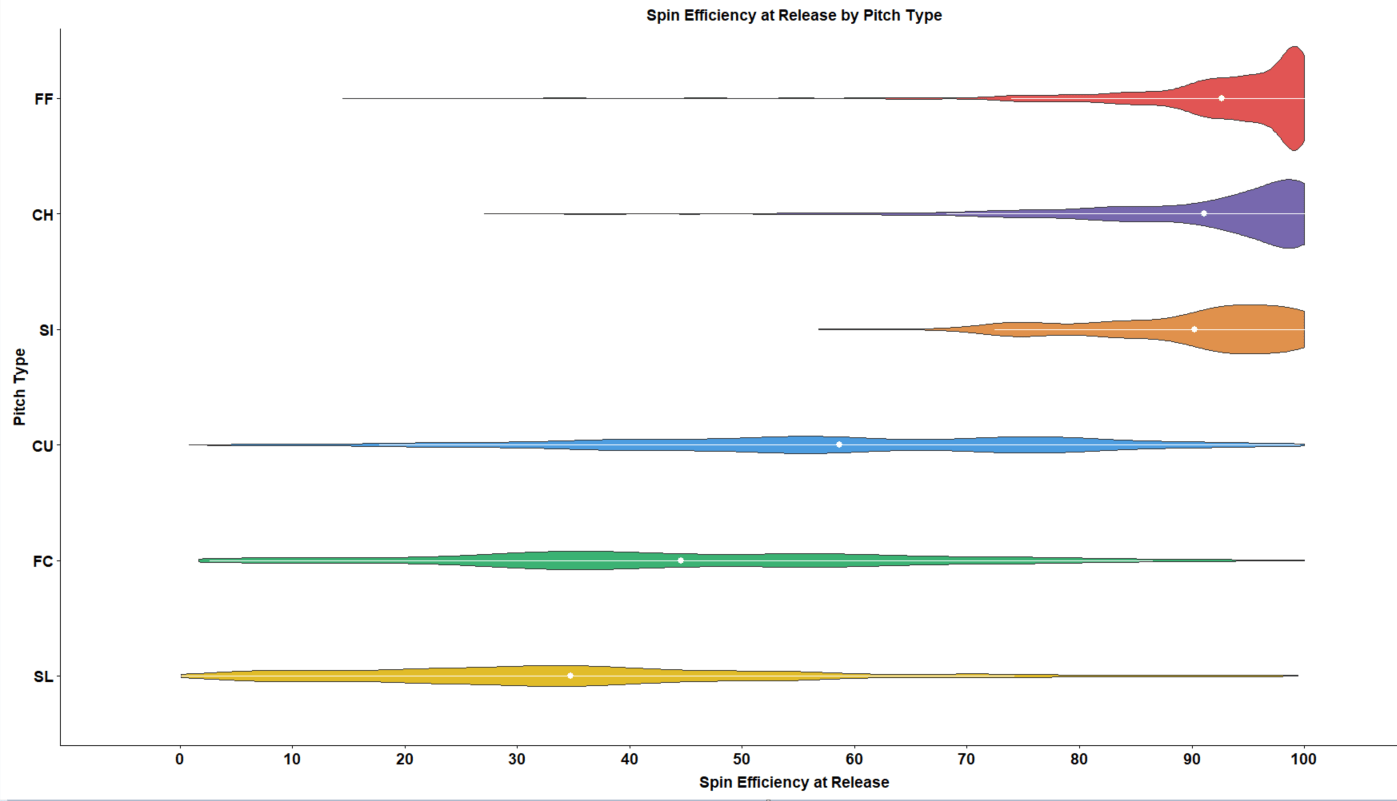
Prior to diving into the tradeoff, let’s first cover the basics of spin efficiency. Spin efficiency is defined as the percentage of spin directly impacting the movement of a pitch. A pitch with 100% efficiency has a spin axis that is perpendicular to home plate, or in other words, has pure transverse spin.
At this efficiency, spin directly influences the movement of the pitch. On the flip side, a pitch with 0% efficiency has a spin axis that is aligned with home plate, otherwise known as gyro spin. Gyro spin does not, for the purposes of this blog, influence a pitch’s movement.
Of course, values between 0% and 100% can be observed, where different combinations of different types of spin impact the pitch.
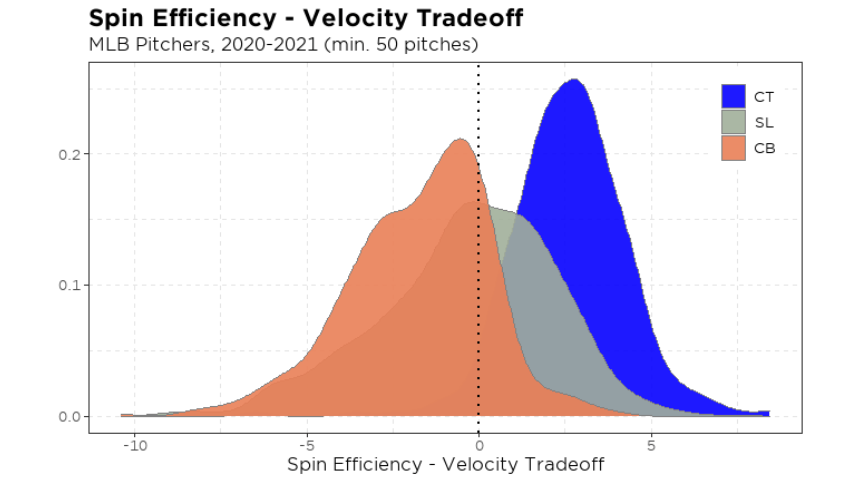
Spin efficiency is a valuable piece of the puzzle when designing a breaking ball. As we see in the plot above, gloveside pitches have the widest range of spin efficiency values, so finding the optimal range can be quite challenging.
As we noted in the first blog of this series, we are also trying to maximize breaking ball velocity, so we are once again attempting to balance the nuanced tradeoffs between all the components of improving a breaking ball.
Velocity-Spin Efficiency Tradeoff
Previously, we built a complex model to measure a pitch’s expected velocity differential from its fastball, but assessing the spin efficiency component—in relation to velocity—does not need to be as sophisticated, particularly given that the relationship between the two is often unique from athlete to athlete.
For example, we’ve plotted Corbin Burnes’ spin efficiency-velocity tradeoffs for his breaking ball pitches below.
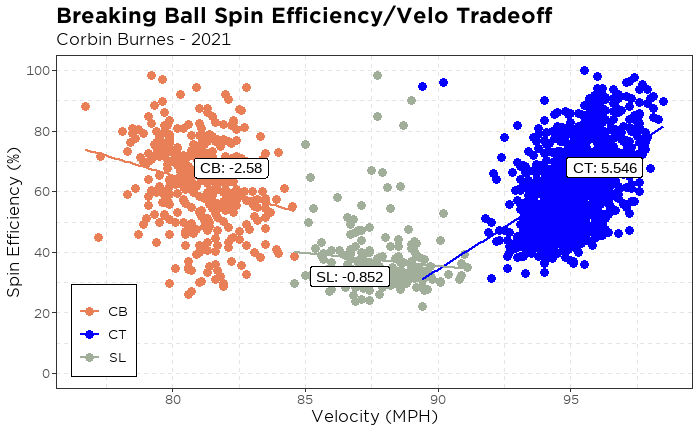
These three pitches have three unique, linear tradeoffs. For example, as his curveball increases one mile per hour, the spin efficiency is expected to decrease approximately 2.5%. The slider also loses efficiency as velocity increases, but not nearly as much. On the other hand, Burnes’ cutter has a steep linear relationship, increasing 5.5% in spin efficiency for every 1 MPH added.
Intuitively, this makes sense. As the cutter increases in efficiency, it gains more back spin, which is the dominant force in four-seam fastballs. So, the faster the pitch is thrown, the closer it creeps towards resembling the fastball in appearance.
League-Wide Trends
To go beyond just a one player example, we collected data from pitchers over the past two seasons and plotted the density of their per-pitch tradeoff values.
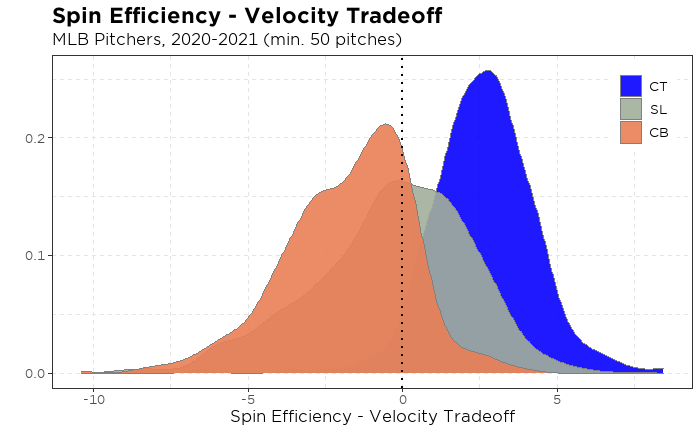
Nearly all pitchers in this sample with a cutter–240 total–see an increase in spin efficiency as velocity rises, which is exactly what we saw for Burnes.
As we move down the breaking ball velocity spectrum, the density of the bell curve moves to the left. Sliders hold a near split, which creates a conflicting result in the spin efficiency-velocity relationship. This could be due to the many shapes and sizes of the pitch, especially in a sample of 734 pitchers, but it further stresses the importance of assessing the tradeoff in each individual pitcher to see what they are capable of.
Lastly, curveballs almost always lose efficiency as velocity climbs. It seems that in order to gain velocity, some component other than transverse spin, such as gyro spin, must be imparted on the baseball.
Understanding the per-pitcher spin efficiency-velocity tradeoffs in the breaking ball arsenal gives you clues to optimizing breaking ball shape. Each pitcher wants to maximize the velocity on his pitches, but when we are optimizing components such as horizontal movement, we must tie these various tradeoffs together to script a detailed plan.
Returning to the Velo-Movement Tradeoff
Let’s consider an example. Imagine a pitcher who throws his slider with optimal movement, but at less than expected velocity. We want to know if he is able to keep optimal sweep with an increase in velocity.
To peek behind the curtains, the spin efficiency-velocity tradeoff foreshadows what to expect if you add speed. If the athlete gains or loses spin efficiency with a change in velocity, it tells you that he might lose the optimal shape.
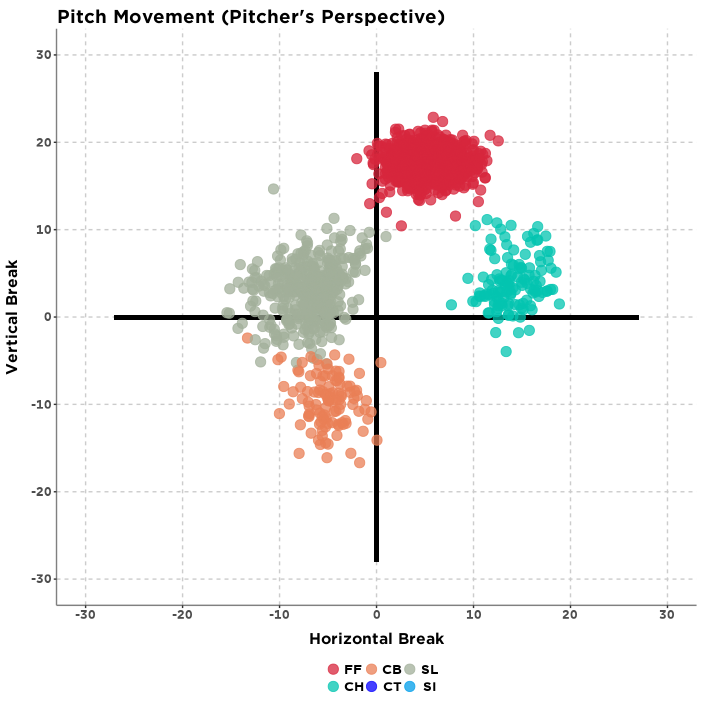
In part one of this series, we identified Logan Gilbert as a pitcher who could benefit from an increase in velocity on both his slider and curveball. These pitches aren’t far apart in shape, as you can see below, but they vary in speed—his slider averaged 83.4 MPH and his curveball 74.8 MPH this season.
With an average four-seam fastball velocity of 95.2 MPH, both pitches show a significant loss of velocity. As we wish to minimize the velocity gap, we can anticipate what may happen to pitch shape by observing the per-pitch tradeoff between velocity and spin efficiency.
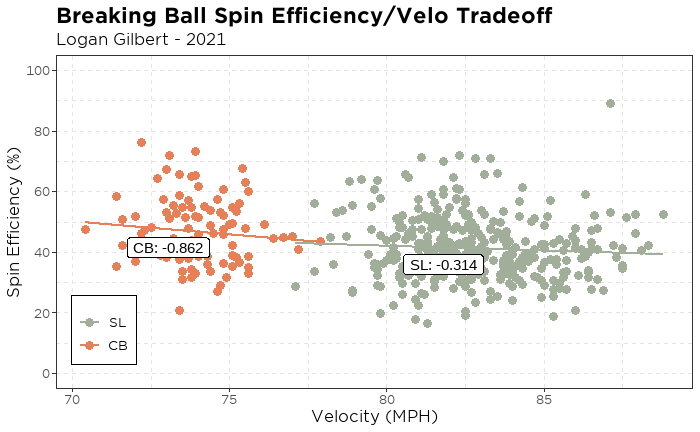
Fortunately for Gilbert, historically, he has not lost much efficiency as his two breaking balls have increased speed. Without a significant drop off in efficiency, we would not expect the slider or curveball to lose its current shape if thrown harder.
Intentional Pitch Manipulation
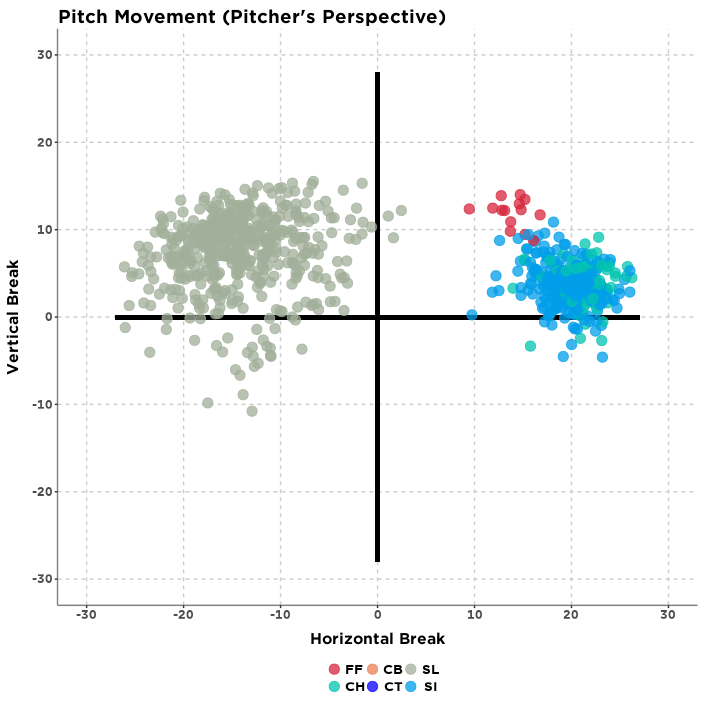
In a recent Driveline article, we learned that Sergio Romo manipulates the shape of his slider depending on the count situation. As you can see below, this pitch can take the form of a sweeper, backspinner, or even one with a hint of depth.
While we see him wearing a different uniform almost every season, the one thing that’s stayed consistent is the success of Romo’s slider. In 2021, this pitch held a 1.16 xERA and 161 Stuff+. Romo’s slider is a great example of a pitch with an extreme tradeoff between velocity and spin efficiency.
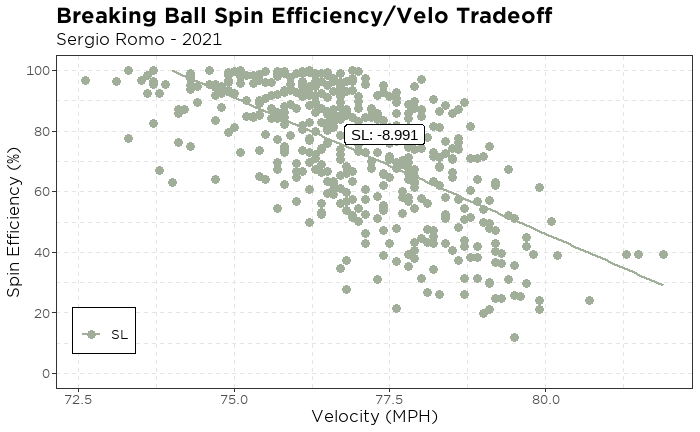
Romo turns to his sweeping slider in counts where he has the advantage over the hitter. This pitch shape has higher spin efficiency, close to 100%, but is thrown in the low to mid 70s. When Romo turns to the back-spinning, shorter slider, it drops significantly in efficiency while getting up to 80 MPH in velocity. Nonetheless, Romo’s versatile slider remains a weapon in his arsenal, no matter the shape or velocity.
Wrapping it Up
As we optimize all the components of a breaking ball, it sometimes becomes a cat-and-mouse game of chasing after various metric thresholds, but that’s the nature of designing or improving a pitch. The information we’ve created unlocks different doors in this process, laying out paths with a guide along the way.
We will never be able to avoid the trial-and-error phase of pitch design, but we can use what we’ve learned to limit the number of trials necessary to succeed.
Comment section