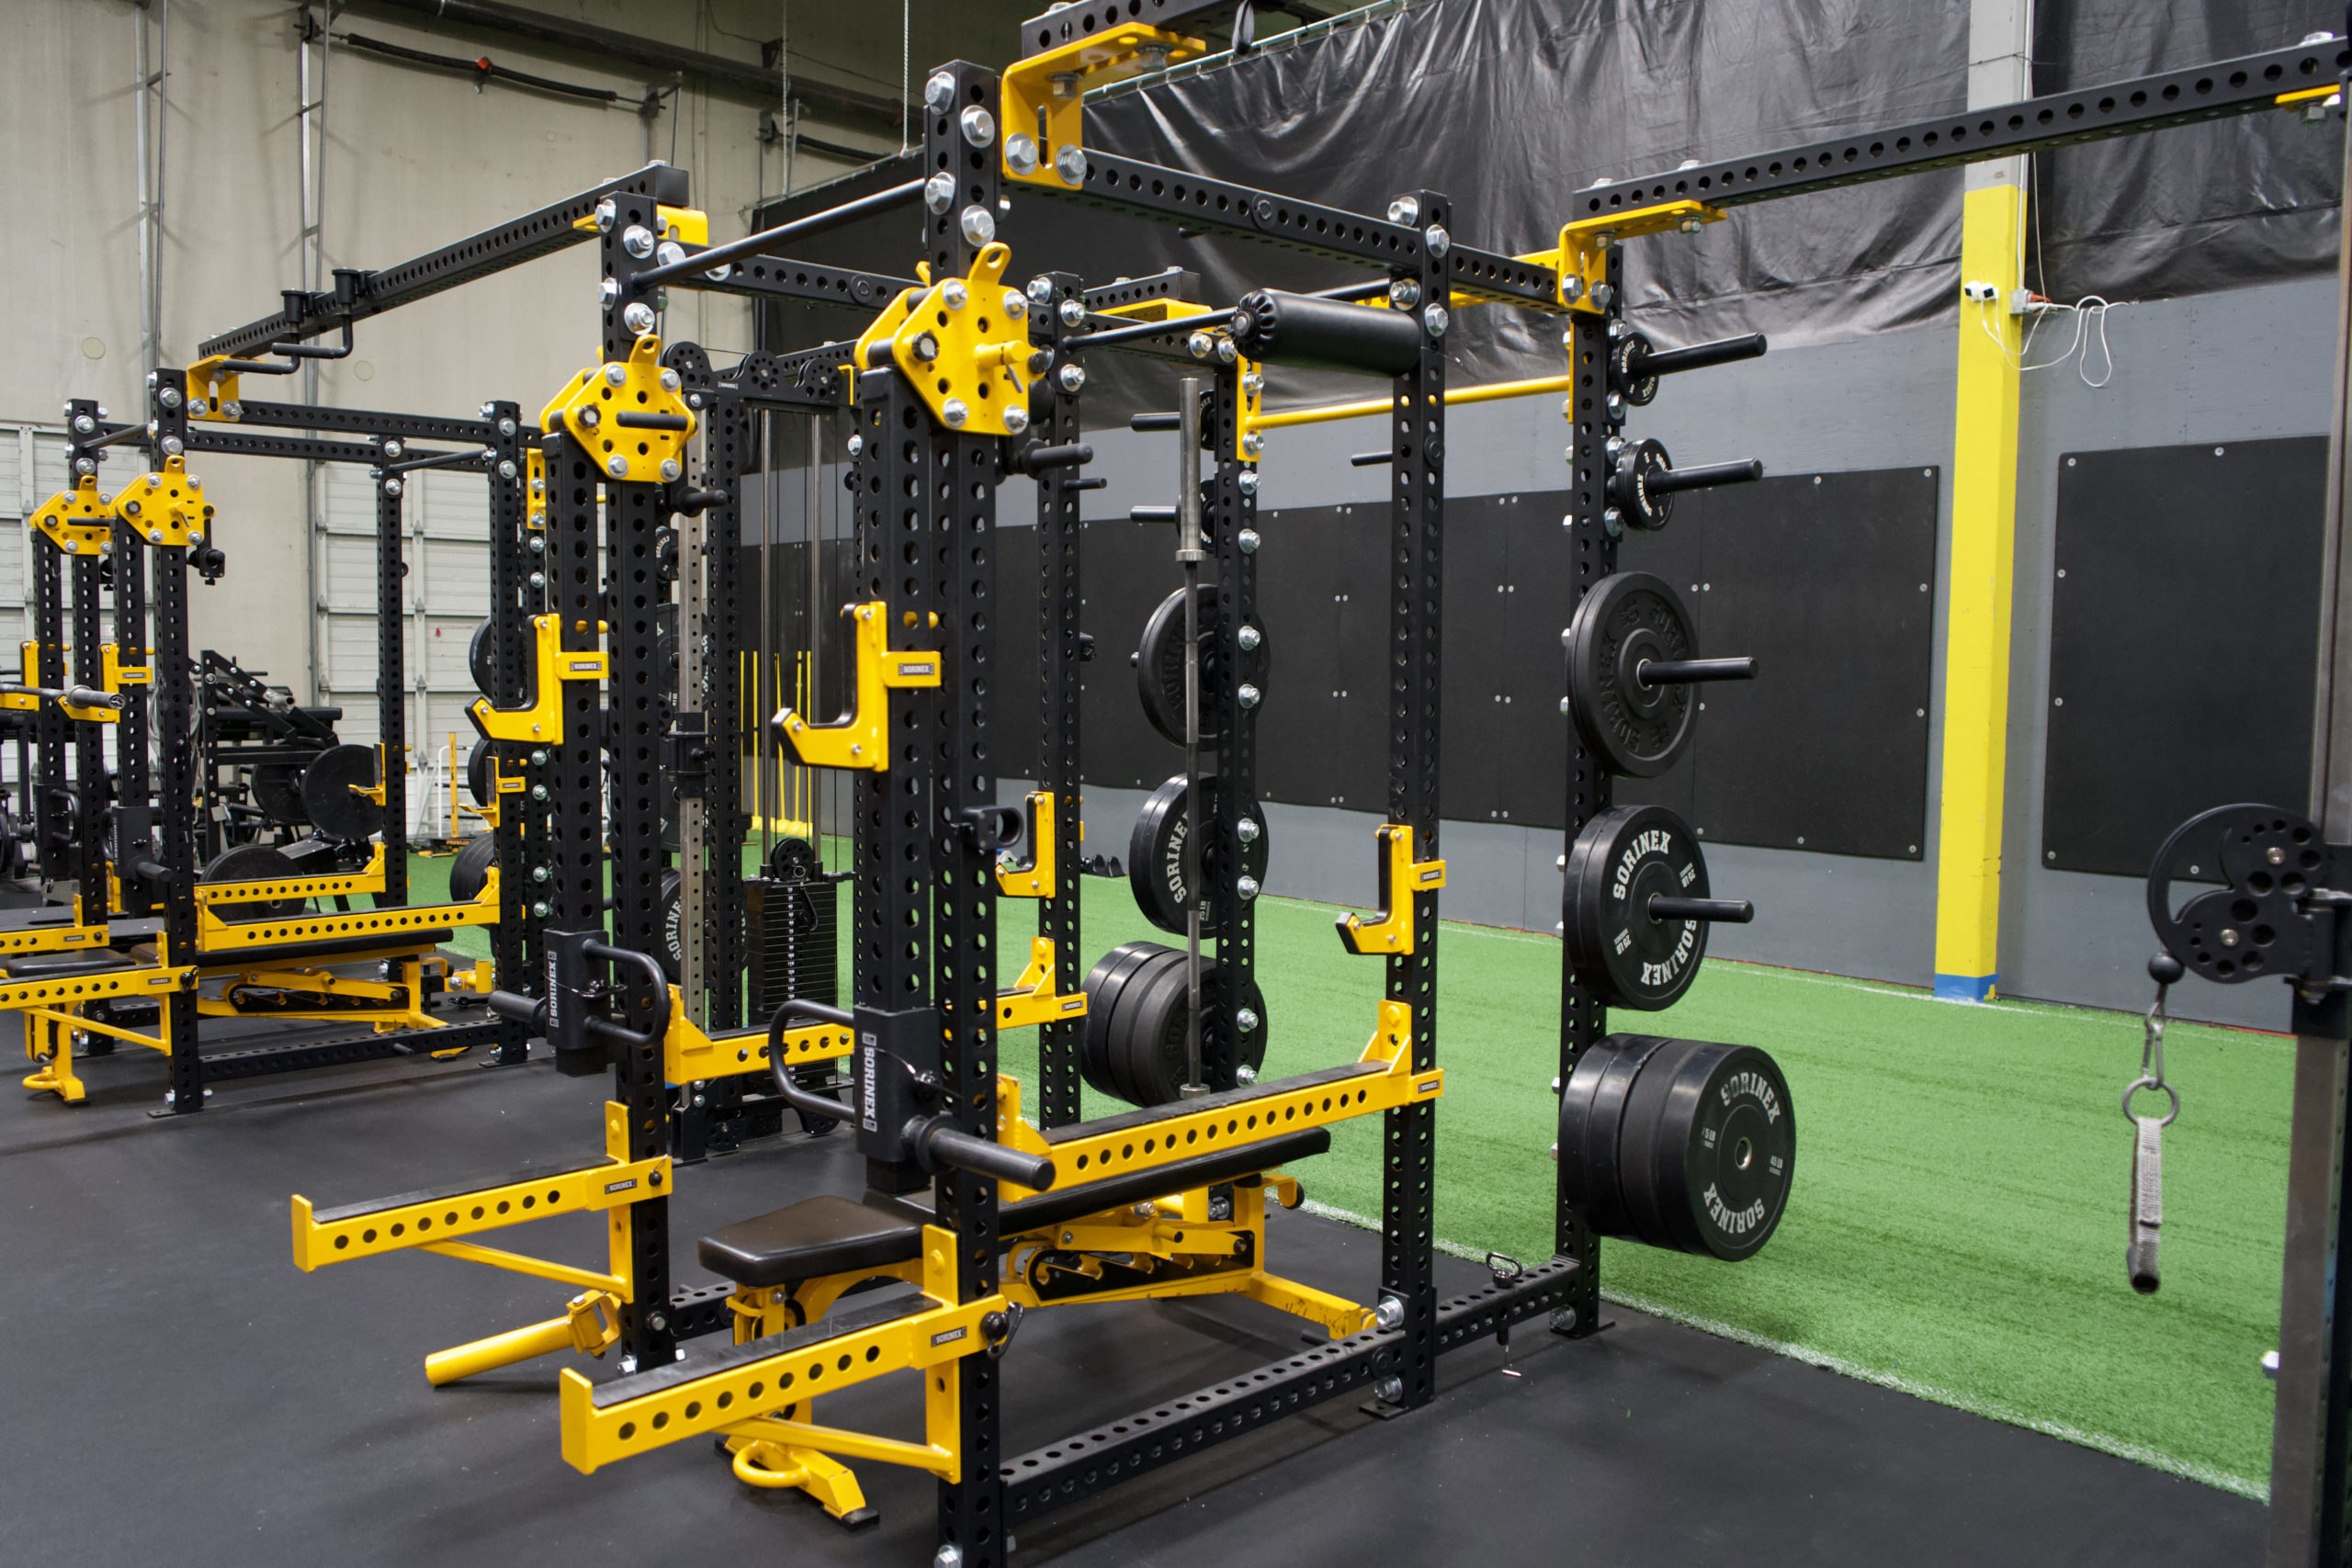
High Performance: 2021 College Summer Recap

By Brice Crider, High Performance
This summer, the High Performance Staff ran 617 strength assessments with 182 of those being with athletes that trained for at least 6 weeks and retested within 2 weeks of completing a program. The average overall score went from a 53 to a 60, a 13.2% gain, over the course of a 6 week training block.
High Performance Gains by Phase
When viewing high performance gains grouped by lifting phase, it is important to keep in mind that the programs within these phases are largely concurrent—which means that all general qualities (hypertrophy, strength, power, speed, reactive strength) are being trained to some extent throughout each program. The name of the phase merely indicates which quality is the focus. An easy metaphor to understand this is a series of dimmer switches. As the focus changes from phase to phase, the ratios of training stimuli change as well. For an athlete who is able to train for a full summer (18 weeks, 3 phases), the typical progression is accumulation, strength, then power.
Accumulation
Accumulation phases (focused on hypertrophy and building work capacity) are where we saw our largest average gains in our six key metrics. This is largely due to the fact that a summer athlete who is put into an accumulation phase is typically physically underdeveloped and will reap the largest benefit from increasing muscle mass and general work capacity, as they are further away from their genetic ceiling. During an accumulation phase, athletes are usually in an on-ramp throwing phase. This is important to note because it allows us to allocate more of their training economy into the weight room, which we would expect to yield larger gains in our high performance retest metrics.
Strength
The majority of athletes in college summer go directly into strength phases, as not every athlete can spend the full 18 weeks at Driveline for the full progression. Typically, athletes that arrive prepared for a velocity throwing phase will not go into an accumulation phase in the weight room, as we generally do not pair the high volumes of accumulation with the high acute stressors of a velocity phase.
Strength phases tend to be lower in overall volume, allowing athletes to push intensity in order to make gains in absolute strength, measured by the Isometric Mid Thigh Pull.
Power
Power phases have the least amount of participants during college summer, due to the fact that many athletes are only in the gym long enough for one phase and typically go into a strength phase. The athletes that do go straight into a power phase generally have a larger training history and are more adapted than their counterparts.
These athletes usually have already built a solid foundation of size and strength, and now need to make more specific power gains. Because they are already so adapted and closer to their genetic ceiling, making further gains becomes more and more difficult. Another important consideration is that during power phases, athletes are typically in velocity or pre-competition phases on the throwing side, so there is less training economy for weight room gains. Power is tested in the Squat Jump and Countermovement Jump.
Changes in Predicted and Actual Velocity
One of the best ways to contextualize improvements in general physical qualities is using our Predicted Velocity Calculator. This tool not only allows for communication with the athlete on how these gains can affect velocity but can also provide context to why an athlete may (or may not) have made a velocity jump during the course of a block.
The average athlete at Driveline this summer gained 1.40 mph in predicted velocity per 6-week strength phase, while in reality, they gained 2.10 mph of actual velocity from mocap test to retest. Although it is impossible to say for sure, a likely explanation for the difference between predicted and actual velocity in such a large data set is that movement changes and skill acquisition on the throwing side positively affected the athlete’s velocity as well.
Unsurprisingly, the phase patterns of predicted and actual velo are opposite. Athletes made the largest predicted velocity gains in accumulation phases (when weight room volume is the highest and throwing intensity is usually low) and made the largest actual velocity gains in power phases (when weight room volume is low, and athletes are usually in a velocity phase).
Comment section