Driveline Hitting KPI’s

At Driveline, we want to make sure we’re tracking what matters. There’s a plethora of technologies available that can pull up bat speed characteristics, batted ball outcomes, swing kinematics, all of the above, and none of the above. There’s a certain decision paralysis that results from this scenario where the endless options and combinations result in an infinite matrix of KPI’s.
From the hitting coach perspective, it can be difficult and time consuming to navigate Fangraphs, Baseball Prospectus and other sabermetric sites in order to take away a few nuggets to bring back to your hitters. The goal of this blog is to provide some actionable insight on what to track and how to train your hitters to achieve the desired results come game time. We’ll focus on the data collection system and how we selected metrics to collect data on, in addition to examining the information from the lens of the coach and applying these findings to hitting department KPI’s.
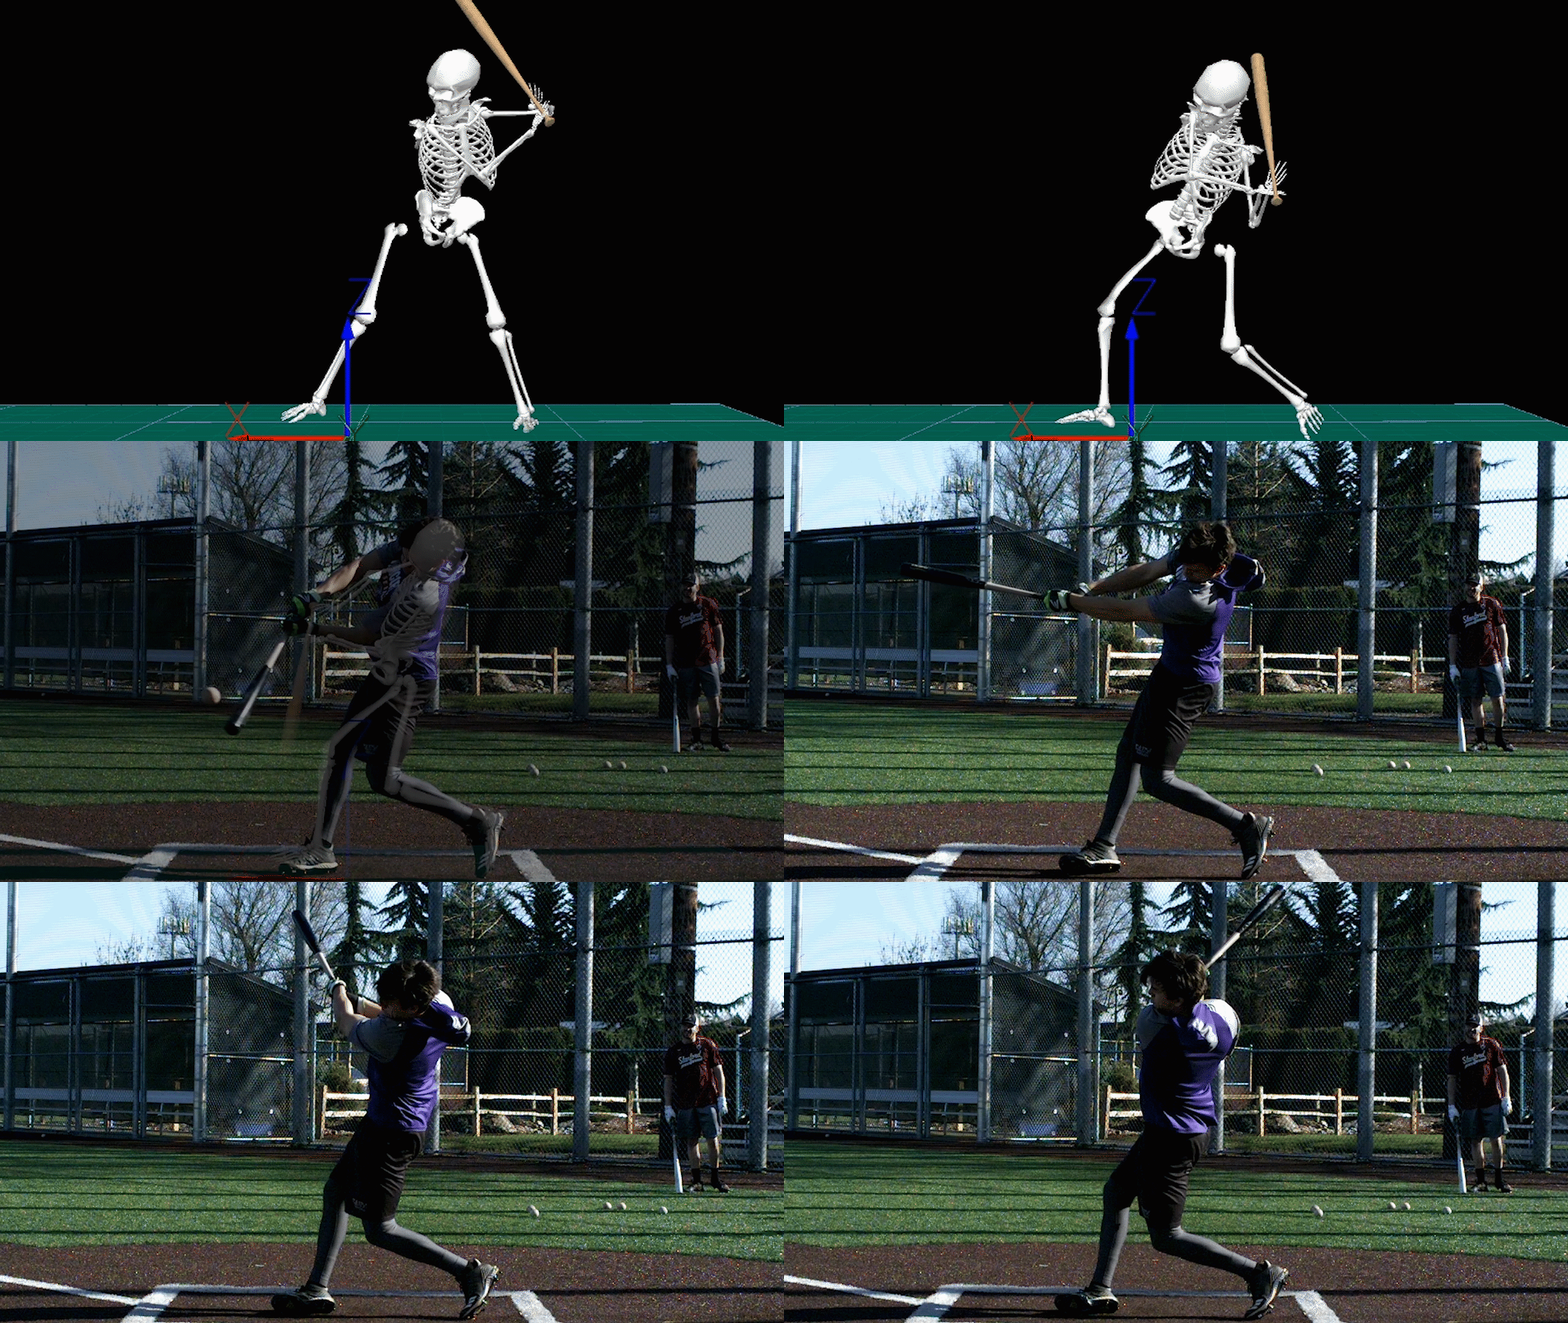
Foundations of Hitting
30 modules teaching you everything we know about hitting and hitting mechanics.
Data Collection In Practice [Applied Coach Perspective]
Our data collection system involves our daily hitting groups (four hitters every hour) wearing Blast sensors and hitting on their respective profiles on HitTrax. The first challenge is remembering to keep our data collection process sound and consistent while making sure that players are using the right sensors on the right Blast profiles. The second challenge is accessing and processing the data we collect.
If you are a college or high school coach with access to Blast sensors and launch monitors (as well as nerds to process the data for you), you will be able to craft a similar system to ours. This requires that hitters are hitting with Blast sensors while their batted ball outcomes and metrics are recorded via Hittrax, Rapsodo or a similar tech. If you are a college team that practices daily, you can imagine how many paired swings you could amass over a season of fall ball. This can do a few things for you even in a short amount of time collecting data.
- You will have a better idea of what your best hitters do in terms of relevant batted ball or swing metrics.
- You will gather information on hitters who show “red flags” in these areas, allowing you to alter their training to meet the expectations of “good players” in your system.
- You could develop a test/retest system based on your findings. This system could be consistently updated the more you understand the metrics measured by launch monitors and bat sensors.
Again, creating a system like this requires some computational skills and the adequate organizational capabilities and resources to keep track of a large amount of Blast and HitTrax data.

Become the Hitter You Want To Be
Train at Driveline
Deciding What to Focus On [Applied Analyst Perspective]
As alluded to above, the number of available metrics as well as the number of statistical tools with which to interpret them can be very daunting.
For example, let’s take two (now) near ubiquitous stats: exit velocity and launch angle. How are we to decide whether to track mean EV versus, say, median EV or max EV? We could further introduce the mean of a variable above a certain threshold as another folded-in derivation—and that threshold itself could be contingent on another variable!
How about keeping track of the average EV between launch angles 10 and 26? How about the average EV between launch angles 20 and 26 and 10 and 15 separately? What about the average launch angle of balls hit with an EV above 95+? What about proportion counts: the proportion of balls hit above 95+ that fall into the LA buckets of 10 and 26? Or 10 and 15 and separately 20 and 26?
Without wasting your patience with more rhetorical questions, I hope my point stands as to the ease with which this can get out of hand. The above examples only depend on EV and LA (it bears repeating), whereas the accumulation of hitting technologies now spits out a much larger share of metrics.
So, let’s start with a few basic ideas before we delve too much deeper. Let’s look at a few of the more popular metrics, and a few general ‘Step One’ ways of interpreting them. This will help us see what ultimately ‘plays’ at the level we’re all aspiring to understand better: MLB players.
The specific metrics we are going to examine in Part I of this series are:
1) Exit Velocity (in a few different formats: mean, median, and top 8th average)
2) Bat Speed (mean)
3) Attack Angle/Launch Angle (mean, lumped together for reasons that will become clearer later on)
We’re going to apply these to cleaned Statcast data in an attempt to not only further our understanding of their importance, but also to clarify our expectations.
Before we go much further, there are a few cursory disclaimers to cover any time we talk about playing with MLB Statcast data. As covered in previous sabermetric pieces and on many Driveline PLUS videos, there are a few things to correct for when looking at publicly available Statcast data:
- Stringer values, covered here by Gerald Schiffman, and looked at here in a tweet by yours truly in the latest iteration of Statcast data
- Homestand bias in launch speed, launch angle and spray angle, corrected using a linear mixed model, similar to the methodology touched on here
Here are a few more notes on the derivation of these metrics relevant to MLB figures.
Exit Velocity
Exit velocity should be intuitive as this number is generated by each ball in play (BIP). After the above corrections, means and medians can be straightforwardly calculated for each player. The top 8th EV average refers here (and in other places where ‘the Top 8th’ is referenced) to the average of each individual’s top 8 hardest hit balls.
Bat Speed (Warning: A little technical)
Bat Speed is a little bit more interesting. There has been work done in the past on reverse engineering bat speed from exit velocity. But at Driveline, we have a little bit more data to use, as our concerted data collection efforts on the hitting floor have allowed us to pair tens of thousands of rows of Blast and HitTrax data by their timestamps and users, allowing us now to put a concrete bat speed figure with batted ball data. Regressing completely off this we have found a simple linear regression explaining around 80% of the variation (or .8 R^2) of bat speed. However, this is an equation 100% dependent on exit velocity, which we know is not the *only* thing that goes into bat speed.
In fact, based on Alan Nathan’s work (and re-formatted in many different spots), we know bat speed depends on three things: a) exit velocity; b) the efficiency collision (EA); and c) the incoming velocity of the ball. The equation stands as BatSpeed = (EV – EA*PVelo)/(1+EA)
The above piece on reverse engineering bat speed also dealt with deriving a bat speed figure from these variables, by assuming .2 for the top 15 hardest hit balls and -.1 for the top 15 softest hit balls and attempting to build a linear slope out of this, which gives each hitter an EA regression. We attempted to address a few of the assumptions in this method: the linear assumption of EA and EV; the idea that bat speed would be consistent across all situations; and the idea that there is just as much randomness in the top 15 weakly hit balls as there are in the top 15 hardest hit balls—and everywhere in between.
So, using our paired HitTrax & Blast data in an attempt to produce a more cohesive, statistically salient public estimate of bat speed, we did the following:
- Calculate an EA out per swing, given that we had EV, pVelo, and Bat Speed figures.
- Calculate averages by each player’s eighth chunk of data (ordered in descending order of EV) from the first eight to the last eight for bat speed, EA, EV, and pVelo.
- Recreated the average bat speed using the following formula: (1/8)*[(topEighthEV – topEighthEA*topEighthPVelo)/(1+ topEighthEA)] + (1/8)*[(2ndEighthEV – 2ndEighthEA*2ndEighthPVelo)/(1+ 2ndEighthEA)] + …+ (1/8)*[(lastEighthEV – lastEighthEA*lastEighthPVelo)/(1+ lastEighthEA)] with all eight components weighted equally.
- Confirmed that this equation matched the player’s actual recorded average bat speed; this had a .999136 correlation coefficient and an RMSE of 0.2—great!
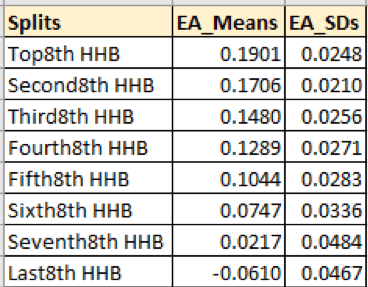
- Since we won’t be able to plug in EA values per swing on our MLB data (given that we don’t have the matching Bat Speed figures), we decided to get averages for each eighth EA of all 70+ hitters who had enough swings to qualify (50+, as reliability figures have shown, are enough for EV stabilization). These included a random split of wood and metal bats; in addition, the standard deviations of each player’s EA values by eighth were relatively low as shown below, which was heartening for the validity of using these figures across a large and variant population.
- Reran error analysis again, now with each hitter having a hard-coded value for their eight EA figures, rather than their own individual ones; correlation figure dropped to .855; RMSE of ~2.5. A bit of a drop-off but still quite robust, and now we are not massively overfitting on just their average EV.
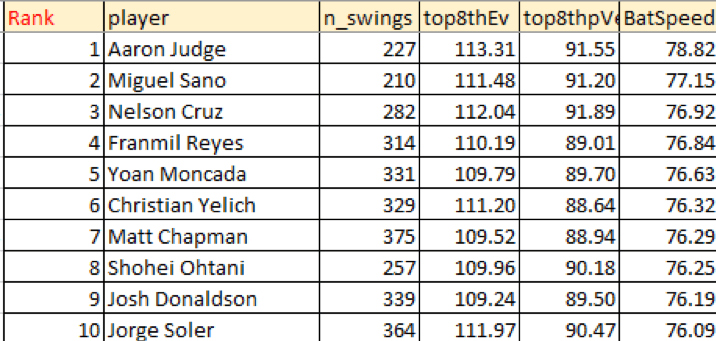
- Now we recreated these bat speed figures below among MLB players, using their actual eighth averages of EV and pVelo, with the corresponding hard-coded EA figures.
This may be a bit of seemingly-excessive work, and average EV and average bat speed figures still share a very high correlation, but it’s not 1 In addition, these bat speed figures are likely a little less precise at the ends of the distribution, as there is probably much less variance in bat speed between MLB hitters relative to our in-gym population, but we believe in its directionality and applicability for tracking intra-player changes, as will be our focus further in this piece.
Table of EA mean and SDs
Tables of bat speed leaders [2019]
Attack Angle/Top 8th LA
This will be a shorter digression, I promise In a previously penned piece called Pairing Blast & Hittrax Data Part II, we looked at validating the sabermetric contention that the average launch angle of the top eight hardest hit balls is a useful proxy for attack angle. We found it served quite well, with our combo figure resulting in a higher correlation, but also a higher RMSE. As such, we decided to roll with the industry accepted mean LA of top eight HHB’s.
MLB Derivations: Explaining Value
Ok, so to keep it simple in the first volume of this series, we looked at our potential KPI’s in relation to a hitter’s talent level. We decided to use wOBACON as our indicator of talent level for various reasons. We approached our previously cited metrics of interest from three POV’s:
- · Explaining the variation in a hitter’s wOBACON for that year
- · Explaining the variation in a hitter’s wOBACON for the next year
- · Explaining the variation in the fellow metrics of interest both in that year (descriptive) and the next year (predictive)
We looked at the full years of 2015 through 2019 and only used data from hitters that had at least 150 BBE’s per year (for that year of analysis) and its adjacent year (for year-to-year reliability figures); this cut-off of 150 was chosen as a reliability indicator in the aforementioned piece on the various cut-offs for reliability by metric.
Towards Addressing Point #1 and Point #3 (first half):
Note: The coded variable ‘nunique’ is included as the number of swings; I thought it would be interesting to use that as almost a sanity barometer, because a certain improvement in a metric should also correlate, in an ideal merit-driven world, with an increased number of opportunities.
Broken down by year2year segments
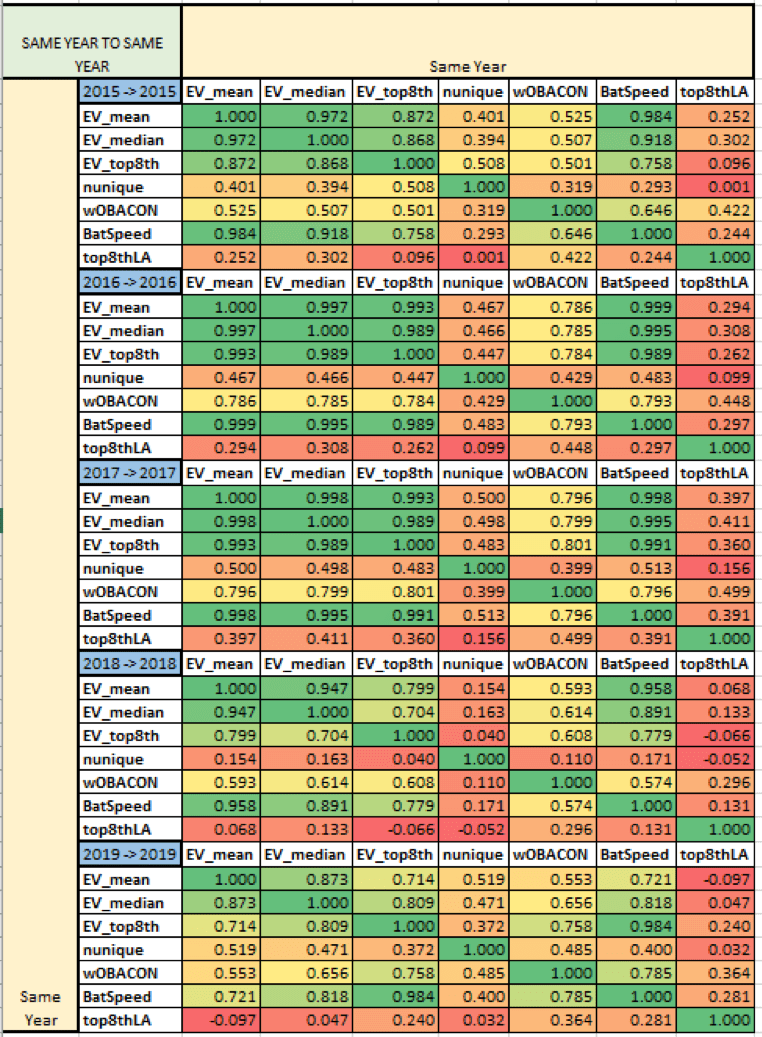
Averages of all year to year segments from above

Couple quick observations here:
- Top 8th EV actually outperforms EV mean and median on average in explaining the variation in wOBACON for the year.
- Bat Speed actually even outpaces EV metrics in explaining wOBACON (with the exception of last year), being on-par with top 8th EV for most years and outperforming it in 2019.
- Attack angle/”top 8th LA” correlations aren’t very interesting here since this doesn’t have a linear distribution with success on BBE’s anyways. It is still worthy to note that, while not on the same scale, the relationship between attack angle and most of the other metrics is still a non-insignificant positive value.
Towards Addressing Point #2 and point #3 (second half):
Broken down by year2year segments
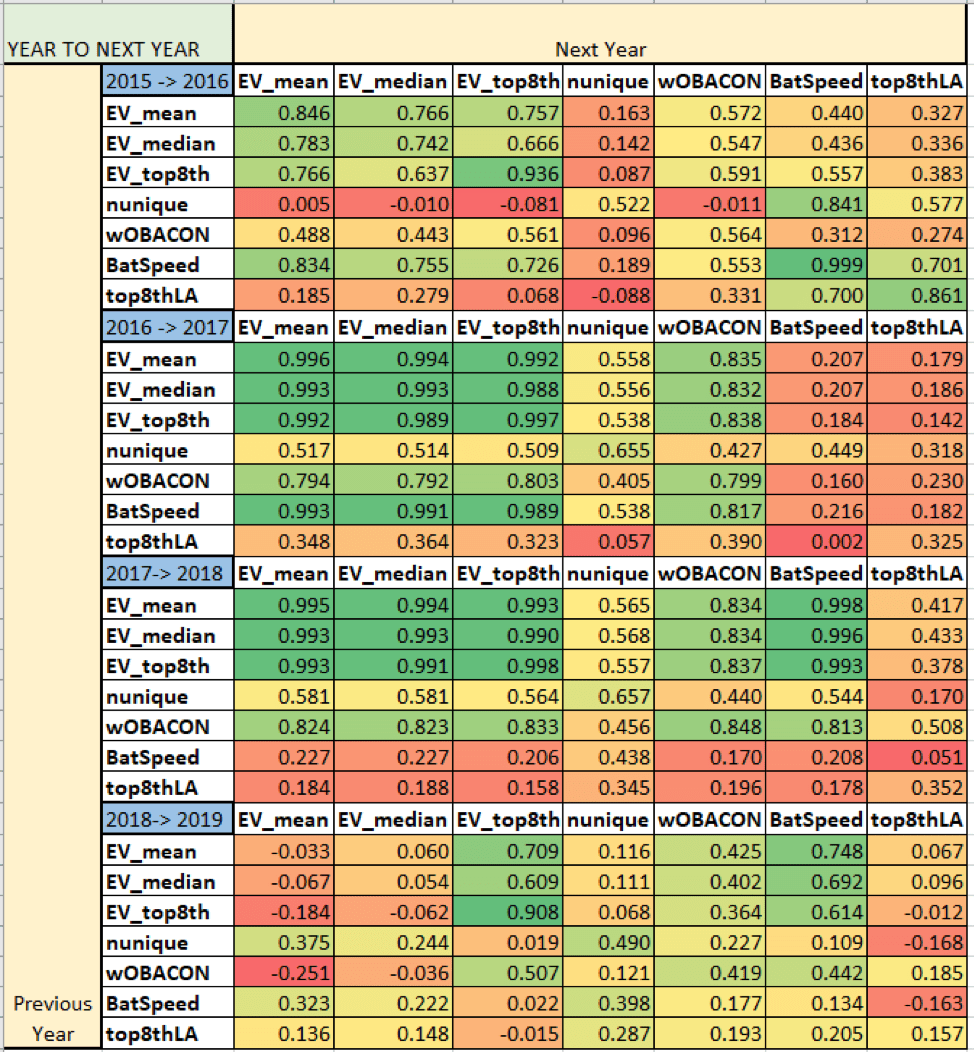
Averages of all year to year segments from above

Couple quick observations here:
- Top 8th EV was the most reliable metric year to year, with bat speed being the least reliable.
- All 3 EV metrics were on average extremely similar to the previous year’s wOBACON in explaining the variation in next year’s wOBACON, giving credence to the hypothesis that general EV metrics are as predictive of a talent metric like wOBACON as last year’s wOBACON itself.
- Previous year bat speed figures were much less predictive of next year’s EV figures & wOBACON in 2015 to 2016 and 2016 to 2017, possibly alluding to the higher magnitude of measuring errors in those years as compared to 2017 on; alluded to in tweets by our R&D members Alex Caravan and Dan Aucoin.
KPI Reporting Through The Coach’s Lens
The general gist of the last section can be boiled down to one straightforward aim: to identify the most useful and simplest metrics for evaluating the improvement of our hitters and our efficacy as hitting coaches.
During most training settings, the practice environment and technology itself does not perfectly replicate and track all aspects of the game. Specifically for hitters, it’s very difficult to track and judge plate discipline and contact stats. In today’s hitting development landscape, where buzzwords and unclear theories on mechanics run rampant, tracking movement and kinematics on a consistent (both a day-to-day and/or week-to-week basis) is extremely difficult, if not impossible, in the team setting.
Thankfully, we have solid statistical belief (covered above) that metrics such as EV and bat speed both effectively describe and predict wOBACON, our proxy for talent. Especially if you don’t have the ability or means to track other parts of a hitter’s arsenal, we can prioritize the characteristics we can track, and hold ourselves accountable that way.
EV
At Driveline, we have decided to track the average EV of each hitter’s Top 8th hardest hit balls, given its strong performance in describing and predicting wOBACON. This gives us a good indication of how hard the hitter hits the ball when he makes very solid contact. If this metric is far away from the hitter’s peak EV, then we know we are having some contact quality issues and can suggest a training intervention.
An example of such an intervention is changing the hitter’s programming to one of our contact quality templates. In these workouts, the hitter is still practicing with the intent of hitting the ball within 10% of their peak EV, but other constraints are added that focus on contact point and launch angle parameters.
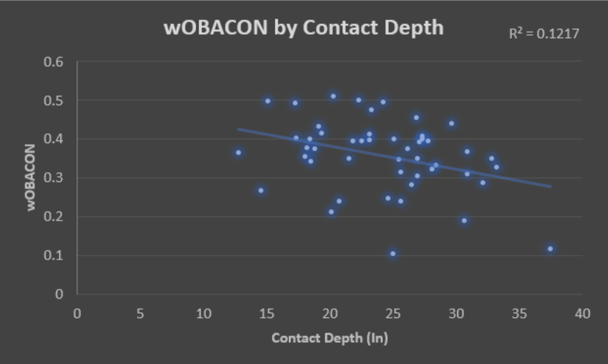
Our in-gym data suggests that a deeper, more consistent contact point is also associated with talent level, as well as batted balls that result in a higher wOBACON. If the hitter is struggling with consistency, we have some pretty strong evidence that an inconsistent or too-out-in-front contact point is the culprit, and would adjust the training program accordingly. While the relationship between wOBACON and depth of contact point is not as straightforward as the relationships and metrics discussed above, it’s an additional, more nuanced look that we use to analyze the current and projected abilities of a hitter.
Bat Speed
We also found that bat speed even outperforms EV metrics as a descriptive metric and can be a better explanation for hitter improvement. This makes intuitive sense, as the faster the bat is moving through the hitting zone, the more capable you are of hitting the ball harder, producing higher EV and higher wOBACON. Bat speed is the driver of those two metrics. If the hitter is lagging in bat speed, we would suggest an intervention related to increasing the hitter’s bat speed, in order to improve higher values of top 8th and wOBACON.
Besides a steady diet of high intent swings with overload and underload, often putting an emphasis on the intention of moving the bat fast can make a large difference in a hitter’s training. The specific intent of moving the bat as fast as possible through the hitting zone is enhanced by the instant feedback from a bat sensor. This provides feedback in real time and allows the hitter to realize newfound strength from their training, and understand new movement solutions in order to move the bat fast towards as many pitches as possible.
Attack Angle
Attack angle has a positive relationship to most metrics in our analyses, but what we find important here is that hitters can achieve their bat speed and EV goals while falling in a fairly large range of attack angle that make sense for producing productive batted ball events.
We aim for hitters to fall comfortably a range of attack angle between 4 and 20. If the hitter gets closer to either end of this attack angle range, then we will propose an intervention that requires different intent, drills and training goals.
The intervention for players who struggle with attack angle (mostly low attack angle) is to place them on a program that emphasizes the above two KPI’s (EV and bat speed), with a focus on a higher launch angle.
In general, if a hitter hits the ball hard, you can estimate that the attack angle and launch angle will have similar values. For this reason, we give hitters the specific intention of hitting balls for fly ball trajectory as hard as possible. If this is executed, we can assume the hitter has found a movement solution to move the bat on a different plane, allowing them to achieve the desired outcome (higher attack angle and a high EV fly ball).
How Does This Alter Our Programming and Help Us Become Better Coaches?
At Driveline, coaches are given a weekly report on the progress of each hitter. On this report is the improvement or decline of each player in Top 8th or bat speed. We have expected gains depending on the hitter’s current phase and their initial talent level or proficiency in said metric. This helps us to most accurately determine their progress—or lack thereof.
With this information, we are able to focus on each hitter and understand why they are or are not getting better. If they are not getting better, the assigned trainer for that player is held accountable and expected to give reasoning as to why. If no one knows, we spend time as a group trying to problem-solve a solution for this player and others like him.
If a player is consistently making gains and exceeding expectations, the assigned trainer to that player is asked to stand up and present what he did to help that player improve.
This system has improved our skills as coaches by making our meetings more organized, and holding a hammer of accountability over the coach themselves. Our job is to get hitters better in a few key metrics that lead to on-field performance. If we can’t track these metrics and hold each other accountable, then we make little progress towards our goal of creating systems that help mass quantities of players improve—players at all ages, types and levels of baseball.
With this information, our efforts to improve programming and conduct experiments has intensified. Ultimately, we plan to expand and improve upon a system that allows the athlete to have the most specific intention possible when training. These intentions, of course, are informed by what we track. We train hitters to train with the focus of hitting the ball as close as they can to their peak EV, moving the bat as fast as possible through space, and hitting the ball with an attack angle between 4 and 20 degrees.

*Above are example intentions our trainers provide our in-gym hitters. Highlighted are the specific constraints of launch angle and exit velocity, spray angle and contact point.
Designing a KPI System for Yourself, On a Budget
If you are going to track one thing, track bat speed. As mentioned in the analyses above, bat speed has the strongest relationship to wOBACON and will lead to improvement in your hitters.
This can be done simply by adding a bat sensor into your program. Pulling the data from Blast Connect is simple, and the data itself is easy to read. The website will give you a hitter’s average bat speed and attack angle, making tracking their improvement very straightforward. You could also get more granular and track 90th% bat speed and proportion of attack angle between 4 and 20 if that interests you.
Tracking average bat speed and attack angle should be sufficient. Most importantly, by tracking these metrics you will be able to supply your hitters with a very specific intent that directly relates to an improvement in on-field performance.
This is the coach’s dream!
Now, you can focus your energy on how to improve these key aspects and solve higher level problems, rather than guessing at what piece of mechanics can improve their game. Luckily, there are proven ways to improve bat speed, subsequent EV and attack angle. Best of luck to you and your program.
Train at Driveline
Interested in training with us? Both in-gym and remote options are available!
- Athlete Questionnaire: Fill out with this link
- Email: [email protected]
- Phone: 425-523-4030
Written by Quantitative Analyst, Alex Caravan and Hitting Coordinator, Max Dutto
Comment section