Front Side Glute Data in Pitching – An EMG Pilot Study
Let us start by recalling an earlier blog post about efficient front leg mechanics and what they do for the throwing motion, and velocity. In this post, we talk about how the front leg has the job of “slamming on the breaks” [1] and stopping the momentum of the body allowing for maximal momentum transfer to the arm. When a pitcher uses his back leg and the pitching rubber to give their body momentum towards the plate, the next step in their delivery is to use as much of that momentum to their advantage. Lead leg blocking is the mechanism that does this for a pitcher by stopping the motion of the front side of the body while the rest of the pitcher’s body and arm moves or “catapults” around it, toward the plate. In order for the front leg to stop the pitcher’s front side from moving towards the plate, it must not only make good contact with the ground, but extend and apply a hefty force against the motion of the body. A study using force plates on the front and back leg found that front leg ground reaction forces show a strong significant correlation to pitch velocity [2].
This is where the gluteal muscles come into play, to assist with extension, which is what leads to the force against the body. As a pilot study with another one of our biomechanical analysis tools, EMG sensors, we take a look at the front side gluteus maximus (GM) activation in a few handfuls of college and professional pitchers here at Driveline.
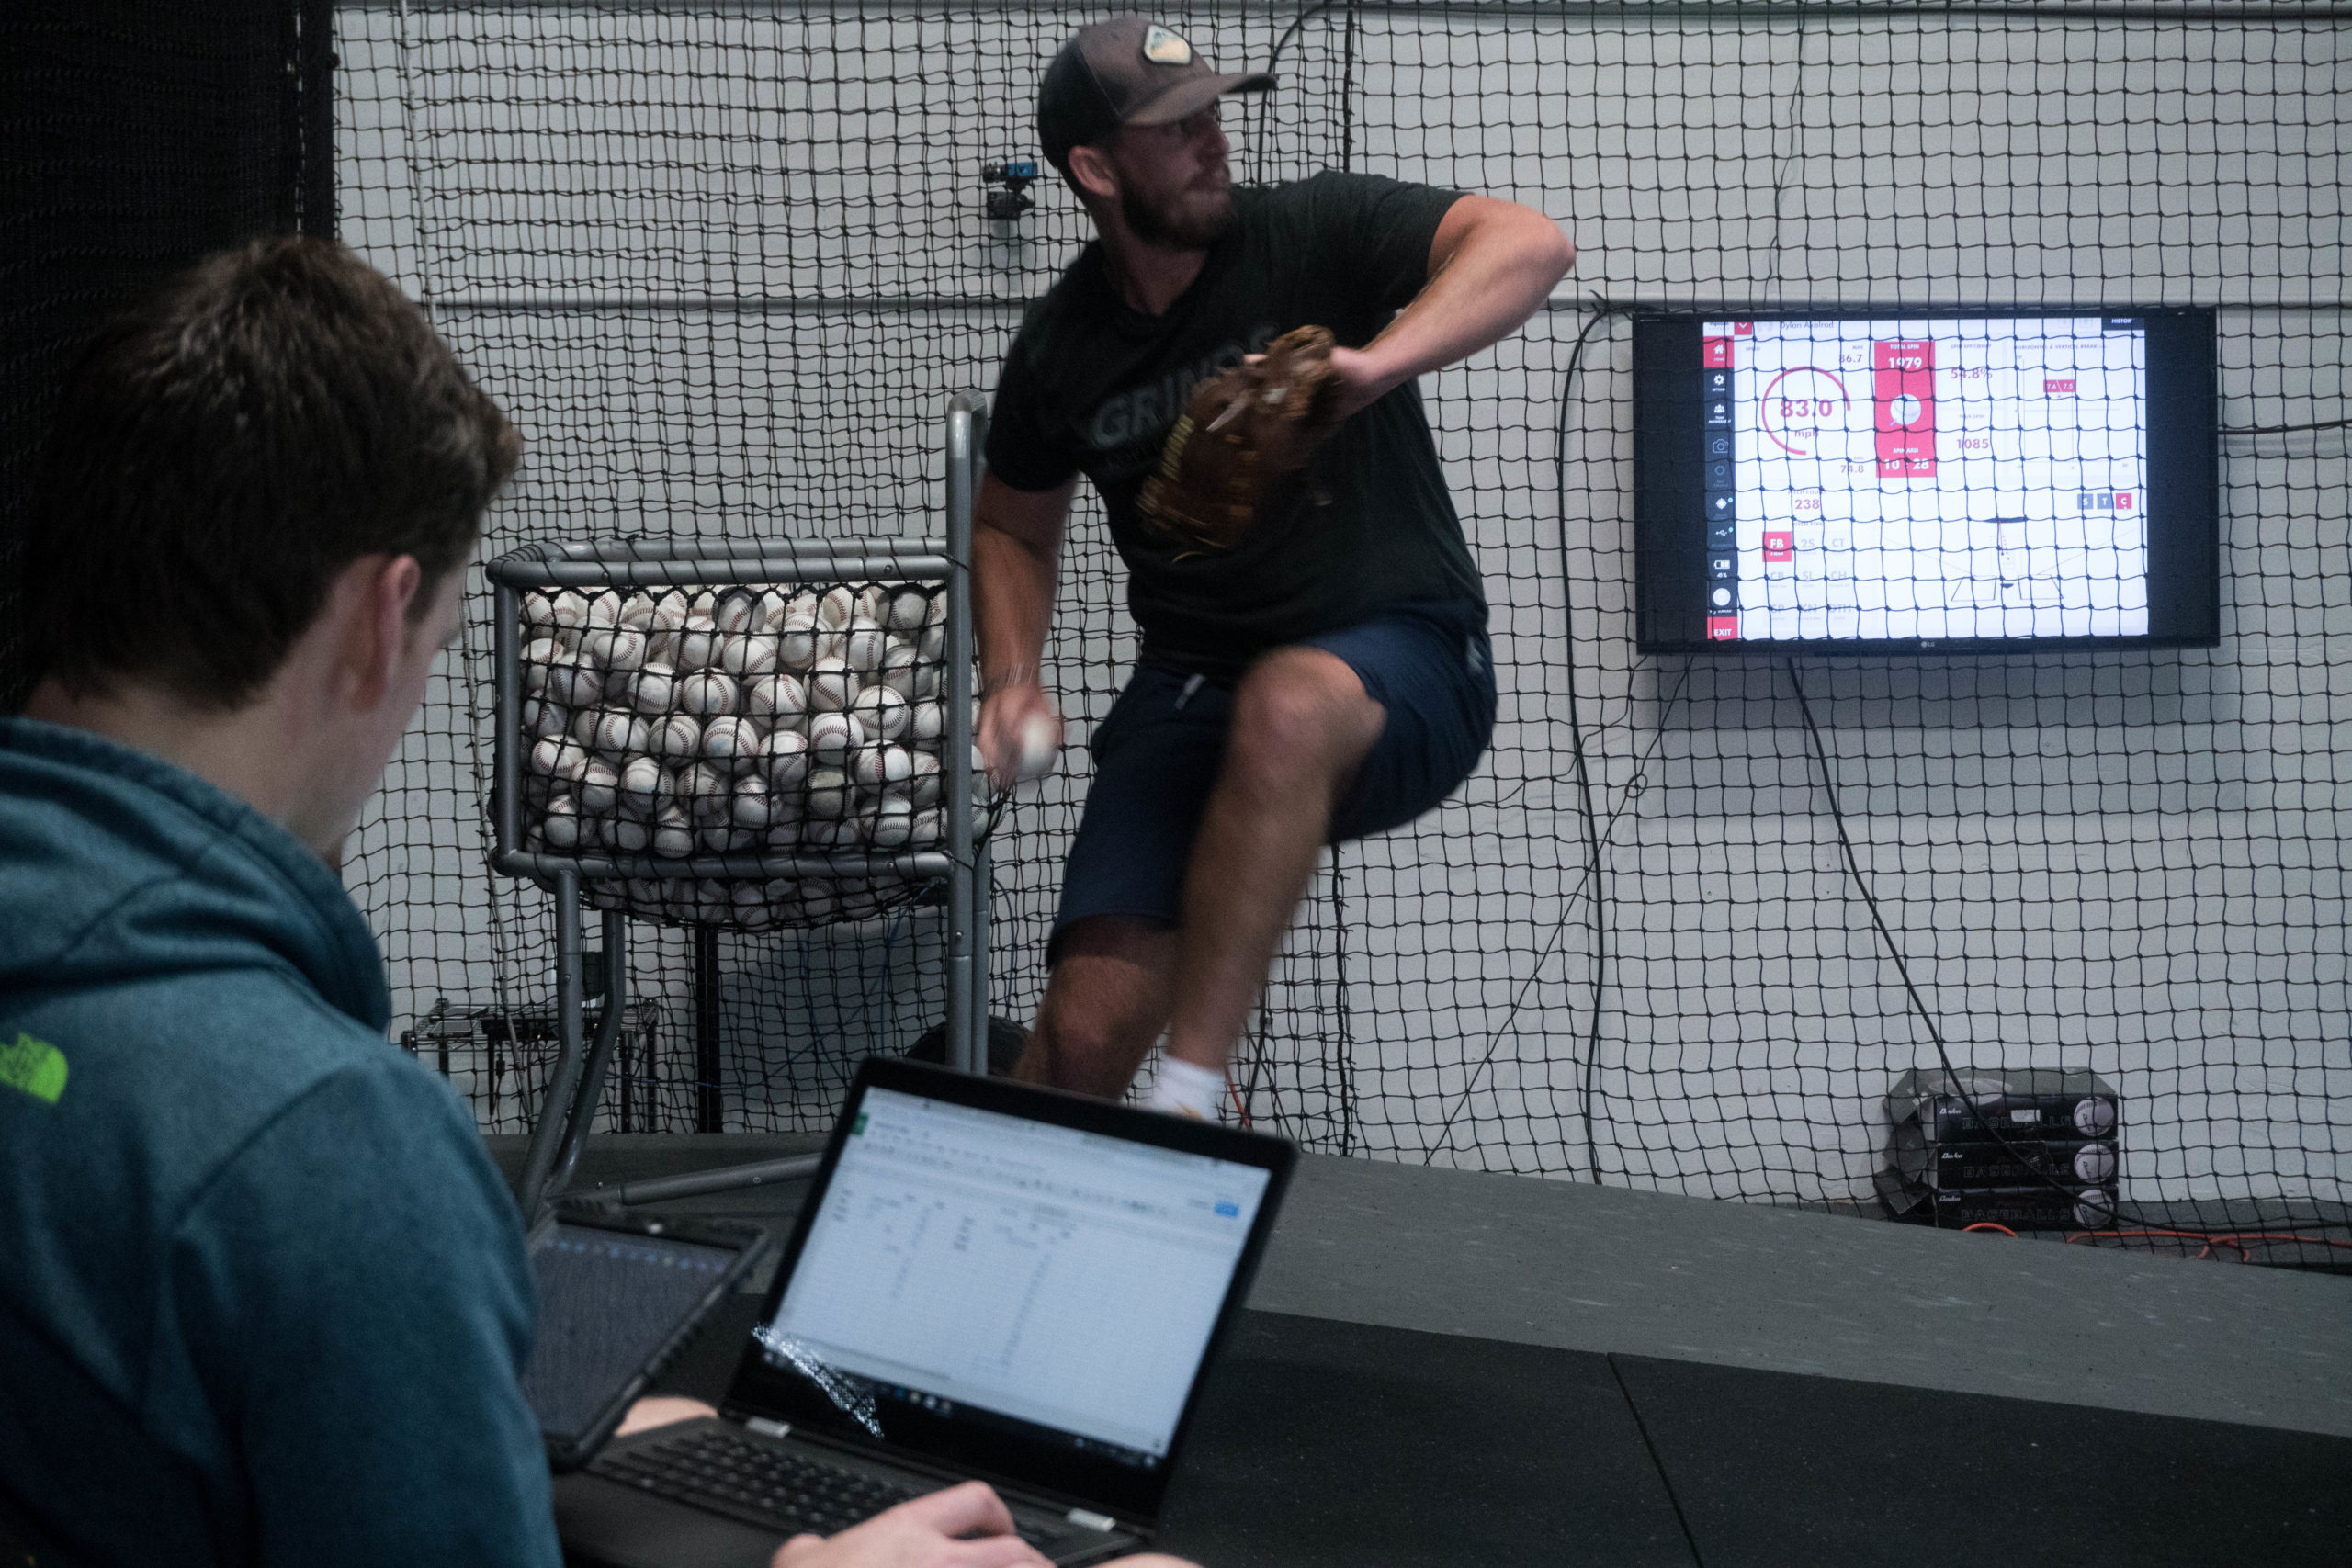
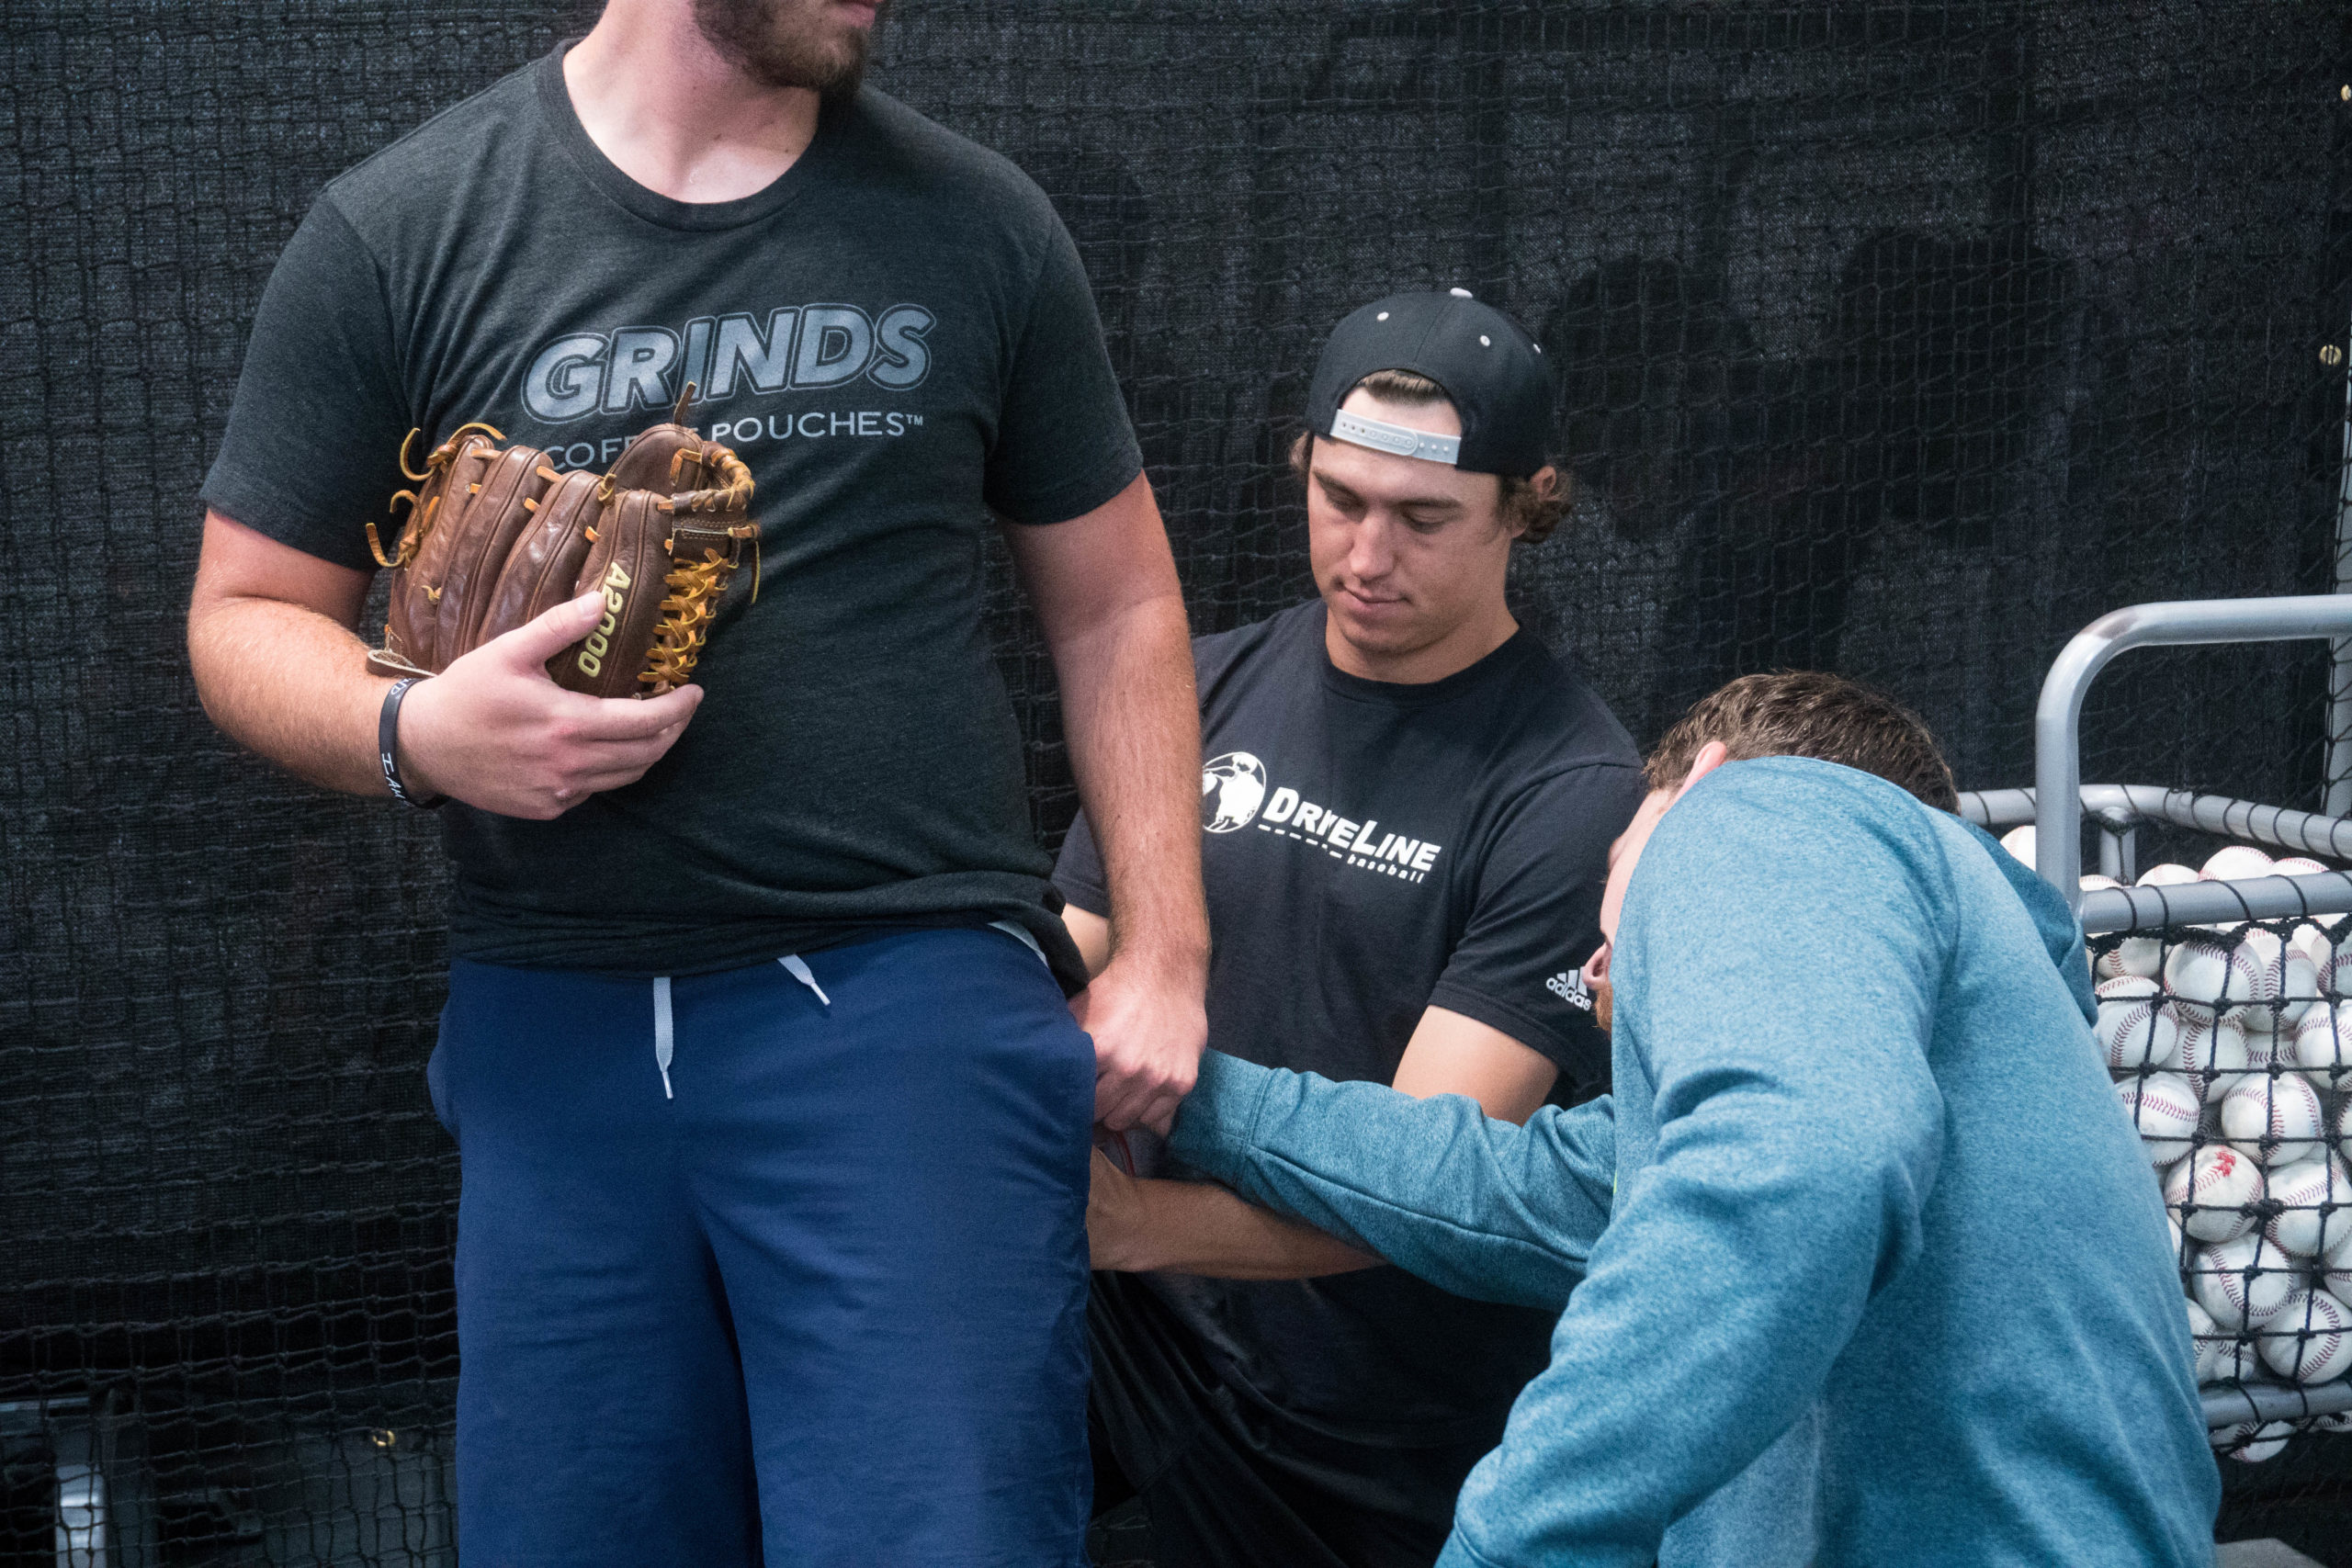
Figure 1: Image of data being received from the EMG sensor from the iPad, while staff member tracks velocities and other notes on movements during the velocity workout
Measuring the Lead Leg GM Activity
EMG, short for electromyogram, is defined as the monitoring of the neuromuscular activity in a muscle, which can be used to measure muscle activity, muscle tension and muscle fatigue, in addition to being correlated to force produced by a muscle. This signal can be measured in several different ways. Two of these methods are called Needle EMG and Surface EMG. Needle EMG is executed by inserting two or more metal needle electrodes that are connected to their own respective wires (sometimes called leads) into the muscle of interest in addition to a reference, or ground, electrode. Surface EMG is collected by applying the electrodes onto the skin along the length of the muscle in the form of gel stickers. This method is much less invasive and much more mobile, which allows for a wider range of applications. Both types of EMG send the signal to a collection device in which the data is either stored or just formatted and exported for storage and analysis.
In this case, the device we use for Surface EMG data collection is a very low-profile sensor called the Cricket, by Somaxis. This device is not only compact, but wireless, which makes it ideal for our purposes of collecting EMG data while moving with wide ranges of motion or just too violently for a setup with hard wire connections. This device is applied to the skin along the length of the muscle of interest, and is secured by a butterfly electrode. The sensor itself clips directly in between the two ends of the electrode, eliminating the need for any wire connections. The data that is received by the EMG sensor is sent to a mobile device, an iPad in our case, to be recorded and stored/exported.
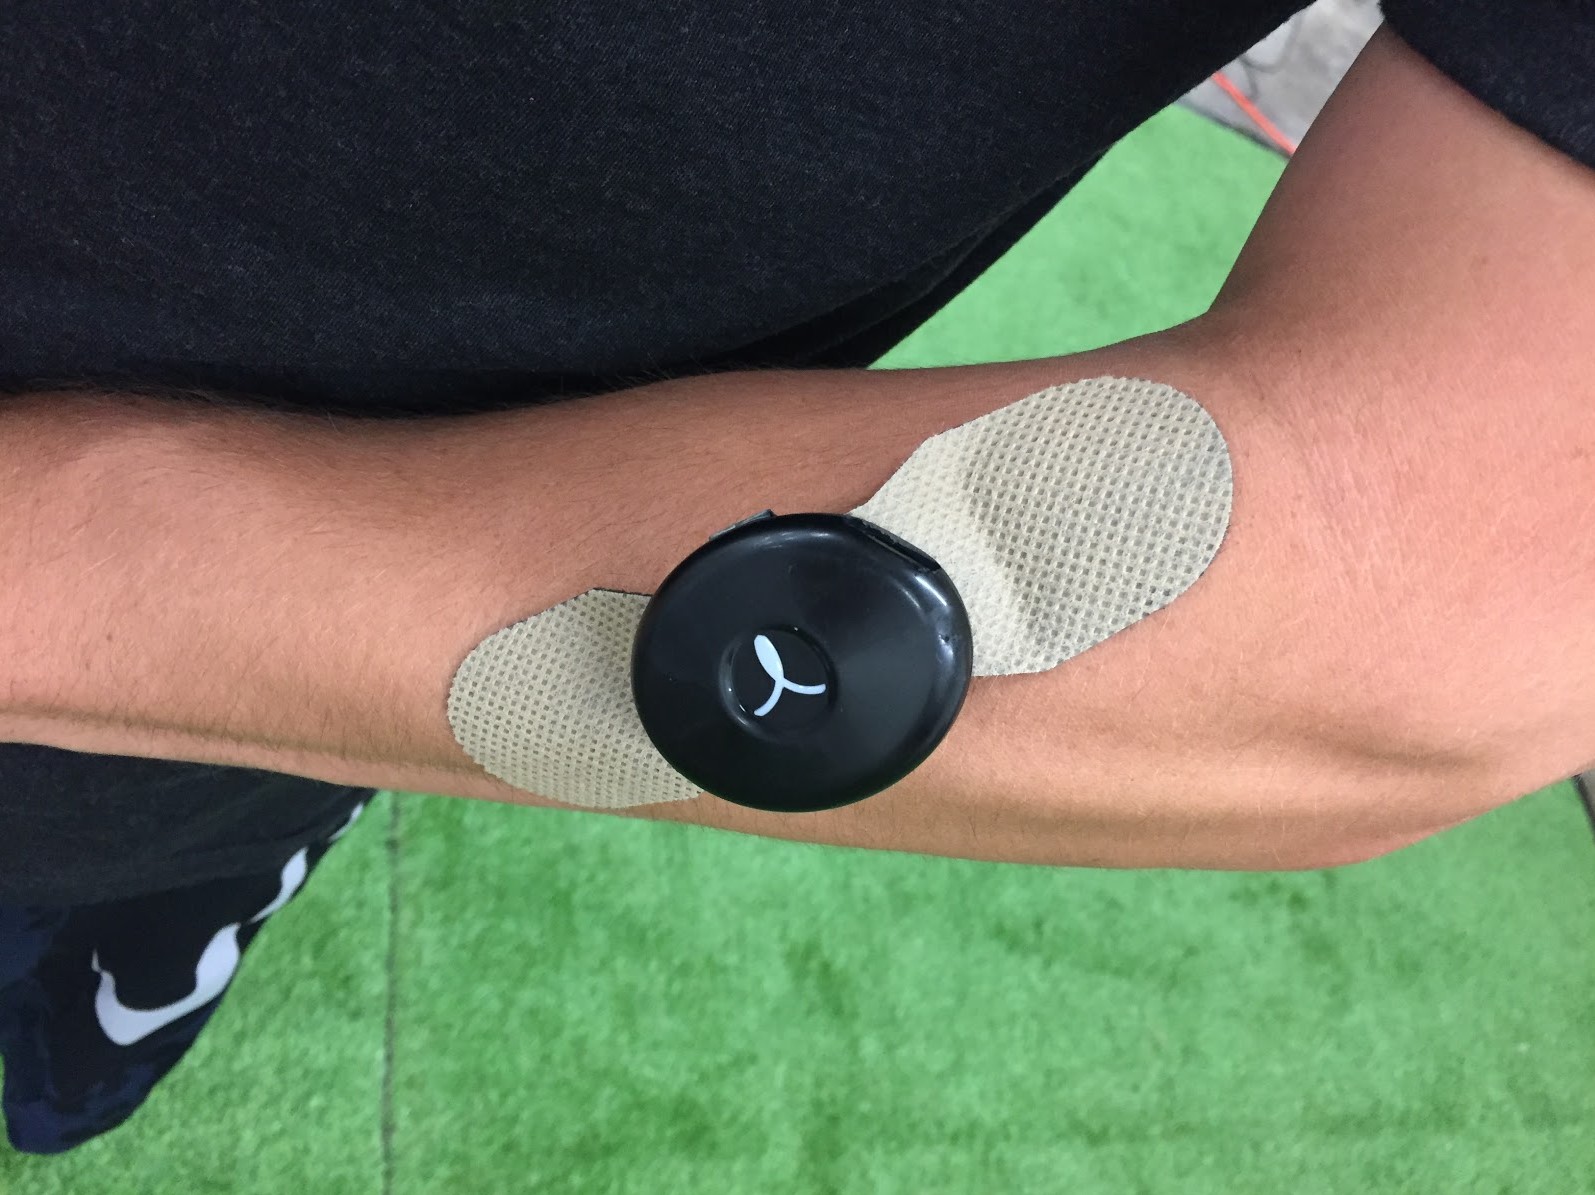
Figure 2: Image of the Cricket sensor attached to the butterfly electrodes and placed on an athlete’s forearm for EMG data collection.
Validating the Sensor
To be able to effectively use the data that is collected using the Somaxis Cricket sensor and for it to be widely accepted, the technology must be validated. A short validation experiment is necessary to show the reliability and accuracy of the data that is collected by the sensor. This validation can and has been done for devices on muscles using isometric contractions of various levels of intent [3]. Usually, the results from the sensor are compared to a “gold standard,” but without access to an accepted stationary surface EMG collection device as a gold standard at this time, validating the consistency and reliability characteristics of the data in addition to comparing it to muscle force will be sufficient.
From what we know, handgrip strength can be correlated and estimated using surface EMG on the forearm extensor muscles [4,5]. Using this knowledge, a quick validation can be done by comparing handgrip strength, collected by an electric hand dynamometer, to the EMG signal on the extensor muscles bundle in the forearm. For the sensors to be validated, the EMG signal that is collected should show a positive correlation with muscle force, and the data should be consistent and reliable enough in terms of connectivity.
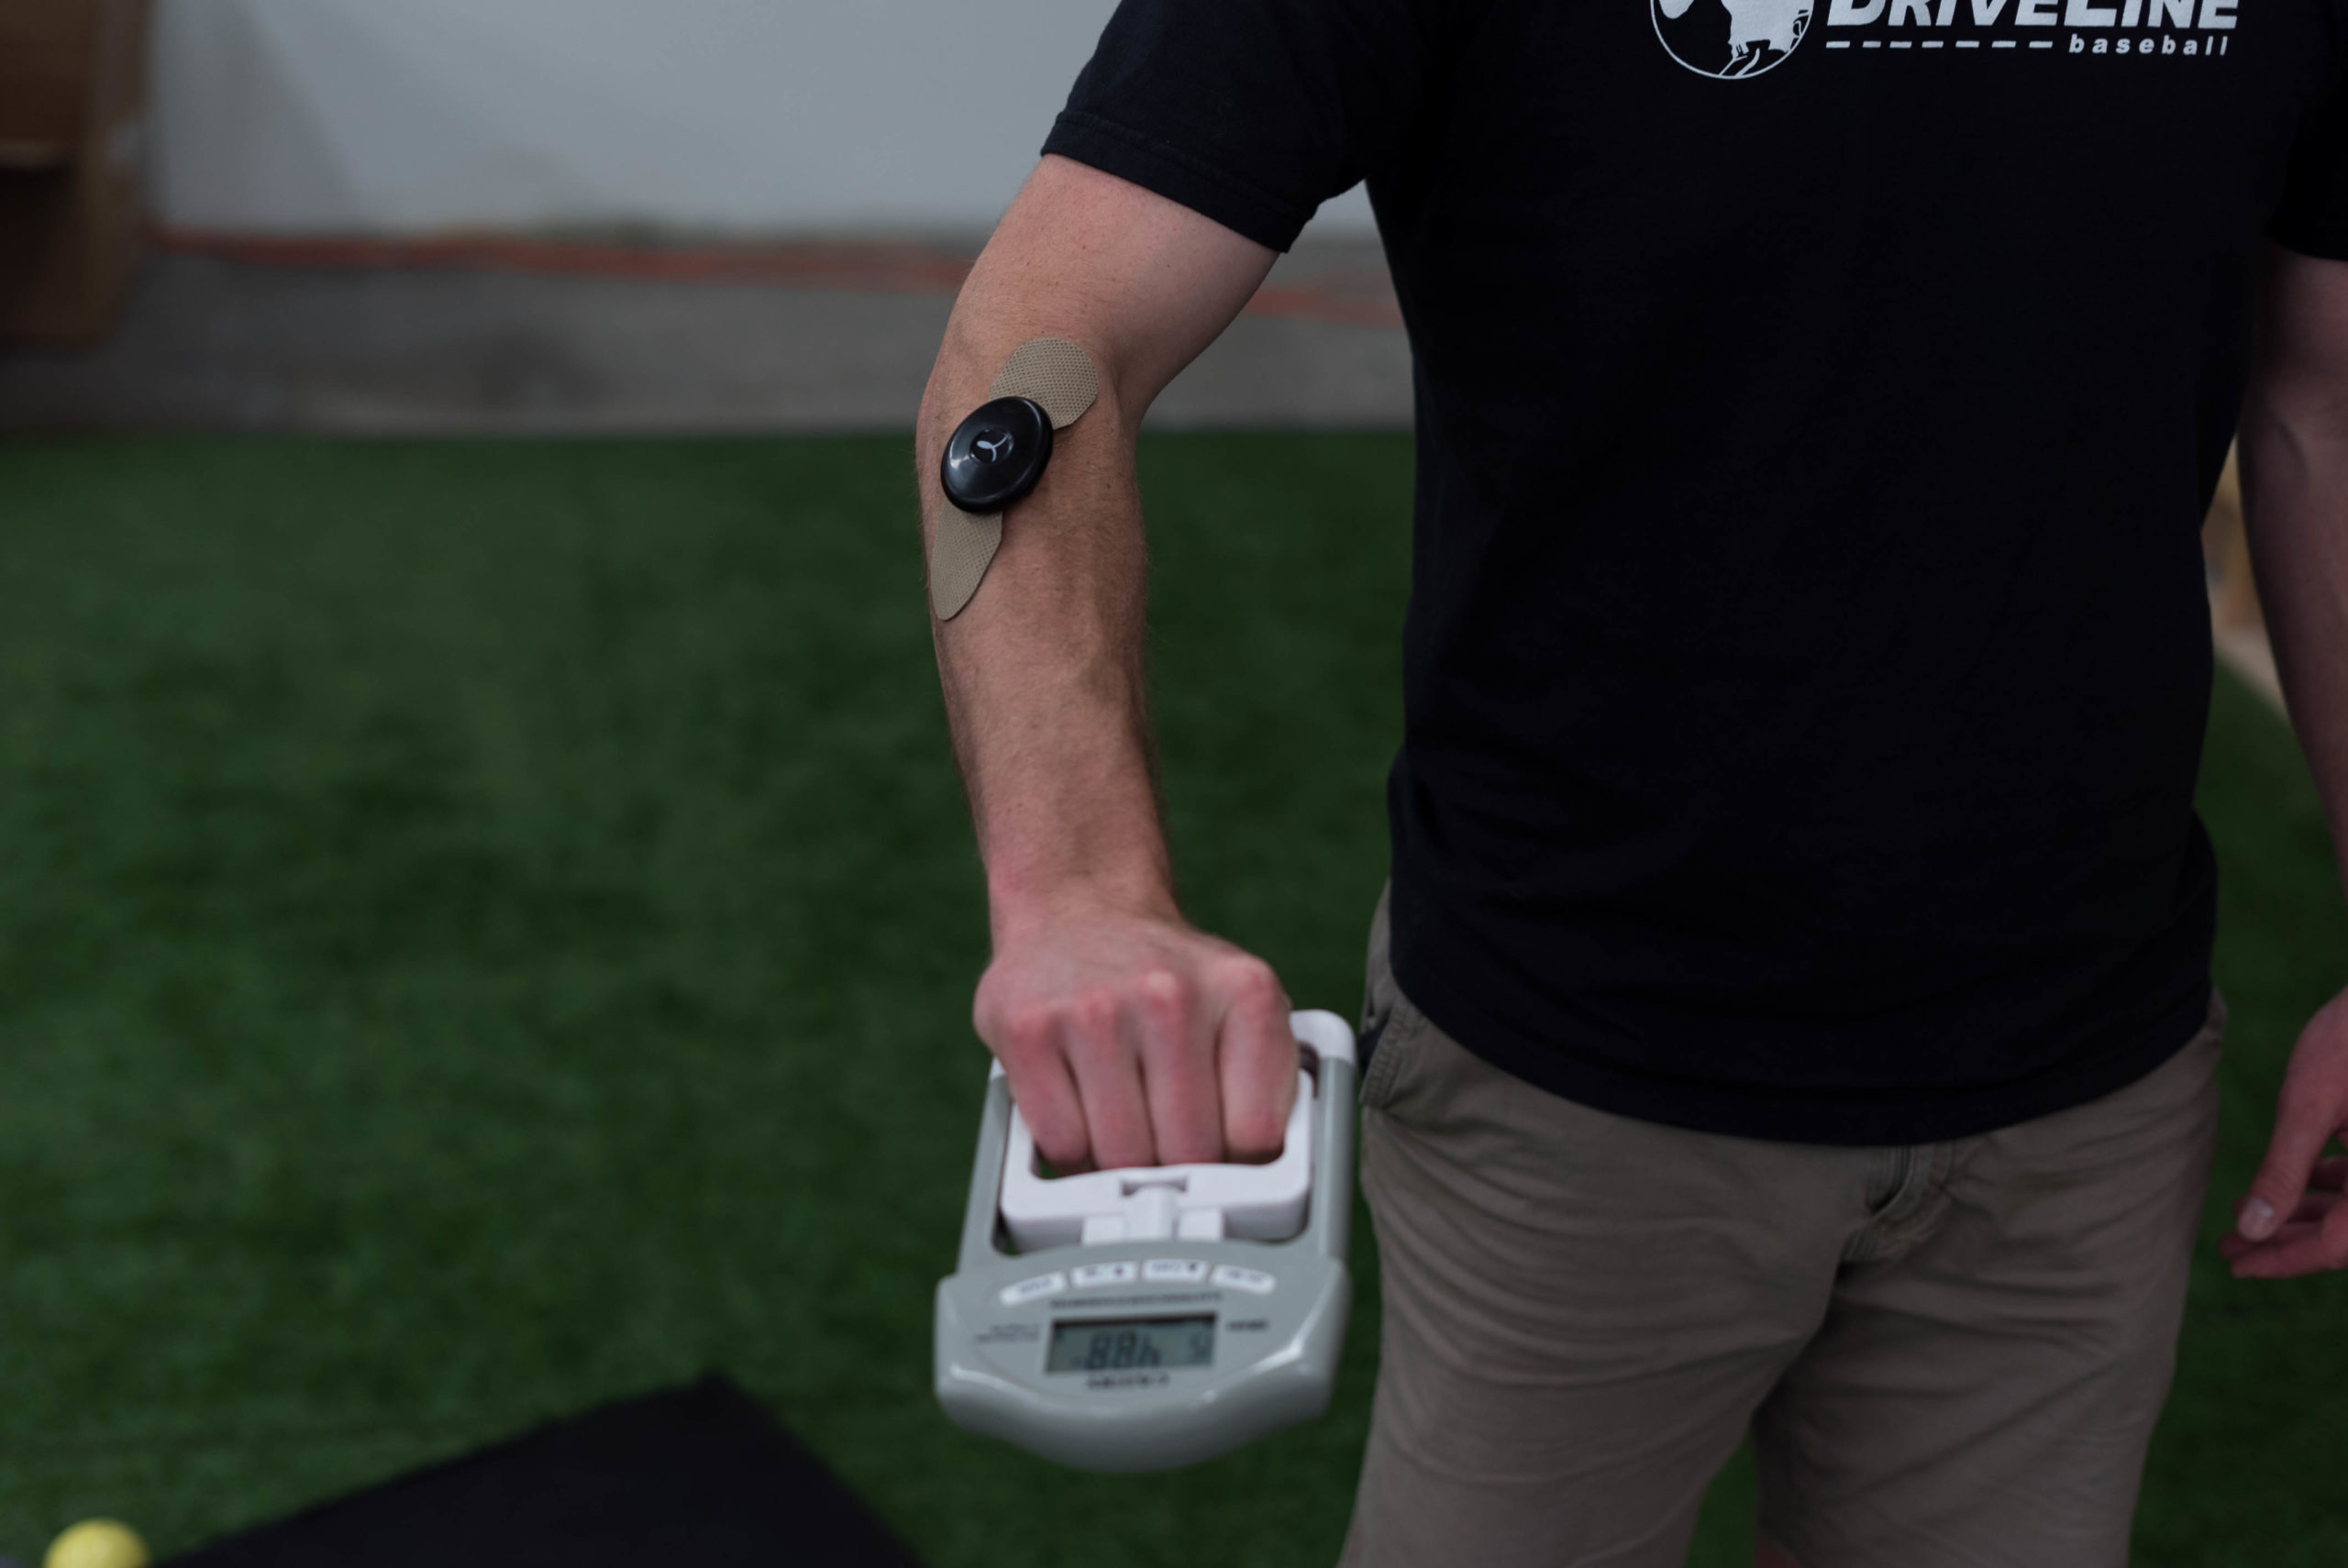 Figure 3: Image of sensor placement and Cricket validation setup used for correlating grip force and forearm extensor muscle EMG.
For this experiment, 5 subjects wore an EMG sensor during a grip strength exercise while gripping a dynamometer at 100%, 80%, 60%, and 40% of their maximum rating of perceived exertion (RPE). The skin on the testing site of their forearm was prepared using an alcohol swab, allowed to dry, and then the sensor was placed along their extensor bundle forearm muscles. After the EMG recording was started, the subject performed a contraction at 100% RPE followed by the four levels of intent in decreasing order for two seconds (100%, 80%, 60% and 40% RPE). The recording was ended after a total of 5 contractions were performed, the sensor was removed, and the electrodes were discarded.
The data was filtered with a high pass butterworth filter with a cutoff frequency of 10 Hz and analyzed. The mean and max EMG amplitudes were measured for each contraction, as well as the mean frequency. No normalization was done in this case, only straight-forward regression analysis on grip force versus these three metrics.
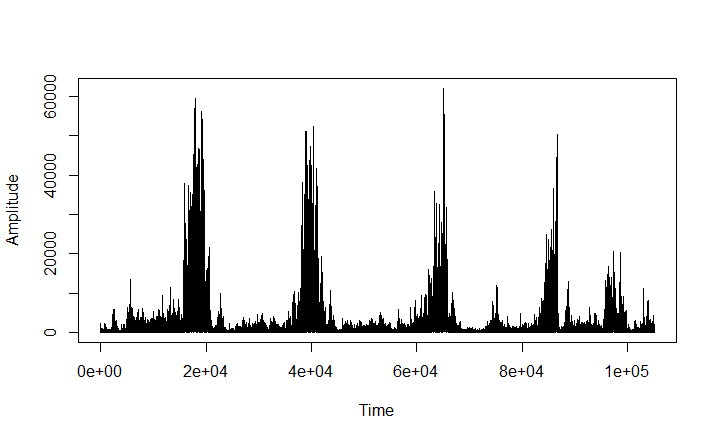
Figure 4: Time domain signal of a Cricket Sensor validation trial with the EMG activity of the forearm while performing grip strength exercises at 100%, 80%, 60%, and 40% RPE, respectively.
Validation Results
Without normalization, grip force vs. mean amplitude of the EMG signal during the forearm contractions showed a r-squared value of 0.532, meaning grip force accounted for over 50% of the variance in the mean EMG amplitude during the contractions. The r-squared value for the grip force versus max amplitude and mean frequencies are 0.458 and 0.118 respectively. The p-values for the correlation of grip force vs. mean and max amplitudes are 0.0000213 and 0.000123 respectively. Mean and max amplitudes both show a significant positive correlation with grip force to one percent significance, but mean frequency did not show a significant correlation.
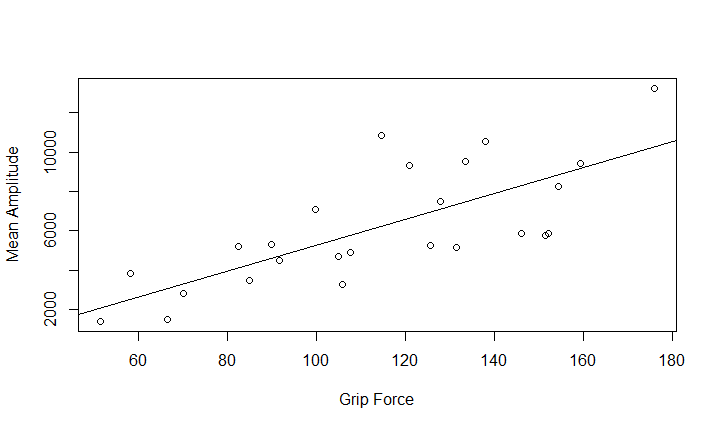
Figure 5: Correlation plot comparing the Mean Amplitudes of the EMG signal for the Grip Force of several subjects.
As expected, the EMG signal’s mean and max amplitudes during the forearm contractions showed a statistically significant positive correlation with the grip force, validating that the data received from the Cricket Sensors are reasonable and therefore valid. The consistency of the data collected is shown by the consistent positive correlation between all subjects as shown in Figure 5, and the reliability is shown by the clean quality and lack of disconnection between the sensor and the mobile device as shown in Figure 4.
Methods – GM Study
For the front side gluteus maximus study, a mix of 20 college and professional level pitchers were asked to wear a Cricket EMG sensor on their front side gluteus maximus while they all perform the same workout. The workout is a bullpen with 2 – 3 sets of 5 fastballs at maximum intent, totaling to between 10 and 15 fastballs per trial. The skin on the application site was prepared using an alcohol swab before the sensor was placed. The Cricket sensor was placed on the gluteus maximus with the electrodes running alongside the belly of the muscle.
Figure 6: Image of staff members applying EMG sensor to a pitcher’s front side gluteus maximus
Following the placement of the Cricket sensor, the electrodes and sensor itself were covered with Rock Tape to prevent electrical conduction and additional motion artifact from the athlete’s clothes. Before the athlete began their workout, a MVIC was recorded by performing a “PRONE” position contraction in which the athlete was asked to lay on their front, flex their knee to near 90 degrees, and lift their foot towards the ceiling of the building against the bodyweight resistance that was applied to the bottom of their foot or posterior thigh/hamstring area for 2-3 seconds as shown in figure 7. The athlete was then asked to complete their workout while the live EMG data was monitored to ensure proper wireless connection and reasonable data. After the workout was finished and the data recording was ended, the athletes were asked to remove the sensor, and the electrodes were discarded along with the Rock Tape that was covering it. The Cricket sensor was wiped with a disinfectant and stored for the next use.
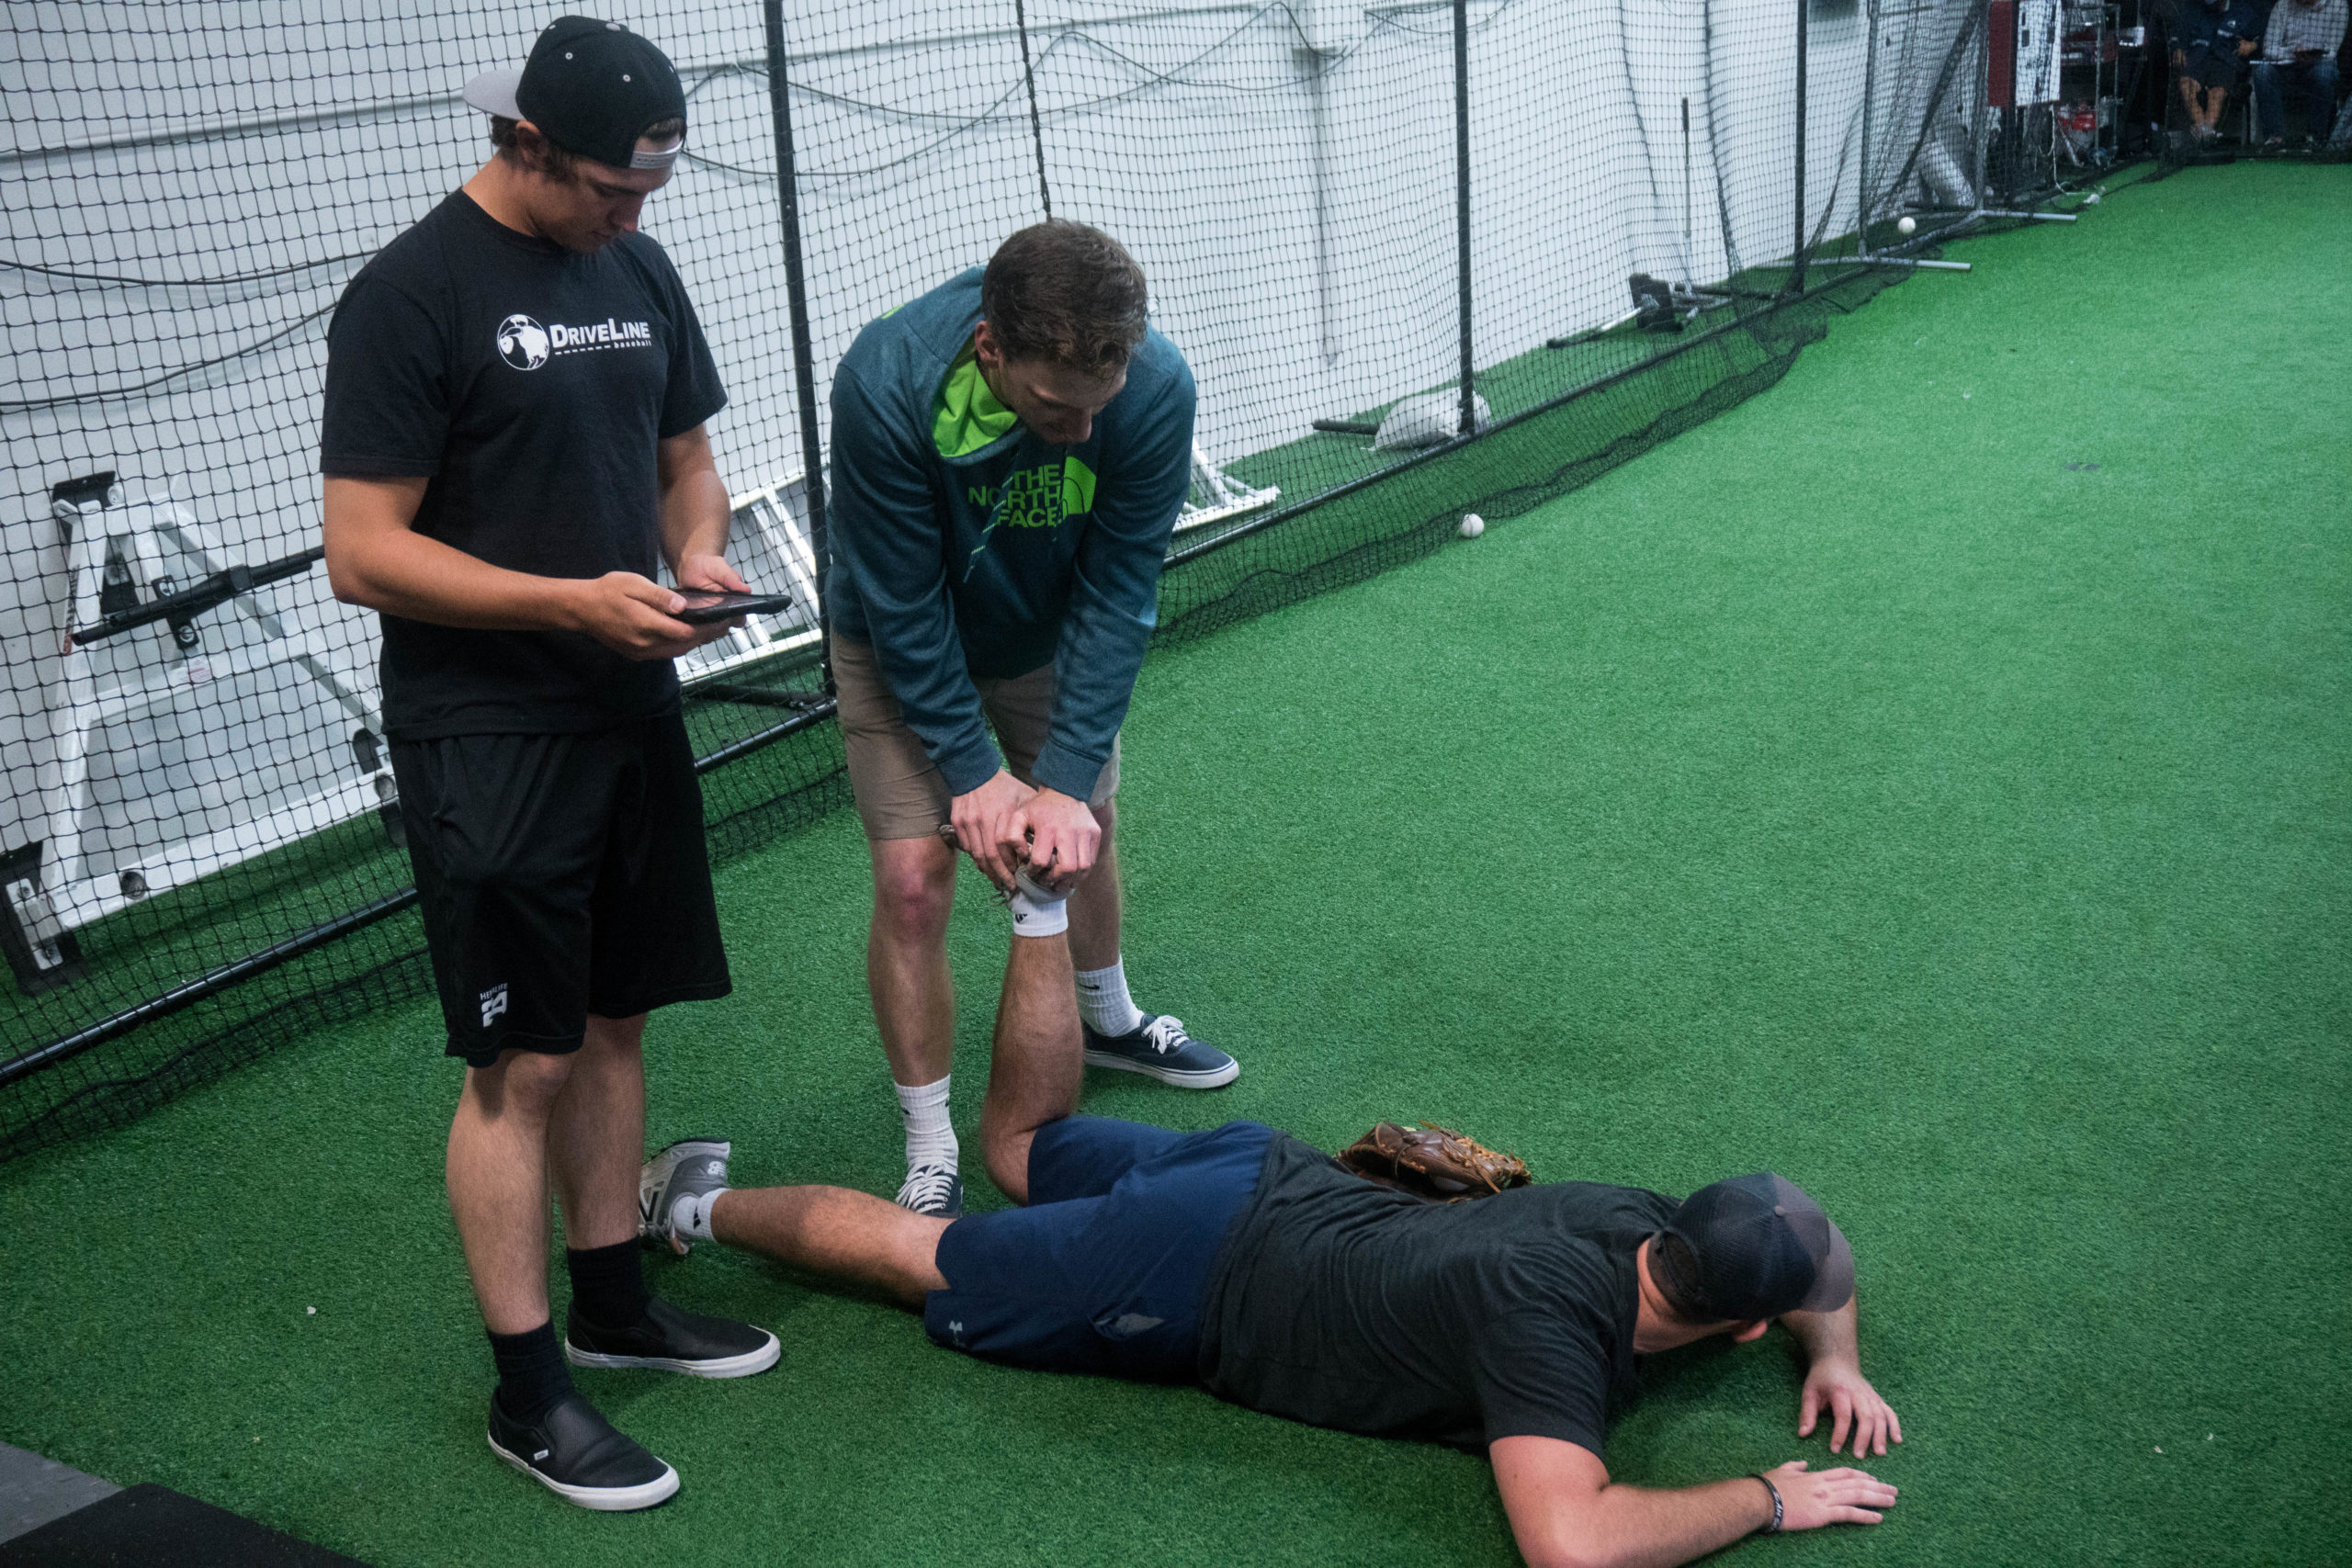 Figure 7: Image of MVIC in the “PRONE” position being performed. The data from this baseline is used to normalize the data, so that the EMG data can be compared between subjects.
Data Processing
After placing the EMG signal for the whole session into a directory in R, a script was run to filter and analyze the bullpen session EMG signal. The signal was filtered with a high pass butterworth filter with cutoff frequency of 10 Hz. After the signal is filtered, windows of 2000 samples were placed around the events, in which the mean and max amplitudes as well as the mean power frequencies (MPF) were all calculated within that window. All three of these values are recorded for each spike to be outputted and saved for analysis. In addition to these three metrics, each window is plotted for visualization which helps with qualitatively ruling out misreads. The data for all of the pitches for each player was stacked into the same data sheet, and read into R for simple regression analysis.
Results
The logarithm to base 10 of maximum EMG amplitude of the gluteus maximus during the pitch normalized to the athlete’s MVIC, and the mean EMG amplitude showed significant positive correlations with pitch velocity with significance to 1% and 10% respectively. They had r-squared values of 0.0644 and 0.0423 respectively. This means that normalized maximum EMG amplitude of the pitch explained just over 6 percent of the variance in the pitch velocity when looked at by itself, while the mean EMG amplitude of the pitch explained just over 4 percent of the variance in pitch velocity when looked at by itself. The mean frequency as calculated in this case study did not show a significant correlation with the pitch velocity.
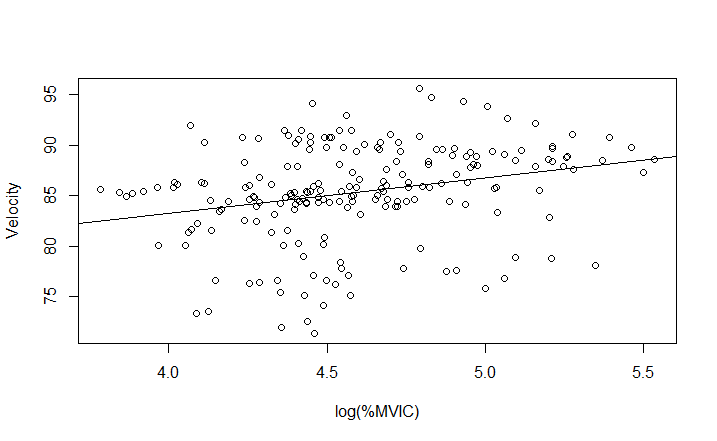
Figure 8: Correlation plot comparing velocity of each pitch to the logarithm to base 10 of the normalized maximum EMG amplitude in the athlete’s front side gluteus maximus during the pitch.
Discussion
The weak correlation correlation between EMG amplitudes and velocity makes a good deal of sense. There is a chance that it is a product of electrode misplacement, because if the electrodes are not accurately placed along the belly of the muscle, the surface EMG sensor will not capture the entirety of the signal. That being said, this is most likely due to the fact that lead leg blocking is a compound movement that involves several extensors. This means that there is more than one muscle that extends the leg, including hip and knee extension.
With regards to mean values of amplitude and frequency, conclusions cannot be final with the data collected. Because of the way that the signal is represented as a single column of data for the whole session, to get the mean values for each pitch, there has to be an accurate window encapsulating each pitch or event in the signal to give an accurate representation of the pitch itself. In this case, a standard window was determined using video analysis of one pitcher, but that window did not fit all pitcher’s deliveries which resulted in the analysis of some amount of inactivity in addition to cutting out some of the wanted data for some pitchers.
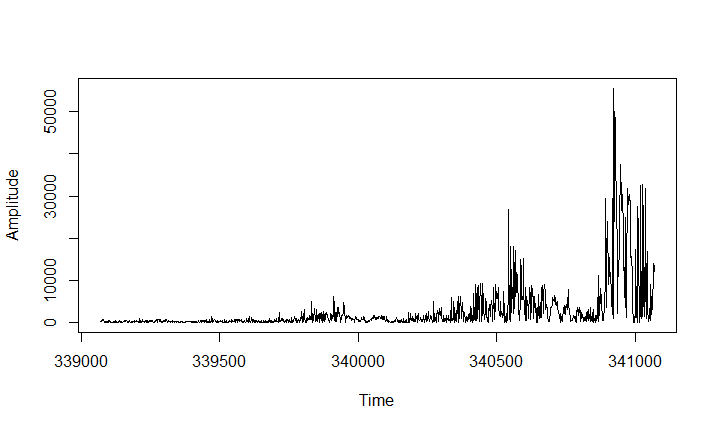
Figure 9: Full-wave rectified and filtered EMG signal with the standard length pitch window placed around where the proposed pitch is, with respect to time, in the bullpen. This shows the window misplacement for each pitch in some subjects that leads to inaccurate averaging.
For the mean values to be accurate and usable, the window of analysis would need to be personalized for each subject so that each event is represented correctly to minimize the amount of inactivity captured and maximize the desired data. This would need to be done by either using a different standard definition of onset EMG signal with regards to when the amplitude spikes and resets, or by videoing each of the subject’s motions to get an accurate visual representation and timing.
What This Really Means
Surface EMG as it stands, is a very useful tool for acute measurements and analysis, but is not a valid form of evaluation for the long term effects of muscle activation or outcomes of compound movements. For example, if an athlete does not activate their gluteal muscles during a squat as much as the athlete next to him, we cannot say that their squat is weaker than the next athlete because his quadriceps could pick up the slack and move an overall heavier weight. This is because there is a wide range in combinations of muscle contractions to execute the same compound movements, hence the name, Compound movement.
This study on pitcher’s activation of their front gluteus maximus shows to prove such a point, because even though there is a large variance between gluteal muscle activation between pitches, the subject’s intent and outcome are similar. Further, on pitches with a higher activation in the gluteus maximus, the quadriceps or hamstrings could have lower activations if it has a similar outcome to a neighboring pitch with different gluteal activation. We can not definitively say that this is true, because we did not have EMG sensors on the other extensors of the pitcher’s front leg, but assumptions can be made by using what we know from the gluteal activation and the outcome of the pitch.
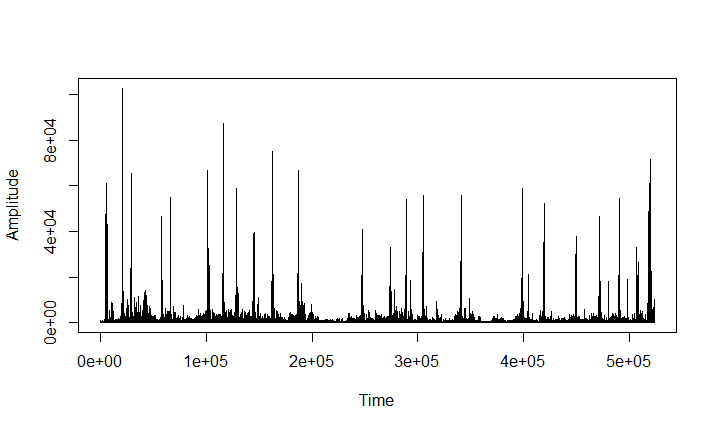
Figure 10: Time domain EMG signal of an entire mound velocity workout with 3 sets of 5 maximum intent fastballs with four warm-ups and two MVIC’s.
Using the observed variance between repetitions, we can also begin to conclude that mechanics that are aimed at being repeatable, when it comes to individual muscle activity, aren’t. We would love to be able to break mechanics down in a way that can be repeated all the way down to the individual muscle contractions because this would allow for more efficient training and specialized strength. Although that would hypothetically allow for better training economy and would be optimal for training athletes, we have to accept that compound movements as complex as a pitcher’s delivery are more chaotic than uniform. This alone is a good reason to train chaos, and macroscopic movements rather than muscle specific, isolation exercises when training athletes.
What Comes Next
As mentioned in discussion, the pitching motion is a very advanced movement. Eric Cressey, a writer and baseball performance coach, talks about in a blog about how even, “some of the best in the world struggle to consistently repeat their mechanics,”[6] resulting in significantly different outcomes. In this blog he cites the variance of velocity in even the most elite pitchers in the MLB. There are countless external factors when analyzing this phenomena, including but not limited to, shape and size of the mound, temperature outside and wind during the game, not to mention physical differences in an athlete’s body with respect to health and hormone levels. This goes to show that the pitching motion is highly difficult to repeat, even at the macroscopic level. From the data collected here, we see that the repeatability is even harder to achieve at the microscopic level, which needs to be taken into account while training and performing as an athlete.
In exercise and sports science, really in all of science, we hope to be able to use scientific findings or trends to apply it towards a grander scheme. In this case, we cannot use the data for any strong conclusions about gluteus maximus being correlated to velocity or lead leg blocking. What we can use it for, is to validate the idea that there are many variations of muscle activity to achieve the same compound movement, and test it further by using multiple EMG sensors on the front leg. By doing this, we could test our hypothesis of quadriceps or hamstrings picking up the slack or lacking when gluteal activation is lower or higher, respectively. This would be a very interesting study, which could possibly tell us something about total extension EMG amplitude (gluteals, hamstrings, and quadriceps summed) in a pitcher’s front leg, and whether or not it is correlated to velocity.
What this also could lead us to, is attempting to break EMG into a more longitudinal setting by using it as a regular tracking/testing tool for athletes in the weight room as well as their throwing workouts. If we were able to regularly track athletes muscle activation during certain strength exercises and during their throwing exercises on the same muscle groups to compare the changes in outcome during their training, then we would be able to make some broader conclusions using EMG. This type of study, specifically, would be very beneficial for the exercise and sports science world, because we would potentially be able to correlate strength exercises to outcomes in sport rather than simply using movement comparisons to assume correlations.
This post was written by Kyle Lindley, Summer 2017 R&D Intern at Driveline Baseball. EMG analysis was Kyle’s independent project in the Driveline R&D Internship Program.
References
[1]”Efficient Front Leg Mechanics That Lead to High Velocity”, Driveline Baseball, 2015.
[2]M. McNally, J. Borstad, J. Oñate and A. Chaudhari, “Stride Leg Ground Reaction Forces Predict Throwing Velocity in Adult Recreational Baseball Pitchers”, Journal of Strength and Conditioning Research, vol. 29, no. 10, pp. 2708-2715, 2015.
[3]T. Walters, K. Kaschinske, S. Strath, A. Swartz and K. Keenan, “Validation of a portable EMG device to assess muscle activity during free-living situations”, Journal of Electromyography and Kinesiology, vol. 23, no. 5, pp. 1012-1019, 2013.
[4]Hoozemans, M. and van Dieën, J. (2005). Prediction of handgrip forces using surface EMG of forearm muscles. Journal of Electromyography and Kinesiology, 15(4), pp.358-366.
[5]Duque, J., Masset, D. and Malchaire, J. (1995). Evaluation of handgrip force from EMG measurements. Applied Ergonomics, 26(1), pp.61-66.
[6]E. Cressey, “Are Pitching Mechanics Really Repeatable?”, Eric Cressey, 2017.
We’ve published other articles summarizing our research, check them out here!
Comment section