Putting ForceHooks to the test
What are they?
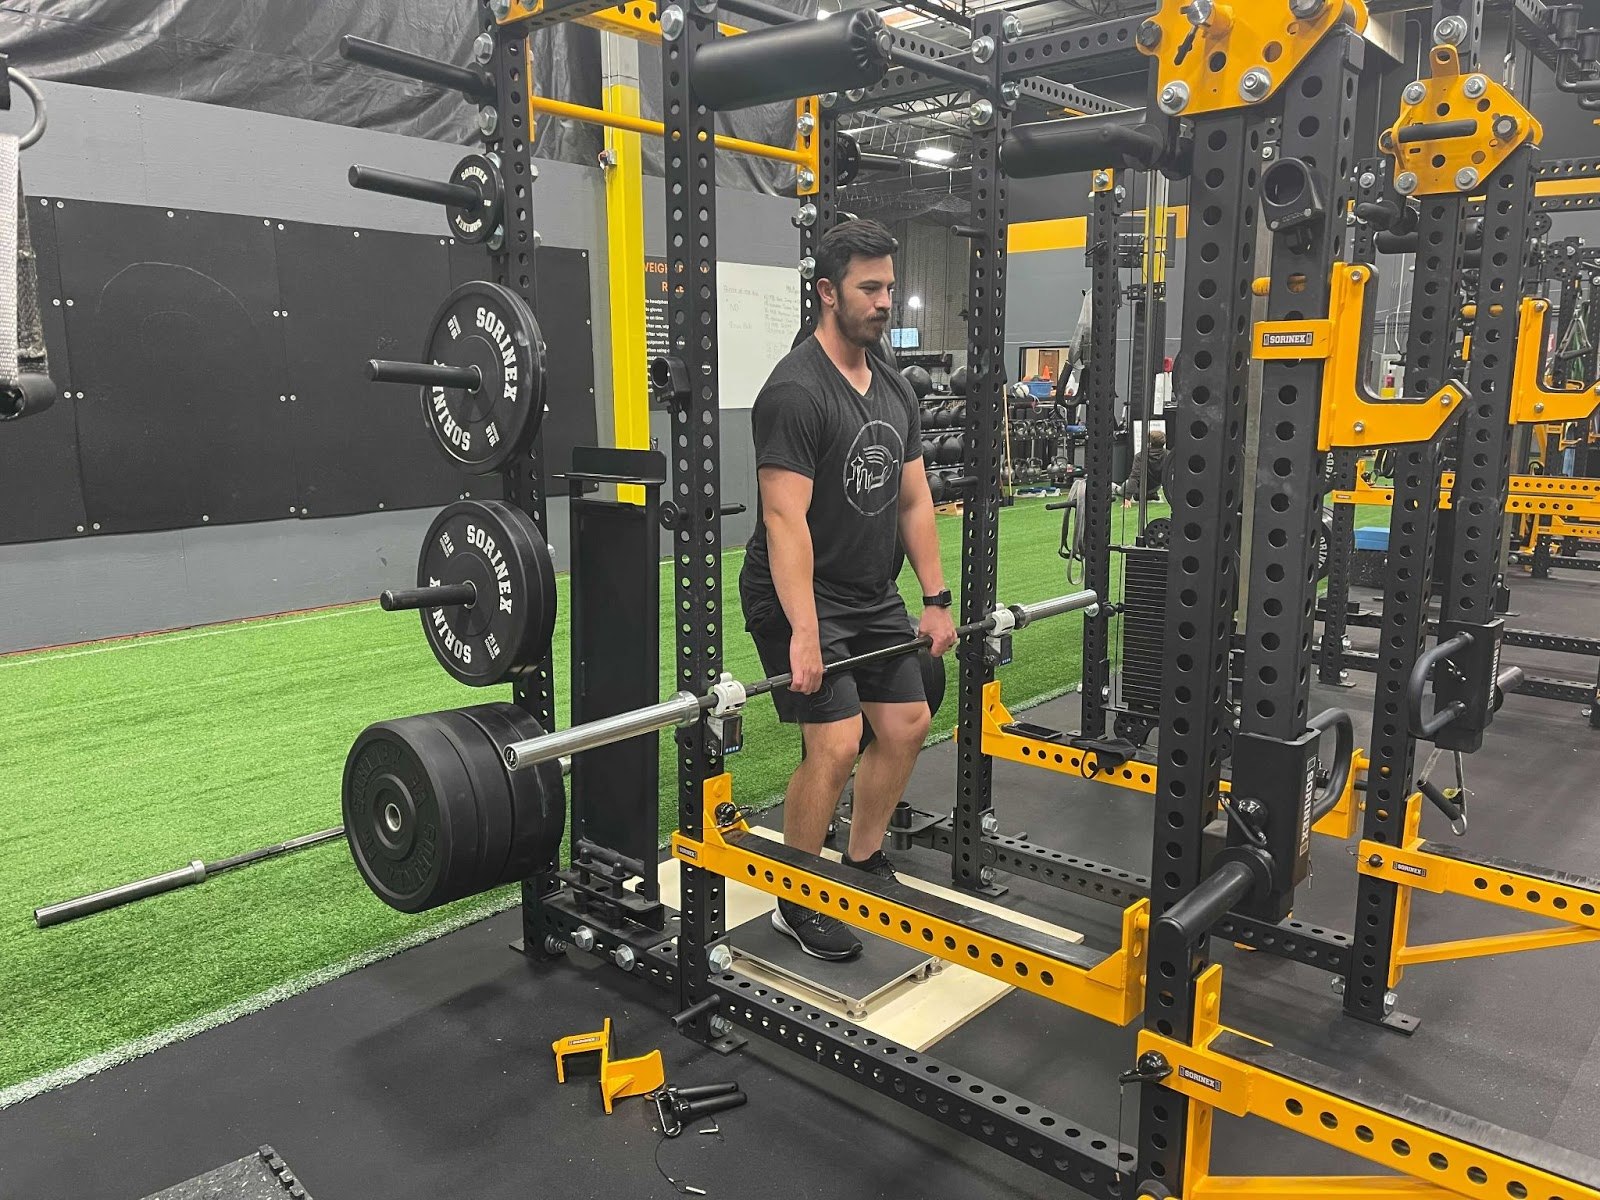
ForceHooks are a portable dynamometer that can be secured to a weight room rack as shown below. The other end of the device is modular, currently featuring an eye bolt, a hook designed to secure a barbell, and an open attachment for handheld resistance measurements.
The ability to secure between a barbell and a rack is groundbreaking in that the device can be used to measure any barbell isometric exercise. This could make for a portable setup for the Isometric Mid-Thigh Pull (IMTP), like what we use in our strength assessment process. However, it could be done without the need for force plates or tests of which the output would be difficult to measure, even with force plates (i.e., an isometric row).
How accurate are they?
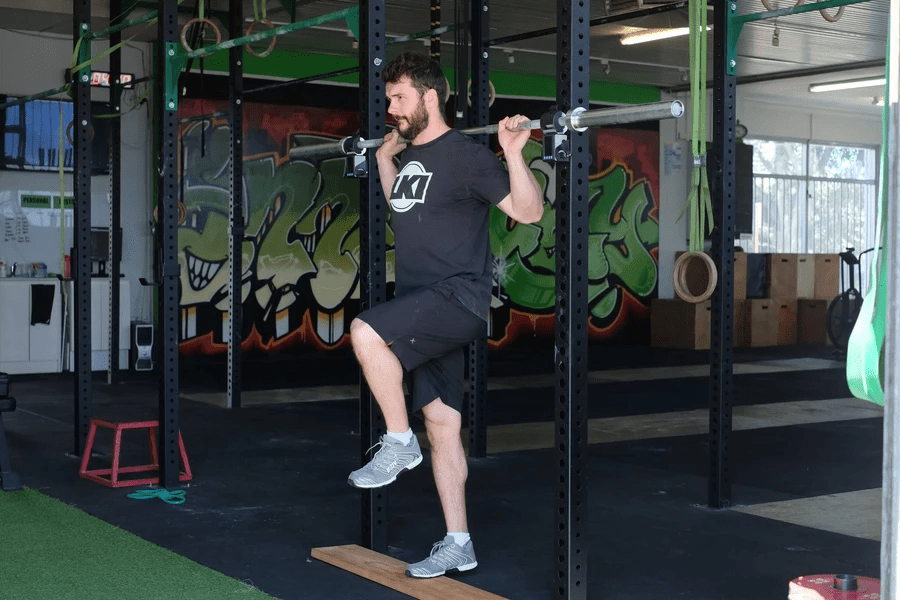
Before implementing the ForceHooks with our athletes in any capacity, we needed to validate the device’s accuracy. Using our portable dual-force plates from ForceDecks, we were able to set up an IMTP rig as shown below.

To reduce potential error that could occur from the setup of the rig and not the devices, we placed a plywood layer under the plates to account for the slight give of the rubber gym flooring. We also opted for a stiff 29mm power bar in place of a typical barbell to minimize the bend of the bar during the pull.
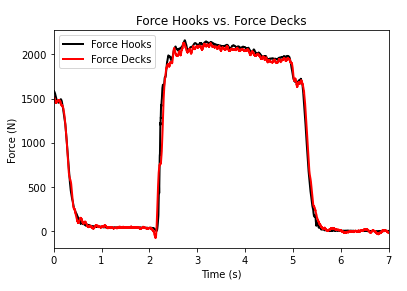
With a sample size of 65 trials, we compared the full signal force traces from the ForceHooks to the force plates and then calculated the difference between the two signals at each sample.
To get a better idea of how the magnitude of the pull affects the error of the hooks we also looked at a Bland Altman plot which illustrates how the error changes across varying magnitudes of a measure. This tells us if the error in measurement changes when a trial shows high vs. average or low forces.
Results
Here is what we found:
- Mean error in max force reading: -28.97 N (FH on average reads about -29 N lower than force decks)
- Mean absolute error when force is above 75% of max: 66.1 N (2.55% error)
- Mean absolute error across the whole recording: 93.0 N (3.62% error)
- Average correlation between the signals: r = .9895 (r^2 = 0.979)
- Bland Altman Plot

- Example force trace alignment of one trial
Our Verdict
With an average max force error of -28.97 N (~1%) and an r^2 for the full force trace of 0.979, we feel very confident implementing the ForceHooks. Their versatility will open up new isometric assessment options that previously were not feasible, including potentially expanding our strength assessment to include upper body force production.
Written by Connor White
Comment section