Starting Pitching Workloads: Part 1
There has been discussion recently about workload and the impact this time may have on an athlete’s health once seasons begin again.
More specifically within the context of baseball: Will there be an increased injury risk to pitchers as seasons begin again? If so, what are some possible solutions to mitigate these issues?
Using data presented by Ben Hansen (Modeling Elbow Torque by Throwing Distance) and data collected in-gym at Driveline via the MotusTHROW sensor, I was able to build a rough model of the impact of various training programs on throwing workload. While the main purpose of this blog is not an extensive review of each of these metrics, you may find more detailed descriptions of the metrics used in this article.
If you’ve never seen these metrics before, there are a few key takeaways. Every throw a pitcher makes can be given a value. The sums of these individual throws can be used to evaluate changes in the total workload an athlete experiences from throwing.
This is different from the traditional thought that pitch counts in a game are the best way to monitor workload. Traditional pitch counts fail to account for throws made before the game—both in long toss and the bullpen—as well as any throws made on days between outings in a game.
Did you throw any bullpens between starts? Do you play another position on your team? What intensity level were the throws you made? These are the types of questions we need to be asking when discussing workload management in the context of baseball.
Chronic Workload
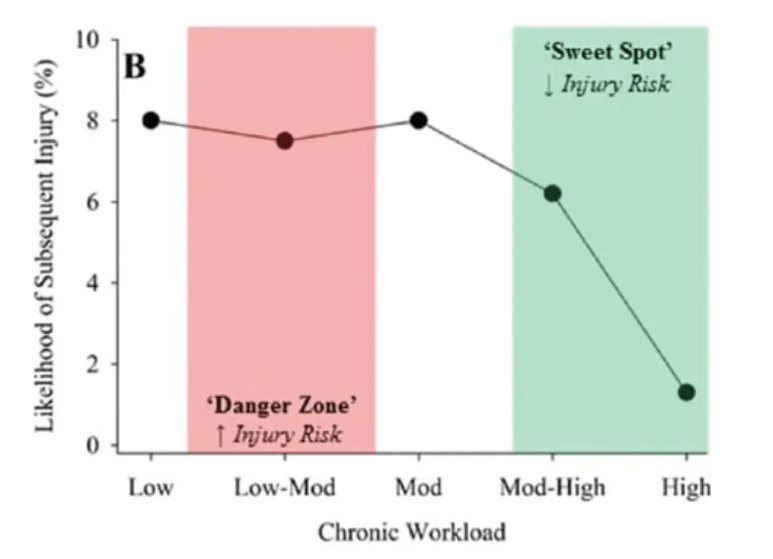
Traditional thought seems to be that throwing more is inherently dangerous. That may be true—to an extent—as making more throws will result in more chances of injury, but at the same time will not necessarily increase the actual likelihood of injury. Chronic workload is a phrase used to describe an athlete’s throwing habits over longer periods of time, 28 days in this instance. Previous research has shown that greater chronic workloads can allow athletes to make more throws in the short term as well. These greater chronic workloads allowed athletes to handle larger acute workloads but also be more adaptable to changes in their acute chronic ratios. Typically the narrative surrounding workload is restriction/reduction in an effort to prevent injury; however, in most cases building up a larger base of chronic workload is critical to allowing an athlete to withstand the rigors of a full season.
In order to increase an athlete’s chronic workload we need their acute workload to be greater than their chronic workload (ACR > 1.0), but increasing this value too quickly may have adverse effects. Greater risk for injury in high-school-aged baseball players was found when their ACR was greater than 1.3. It is certainly worth noting that there is conflicting research and resulting opinions regarding the use of ACR as an indication of risk of injury. It is very unlikely that one metric alone will determine an athlete’s likelihood of injury. Nonetheless, monitoring the degree an athlete’s workload changes over time can still be valuable.
While most current throwing programs focus primarily on throw counts and throwing distance, we should be putting more emphasis on the workloads generated by each individual throw. I think most people would agree that having a pitcher throw 100 pitches on Day 1 is not the way to do things – just as you wouldn’t walk in the weight room after weeks/months off and attempt a 1RM. But what does a more objective, workload-driven buildup of chronic workload entail?
Below I will touch on two different throwing programs professional athletes may be following during this period of time, specifically starting pitchers. We will look at multiple scenarios for their return to in-game action and the effect those scenarios will have on their workload.
For the sake of this blog, we will assume that the throwing plan given out by organizations during this period mirrors one of the following two weekly options:
Org. A – Similar to a Spring Training schedule
Day 1: “Day Before” – Plyo Ball ® throws + Extension LT (similar to a Hybrid B)
Day 2: “Live/Simulated” – Similar to a Game Day (35 pitches)
Day 3: “Day After” – Light Catch out to 90 feet (similar to a Recovery Day)
Day 4: Off
Day 5: “Day Before” – Plyo Ball ® throws + Extension LT (similar to a Hybrid B)
Day 6: “Bullpen” – Plyo Ball ® throws + Full LT + Bullpen (35 pitches)
Day 7: “Day After” – Light Catch out to 90 feet (similar to a Recovery Day)
Org. B – Await further information
Day 1: “60-90” – Catch Play out to 60-90 feet
Day 2: “120+” – Extension LT out to 120 feet
Day 3: Off
Day 4: “60-90” – Catch Play out to 60-90 feet
Day 5: “120+” – Extension LT out to 120 feet
Day 6: “60-90” – Catch Play out to 60-90 feet
Day 7: Off
We will cover options for dealing with a pitcher in organization A in this blog and the pitcher in organization B in the following blog.
Likely, most pitchers will land somewhere in between these two examples. These will serve as models of the impact of workload on pitchers’ abilities to return to in-game action while minimizing injury risk; however, each athlete should realistically be evaluated individually. A pitcher who is unable to throw much during this time will require more time than a pitcher on either of these example routines to prepare for the season during spring training, whereas a pitcher who is able to maintain a routine similar to in-season could conceivably be prepared sooner.
Another factor to consider is an individual pitcher’s routines—both on game day and between games. Do you throw Plyo Ball ®? If so, do you throw them every day or only some of the time? Are you a guy who prefers multiple bullpens to refine your arsenal? Would you be comfortable forgoing bullpens altogether and only throwing in games?
Org. A Starting Pitcher
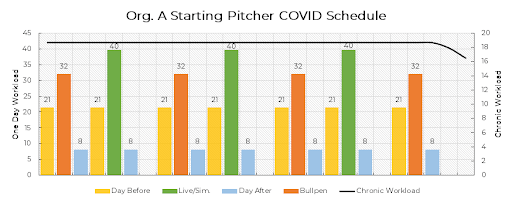
We will start by looking at a pitcher in Organization A. This pitcher has been given instructions to follow a schedule pretty similar to Spring Training. Twice a week they throw roughly 35 pitches on the mound—one session Live to hitters if possible. They may miss a few training sessions, but we’ll assume they are able to follow the prescribed throwing plan each week for the most part.
The chart above shows us the estimated one day workload for each day, as well as the corresponding chronic workload. In this scenario, it is assumed the athlete has been repeating the same program each week and workloads have not changed over a period greater than 28 days. Therefore, chronic workload is represented as being a static number – 18.7 workload units in this case.
Another element to consider is travel. In this simulation I allotted the athlete two days off of throwing completely. Some guys may not have missed a single beat, while others may have needed upwards of a week to sort things out.
If the season were to begin that day, this athlete would have accrued 18.7 workload units of chronic workload (black line on top of the graph). Between athletes, this number is mostly arbitrary, as each athlete will require a different amount of chronic workload based upon their individual pregame routines (Plyo Ball ®, Long Toss, etc.) and between-outing routines (one bullpen, two bullpens, etc.). Greater amounts of chronic workload do allow for larger one day workloads and subsequently larger acute workloads without placing the athlete at a potentially greater risk of injury (>ACR). After taking into account the two days of travel to return to spring training, the athlete has 16.5 workload units of chronic workload. 16 workload units does not mean much until we apply some context to it.
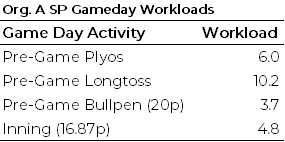
Based on the athlete’s previous throwing program and the average number of pitches thrown per inning in MLB last year (16.87), we can break up daily workload into more specific pieces, as seen below:
So we know the allotted workload for this specific athlete’s pregame routine. What now? Using these pregame workloads, we can calculate the resulting in-game workload and ultimately the number of innings the prescribed workload corresponds to. I determined this number of innings by first determining the number of “total pitches” the athlete could theoretically make. In this case, their in-game workload was determined as 1DWL minus their pregame workload. From there I made the determination that every 4.80224 workload units were equivalent to 1 inning—based upon the game day workload charts above.
In this example, warm-up pitches were not separately accounted for. When evaluating an individual pitcher, I would highly recommend making these determinations more specific (warm-up v. in-game, pregame long toss, pregame bullpen, etc.). For the sake of this blog, a rough estimate should certainly suffice.
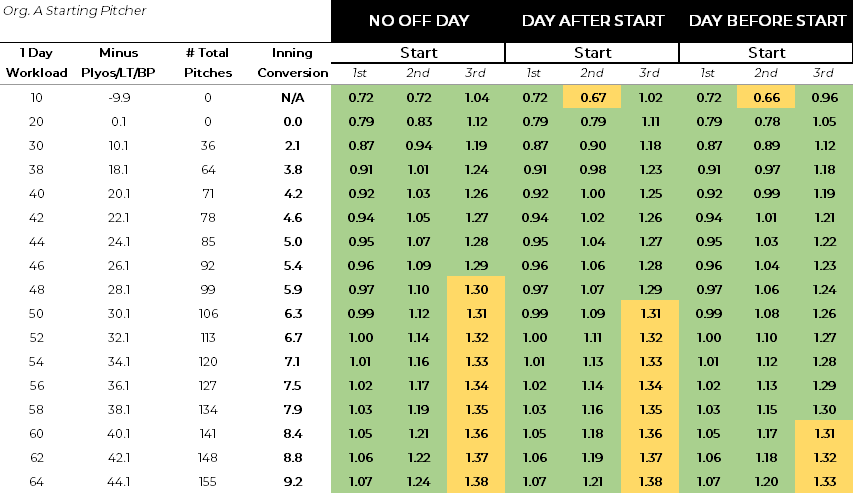
We can use the gameday workload chart above to evaluate the impact of various 1DWL on the number of in-game pitches. Using this chart, we can also see the resultant ACR for each of the first three starts.
If this pitcher was to make a start that day, while still maintaining a similar workload to what they have been following (ACR = 1.0), they would be prepared to have a 1DWL of 52 workload units (~6.7 innings). It is important to take into account the long term impacts of this as well. We need to account for the fact that this pitcher needs to be able to sustain that workload within a five-man rotation. Below are the standard between start routines we are basing these values off of. These workouts refer to the throwing program given out by the organization—this is why Day 5 is labeled “Day After” but is sometimes also the day before the start.
No Days Off
Day 1: Start Day Day 2: Day After Day 3: Day Before Day 4: Bullpen Day 5: Day After Day 6: Start Day
Day Off After Start
Day 1: Start Day Day 2: Off Day 3: Day Before Day 4: Bullpen Day 5: Day After Day 6: Start Day
Day Off Before Start
Day 1: Start Day Day 2: Day After Day 3: Day Before Day 4: Bullpen Day 5: Off Day 6: Start Day
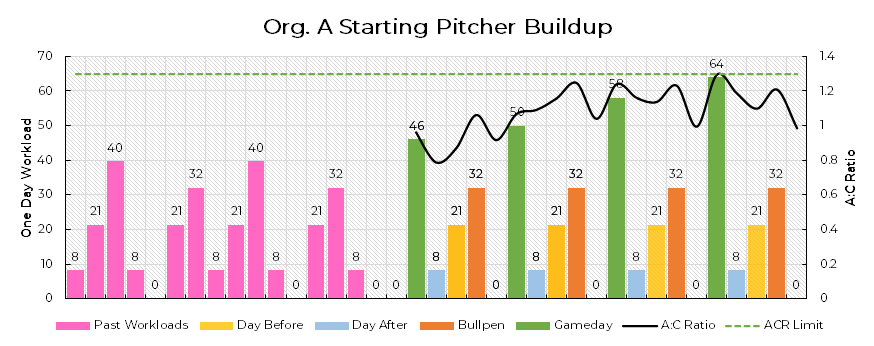
Looking at the gameday workload matrix again, we can see that while this pitcher could handle a slightly larger workload in the first start, the effect would be seen in the next two starts. A 1DWL of 52 workload units would give him an elevated ACR going into his third start (1.32). In other words, this pitcher could theoretically throw more innings on the first day, but this decision could set them back in terms of preparing to throw every sixth day.
An example of this outside of baseball would be to imagine you’ve been doing 3 sets of 8 reps of bench press for a few weeks. You could likely do 4-5 sets of 8 reps—but you are still going to be feeling it in a couple days when your normal 3 by 8 day comes back around.
For that reason we need to establish the highest workload this pitcher could withstand on Day 1 and also sustain every sixth day without their ACR rising above 1.3. While we mentioned previously that an ACR under 1.3 does not guarantee a change in injury risk, I would prefer to err on the side of caution following this period than being too aggressive. Using the gameday workload chart, we see that a 1DWL of 46 workload units would allow this athlete to make three consecutive starts of the same workload. Any higher 1DWL and this pitcher runs the risk of increasing their acute workload too quickly.
In this example, the athlete follows the schedule completely between each start, with consistent workloads for each workout type. Methods other than reducing the in-game workload are certainly available to mitigate these spikes in workload in real-life—giving a guy an extra day off, reducing the number of pitches in a bullpen, etc. The argument could certainly be made that these pregame workloads should be manipulated to maximize the in-game workload. In this case, we are assuming the athlete is set in stone with their pregame workload and we need to plan around that.

If we continue to progress in-game workload in a fairly linear fashion, by the fourth start this pitcher is able to handle a 1DWL of 64 workload units (~9.2 innings) and sustain that every sixth day. The highest ACR reached during this span is 1.29, following the first start with a 1DWL of 64. This means that the average one-day workload for the nine most current days was 29% greater than the average one-day workload over the past 28 days.
In a simulation such as this, it is impossible to predict exactly how many innings a given pitcher could throw each day/outing, and for that reason we are left to estimate innings based upon the average number of pitches in an inning across MLB. In reality, 30 pitches may get three innings—or it might not get you through one. These are all nuances of the game that must be adjusted/accounted for on the fly and why I highly encourage pitchers to monitor their own individual workloads following many of the same principles outlined in this blog.
Looking at the chronic workload, we see that during this buildup in 1DWL from 46 to 64 workload units, this pitcher’s chronic workload has increased from 18.7 to 21.0 workload units (an increase of 12.3%) over the span of 21 days. If this given pitcher were to continue with their current throwing routine and have a 1DWL of 64 workload units on their start day every sixth day, their chronic workload would peak at 25.9 workload units following each start.
This means that over the course of the previous 28 days, their average 1DWL would have been equal to 25.9. As we discussed previously, chronic workload is a measure of arm “fitness”. If you are able to consistently throw 100 pitches in a game versus only being able to consistently throw 30 pitches in a game, it is a fair assumption that you have greater levels of throwing fitness.
This chronic workload is much higher than any previously modeled². The reason for this difference is that the pregame workloads for this athlete were likely much larger than those previously mentioned. This is primarily due to the focus on performing Plyo Ball ® throws and Long Toss prior to any throwing on the mound. Given this information, it is important to note that the addition of a Plyo Ball ® and Long Toss routine in a pitcher’s throwing program may serve to increase their chronic workload over time, or general arm fitness, in turn increasing their capacity to handle higher in-game workloads. More research is needed to make any concrete determinations about the limits of chronic workload within baseball.
In order to linearly progress gameday workload in the quickest manner, an off day was present the day before the start. It is very likely that some pitchers simply will not be fond of the idea of not throwing the day before their start. Variables such as this should be taken into consideration when suggesting alterations or prescriptions to workload for an athlete.
In the scenario above, we operated under the assumption that this athlete would follow the traditional five-man rotation. In that case, it would take this athlete 21 days to make their first start with a one-day workload of 64 workload units and 27 days to make their second start of 70 workload units on normal rest. Given the shortened nature of this season, I wanted to investigate other options teams might have to get more in-game use out of their best arms.
Could we see a team use a four-man rotation? A six-man rotation?
If teams were to adopt a four-man rotation, it appears reasonable to assume that the between start routine would be fairly similar to the original one, with the subtraction of the “Day Before” throwing workout. Similar to the original five-man rotation, we will also compare varying off days as part of the between-start routine:
No Days Off
Day 1: Start Day Day 2: Day After Day 3: Bullpen Day 4: Day After Day 5: Start Day
Day Off After Start
Day 1: Start Day Day 2: Off Day 3: Bullpen Day 4: Day After Day 5: Start Day
Day Off Before Start
Day 1: Start Day Day 2: Day After Day 3: Bullpen Day 4: Off Day 5: Start Day
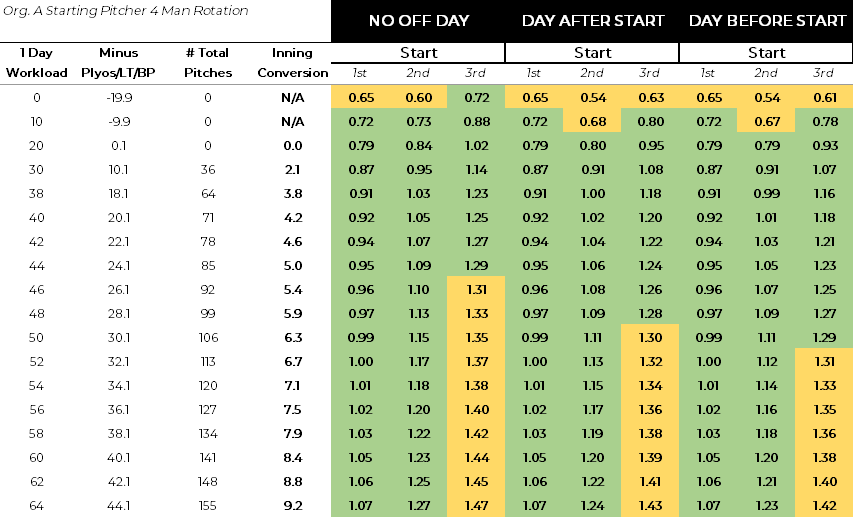
Again, we can develop a gameday workload matrix and evaluate the impact various 1DWLs would have on ACR following each of the athlete’s first three starts.
Just as in the original rotation, we see the athlete is able to have a 1DWL of 52 workload units and maintain an ACR of 1.0 following the first start. Due to the shortened rest between starts, this athlete is now only capable of having a 1DWL of 44 workload units without their ACR rising above 1.3 without the addition of an off day.
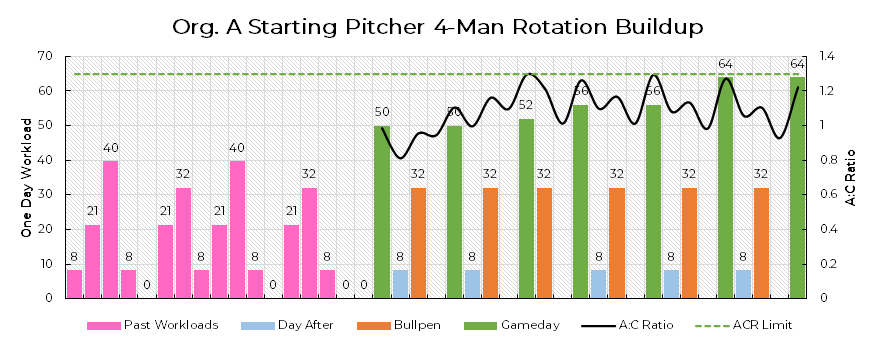
If we continue to progress in-game workload with an off day added before each start, by the fifth start this pitcher is able to handle a 1DWL of 56 workload units (~7.5 innings). By the seventh start, he is able to handle a 1DWL of 64 workload units (~9.2 innings) and sustain that workload every fifth day.
The highest ACR reached during this span is 1.29 following the third start. This means that the average one day workload for the nine most current days was 29% greater than the average one day workload over the past 28 days.
In the process of increasing start day 1DWL from 50 to 64 workload units, this pitcher’s chronic workload has increased from 18.7 to 24.1 workload units (an increase of 28.9%). Once this pitcher is consistently making starts with a 1DWL of 64 workload units every fifth day, their chronic workload would peak at 26.1 workload units following each of their starts. The four-man rotation actually results in roughly the same chronic workload than the typical rotation.
While it may take slightly longer to be able to sustain higher workloads with one less day of rest, the long term effect in chronic workload appears to be negligible. There are obviously some caveats to this but if you are able to have your best pitcher throw more often without taking on additional risk of injury, why wouldn’t you?
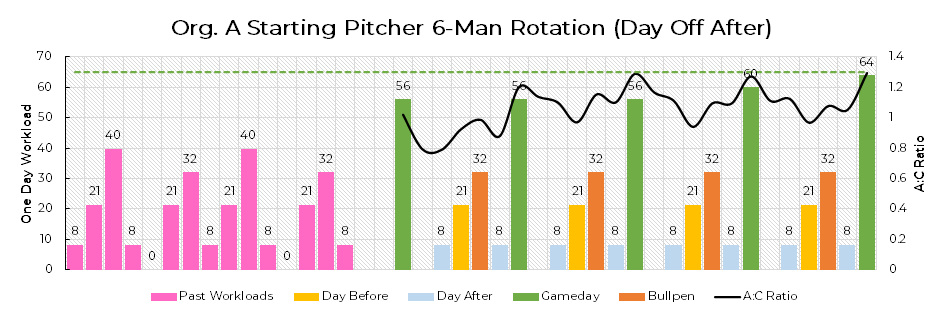
Another option teams could pursue is the use of a six-man rotation. This would give each pitcher an additional day of rest between starts. The thought process here is that this allows for greater workload on the pitcher’s start day, with the downside of less frequent appearances. If teams were to go this route, a plausible between-start routine would almost assuredly include an off day:
Off Day After Start
Day 1: Start Day Day 2: Off Day 3: Day After Day 4: Day Before Day 5: Bullpen Day 6: Day After Day 7: Start Day
Off Day Before Start
Day 1: Start Day Day 2: Off Day 3: Day After Day 4: Day Before Day 5: Bullpen Day 6: Day After Day 7: Start Day
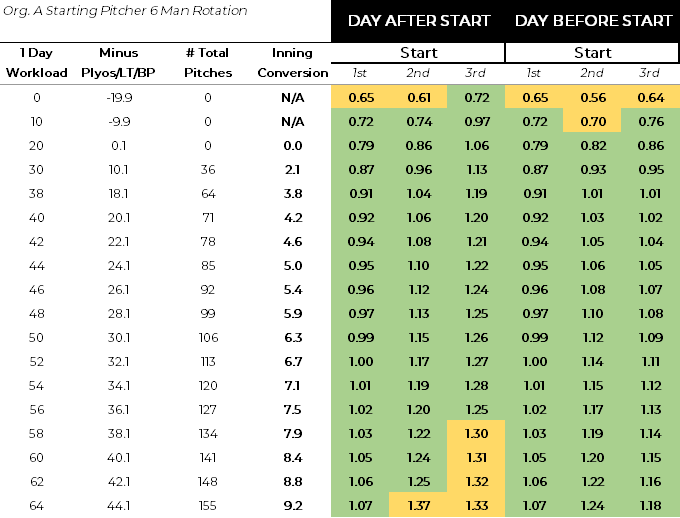
Looking again at the gameday workload matrix and resulting ACRs from the pitcher’s first three starts, we see the athlete is able to have a 1DWL of 54 workload units and maintain an ACR of 1.0 following the first start—just as in the other two scenarios. Due to the increased rest between starts, this athlete is now capable of having a 1DWL of 56 workload units without their ACR rising above 1.3 during the first three starts. A start day one day workload of 56 workload units equates to roughly 7.5 innings. As expected, this pitcher is now able to have higher one day workloads without seeing such large increases in ACR.
Just as in the previous scenarios, we need to progress this workload. If we place the off day before the start, this pitcher could theoretically handle a one day workload of 64 workload units and sustain it every seventh day immediately. Placing the off day directly after the start results in a more drawn out progression of workload.
In the process of increasing start day 1DWL from 56 to 64 workload units, this pitcher’s chronic workload has increased from 18.7 to 22.8 workload units (an increase of 21.9%). The chronic workload in this scenario is slightly lower than the previous scenarios despite reaching the same in-game workload. The trade off in this case is less frequent appearances in the game.
So, we have a rough idea of the amount of time necessary to build up this specific pitcher. We also know the subsequent workloads for each scenario and the estimated number of innings for each outing. With this information, we are able to compare the in-game usage between the three preceding scenarios during the first 31 days.
Number of Starts + Corresponding 1DWLs
- 5 Man Rotation: 7 starts
- No Days Off – 46, 46, 46, 56, 56, 64, 64
- Day After Start Off – 48, 48, 48, 54, 54, 64, 64
- Day Before Start Off – 58, 58, 58, 64, 64, 64, 64
- 4 Man Rotation: 8 starts
- No Days Off – 44, 44, 44, 50, 50, 50, 64, 64
- Day After Start Off – 48, 48, 50, 52, 52, 52, 64, 64
- Day Before Start Off – 50, 50, 52, 56, 56, 64, 64, 64
- 6 Man Rotation: 6 starts
- Day After Start Off – 56, 56, 56, 60, 64, 64
- Day Before Start Off – 64, 64, 64, 64, 64, 64
Number of Total Estimated Potential Innings
- 5 Man Rotation:
- No Days Off – 49.6 innings
- Day After Start Off – 50.3 innings
- Day Before Start Off – 60.5 innings
- 4 Man Rotation:
- No Days Off – 52.3 innings
- Day After Start Off – 56.6 innings
- Day Before Start Off – 61.9 innings
- 6 Man Rotation:
- Day After Start Off – 49.3 innings
- Day Before Start Off – 55.2 innings
The overall difference in estimated innings seems fairly small within the first 31 days in this example aside from the scenarios involving taking the day before the start off. If we were to extrapolate this out over a longer period of time, we would expect to see a larger difference between each of the groups. It is important to note as well that these are simply estimations of innings based upon the average in-game workload. Between outings, it is also unlikely that the same workloads would be achieved with the precision presented here. Implementing any strategy outside the norm would likely require someone to monitor and prescribe changes accordingly, while still allowing the athlete a good deal of autonomy. That said, if you were able to monitor and intensity, it does appear that there may be some benefit to having your top starters throw more frequently.
The Case for a Shorter Rotation
Having your best arms throw more frequently appears to be valuable, but how much value does it really bring to a team? According to Tony Wolfe of FanGraphs, the following teams would theoretically see the largest benefit in rotation WAR from a four-man rotation:
As Tony mentions in his blog post, each team would be impacted differently. If you have a deeper rotation then you stand to gain less from having your four best arms throw more frequently. However, if you are a team with a wide gap between the top and bottom of your rotation, then you likely need to sell out for having your best arms throw more often.
Tony notes that doubleheaders and injuries can further exacerbate issues in depth of a pitching staff when you are conceivably forced to throw your 7th or 8th best arm on a day. For some teams, that isn’t as much of an issue, but for others it’s the difference between making the playoffs or not during a shortened season.
In sum, if a pitcher were to come into the second iteration of spring training with a chronic workload of ~18 workload units as in this example, they would be prepared to throw in a game. The biggest limiting factor in terms of being completely ready for the season would likely be the frequency with which they have thrown high intensity or thrown to hitters. Given that they will likely have a few weeks to further prepare for the season and get accustomed to facing live hitters again, we can expect their initial workload capacity on opening day to be slightly higher.
In the event that pitchers are not prepared to throw 100+ pitches every sixth day by opening day, there is a question that each team will need to ask themselves: would you prefer to have your best arm throw more frequently and take the chance that they are able to stretch their pitch count across more innings or would you prefer to have your best arm prepared to throw more pitches within a single outing but run the risk that they get knocked out of the game early?
I personally believe that a shortened season should at least make teams consider forgoing the traditional five-man rotation in an attempt to have their best arms throw more frequently. The answer to that question is likely dependent upon each team (how deep is their pitching staff?) and each pitcher (what amount of chronic workload have they accrued? what is their preferred between-start routine?), but only time will tell.
Stay tuned for part 2
Written by Throwing Trainer Devin Rose
Comment section
Add a Comment
You must be logged in to post a comment.


Garrett Boyum -
Do you have a citation for this line? I am just curious as I’d like to look at that research.
“Previous research has shown that greater chronic workloads can allow athletes to make more throws in the short term as well.”
Driveline Baseball -
Garrett- the study referenced by that line is available here.