Developing More With Less: Does Efficiency in Player Development Lead to Success?
Can we accurately evaluate an organization’s ability to acquire and develop players relative to their competitors? In part one of our mini-series looking at the overall state of minor league player acquisition and development, we attempted to answer that question by building a database of over 8,000 minor league players in order to assess each organization’s ability to generate value. With dollar estimates of surplus value that controlled for player expenditure and expected talent levels for incoming players, we were able to identify industry leaders and laggards in player development. We were also able to quantify a preliminary estimate of monetary value realized by more progressive teams via a first mover’s advantage.
In this post, we build on our preliminary methods and analyses to examine how data-driven player acquisition and development contributes to a sustainable model of success at the major league level. Using our baseline estimates to generate more specific and reliable results, we evaluate the merits of unique team-building strategies and provide more realistic estimates of the surplus generated by each respective farm system in baseball.
Estimates > Anecdotes: Evaluating Farm Systems More Effectively
Heading into the 2015-2016 off-season, the San Diego Padres organization found themselves in a make-or-break situation. Having won 74 games the season prior with a roster built to “win-now,” the organization faced the difficult decision of choosing whether to stay the course or to rebuild internally.
The front office chose the latter, and invested heavily in amateur and minor league talent over the next few seasons. With $80M spent in International Free Agency, three top-ten picks, and a bevy of trades that netted them the likes of Fernando Tatís Jr., Chris Paddack, Francisco Mejía, and Anderson Espinoza, the Padres jumped from 25th to 1st in Baseball America’s Organizational Talent Rankings, constructing a rebuild that likely surpassed even the most optimistic of expectations.
While surely an organizational-wide effort, many of the public accolades given to the Padres for their successful rebuild were directed towards their player-development department, who transformed many young, talented athletes into some of the premier prospects in the game.
But, given the wealth of riches that San Diego’s player-development department were gifted, do we really know whether all of the praise they’ve received is justified? For every Luis Urías and Joey Lucchesi that has been signed and developed, a rival farm director can point to several expensive international signings in the Padres system who have not yet lived up to the billing. In considering the sheer investment in minor league talent that the Padres committed to the project, did they receive the value they expected, given what was spent?
Answering this type of question is not straightforward because there have been no publicly available resources to date that have analyzed an organization’s farm system while controlling for player expenditure. As a result, fans, coaches, and even team executives have leaned on anecdotal examples of the successes and failures of different players to develop opinions on whether a team has been efficient at signing and developing young talent.
Fortunately, our Value Generated metric (introduced in part one of our mini-series) provides a solution to this issue by controlling for expected value acquired by a given farm system. Uninfluenced by the various investment strategies of teams or the subjective opinions of insiders, our metric not only provides a valuable KPI to MLB organizations, but also allows us to investigate the merits of different spending strategies used in building MLB rosters.
Who Has Developed the Most Value in the Minors?
With most of the work already done for us, our Value Generated estimates for each organization are provided below. As highlighted in part one, organizations with strong reputations in amateur scouting and player development—such as the Astros, Dodgers, and Cardinals—have realized approximately $350M to $450M in surplus value over the past seven seasons. In contrast, teams with more traditional approaches to player acquisition and development have incurred approximately $175M to $350M losses within the same time span.
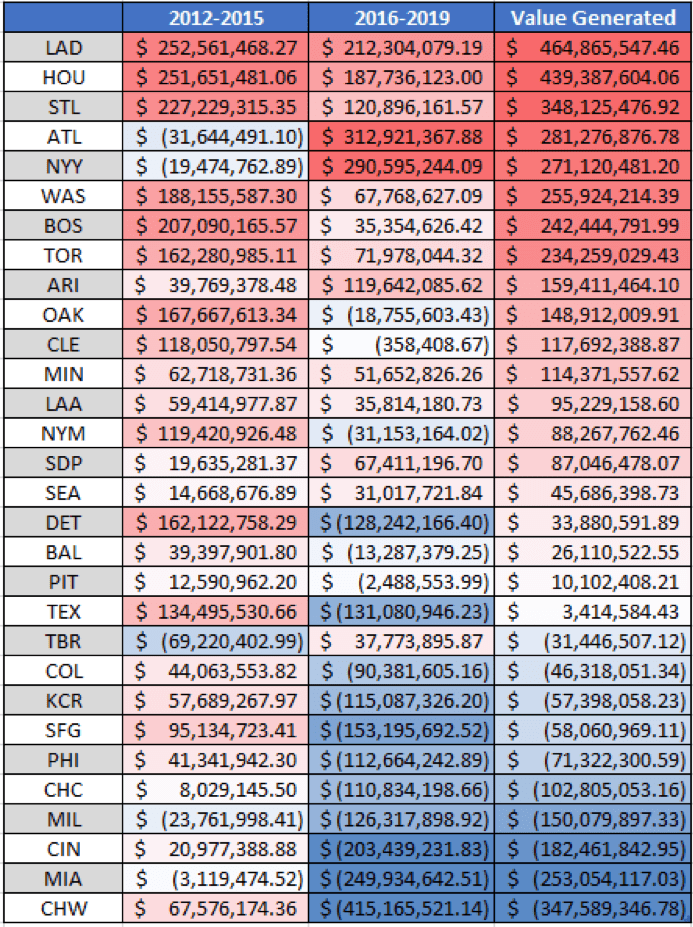
(By splitting the results into subsets of 3-4 year buckets, we see how some teams like the Braves, Rays, Yankees, and Padres have trended upwards in recent years, whereas the Tigers, Rangers, Giants, and White Sox have had little success in acquiring and developing talent in the minors since 2016.)
With a staggering difference in surplus value realized between leaders and laggards, we see that the organizations toward the top of our leaderboard have maintained a consistent advantage in developing talent over the past seven seasons, while the gap between the lower performing teams and league average has widened as prospects within our sample progress to full maturation.
Who Develops More Value With Fewer Opportunities?
Equipped with our metric, we wanted to first address how farm-system rankings can be influenced by both total expenditure in minor league players and efficiency in acquisition and development. This analysis allows us to decipher the following:
- whether some organizations develop better players with less resources available while other organizations struggle to realize any ROI on highly touted prospects
- whether some teams are able to leverage their abilities of generating surplus value in the minors by continuously investing in young talent
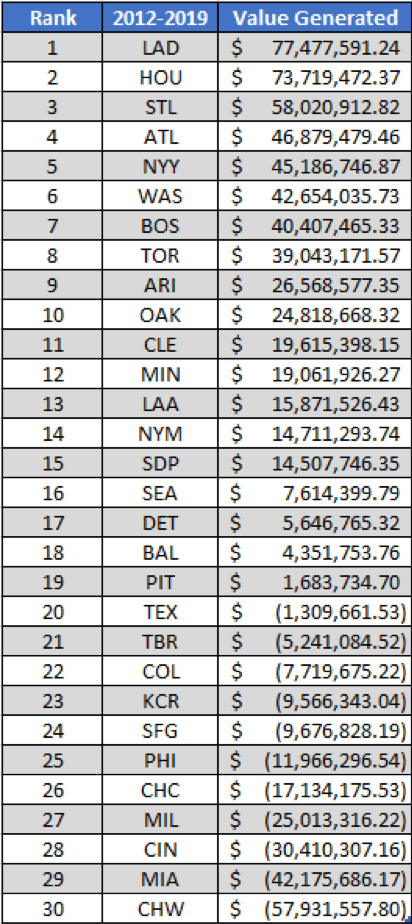
In returning to our Padres example from above, we expect that the organization would score well in Value Generated, particularly since 2016, but see that they ranked 15th in Value Generated since 2012 and 9th overall since the start of their rebuild. In the Padres having the number-one farm system in baseball, we have evidence supporting the idea that some combination of both above-average player acquisition/development and heavy investment in prospects played a significant role in boosting their farm system to the top of the rankings.
Applying this analysis to the other 29 teams, we can further leverage the most recent Baseball America (BA) Talent Rankings to identify which organizations have invested heavily in minor league players but have still fallen short in producing homegrown value and which organizations have continued to generate surplus value, albeit with limited opportunities.
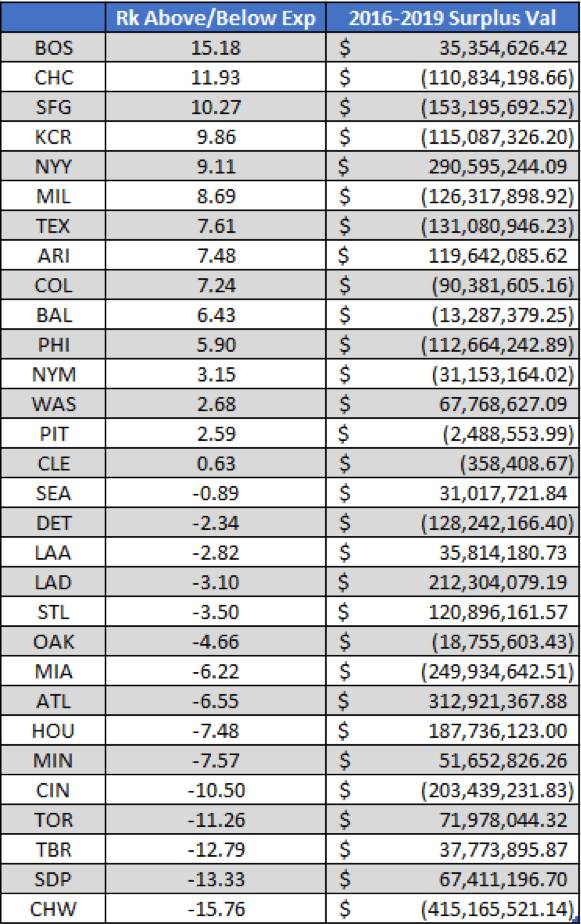
(This table uses our Value Generated metric to obtain the difference between expected and actual 2019 BA Talent Ranking. We see that the White Sox, Padres, and Rays have talented farm systems without an exceptional amount of Value Generated, indicating that they have likely made a sizeable investment in MiLB talent during recent years. Meanwhile, the Red Sox, Cubs, and Giants have poorly rated farm systems that have likely resulted from low investment and/or poor Value Generated in recent years.)
In using a simple linear translation of 2016–2019 Value Generated to 2019 BA Talent Rankings (a Spearman’s rank correlation of .41 was found between the two), we observe some interesting takeaways. First, organizations ranked towards the bottom of our Value Generated metric—such as the Reds, White Sox, and Marlins—all received BA Talent Rankings that were 6-16 spots ahead of where we would expect, given their ability to generate value at the minor league level. Using this to conclude that each organization has invested heavily in young talent but has received relatively little value in return, we can see that constructing a home-grown competitive roster now likely requires both efficiency in player acquisition/development and heavy investment, rather than just the latter.
In an effort to address the former, both the Reds and White Sox have recently made several changes to advance the state of their player development and maximize the most out of their recently acquired young talent. However, only time will tell if these changes will improve both teams’ standing in our Value Generated rankings over the next few seasons.
On the opposite side of the spectrum, organizations found at the top of our list of Value Generated that have received a worse BA ranking than expected—such as the Red Sox, Yankees, Nationals—have been able to supplement their organizations with significant surplus value in the minor leagues, despite having “win-now” rosters. Even when considering market size, it is likely no coincidence that these organizations have had sustained success at the MLB level over the duration of our sample, given that they’ve been able to provide their big league team with cost-controlled talent or trade capital for postseason runs.
Last, we also observe a handful of organizations—like the Cardinals, Dodgers, and Astros—who have developed superior Value Generated estimates relative to their peers and a better farm-system ranking than expected. Likely blending a strategy of continuous investment in prospects with superior scouting and player-development modalities, these organizations have seemingly developed a sustainable model of success for both present and future outcomes at the major league level.
Does Efficiency in Development Lead to Success?
Having demonstrated that an organization’s respective BA Organizational Talent Ranking is a function of both efficiency in acquiring and developing talent and overall investment in prospects, we wanted to quantify just how important Value Generated is in making a significant impact on the overall success and long-term health of an organization.
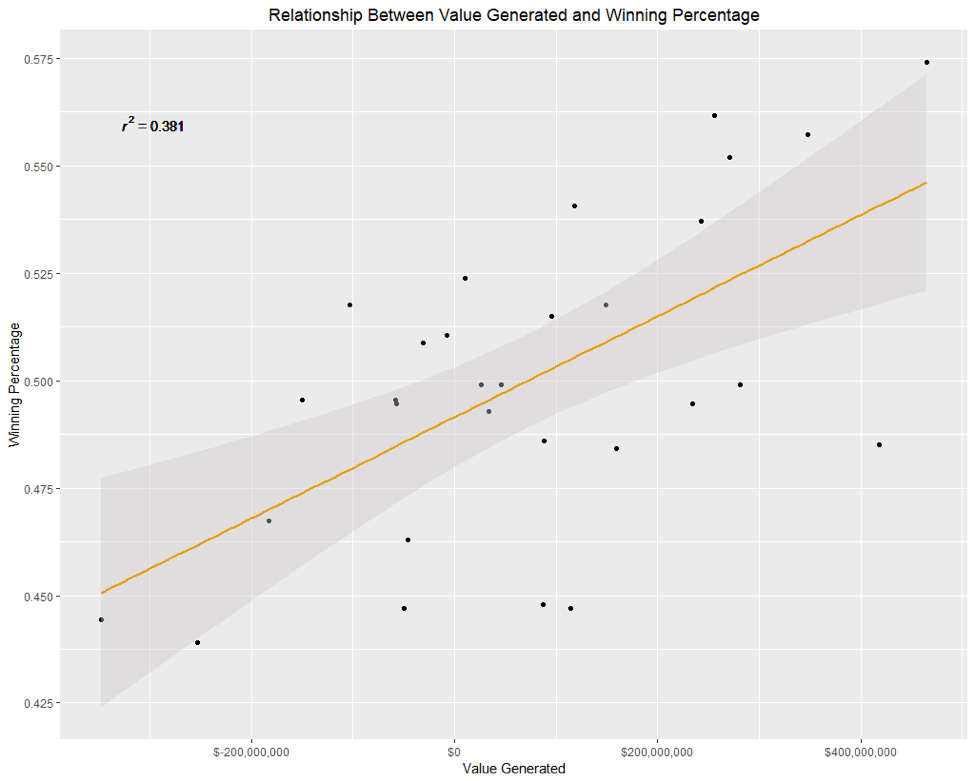
To examine this, we calculated the correlation between winning percentage and Value Generated over the past seven seasons. We found a fairly robust correlation coefficient of .62. As shown below, some teams can outperform expectations with shrewd pickups, large budgets, luck, or aging cores. However, for most teams, getting surplus value from their farm system above expectations is a prerequisite to maintaining consistent success over an extended period of time.
To gain a sense of the savviest teams in the free-agent market and/or other means of player acquisition, we extrapolated our Value Generated metric into an expected winning percentage over the past seven seasons. This allowed us to find the difference between actual and expected average-win totals by season in order to see how much each organization outperforms expectations over time.
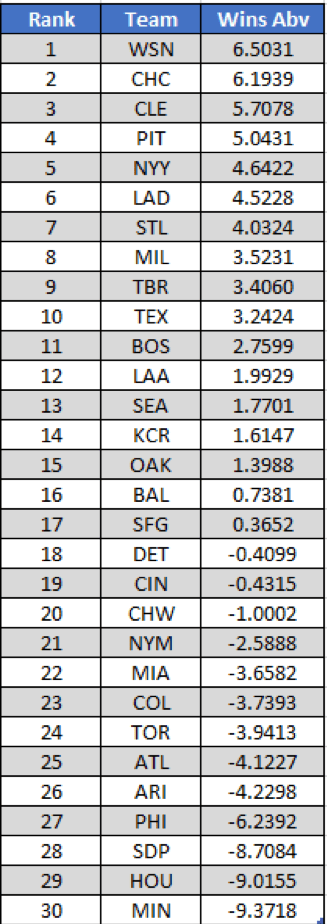
We see that our new leaderboard is biased in favor of large markets and teams that were built to win before the prospects in our sample fully matured. That said, there are also creative small-market value shoppers—such as Pittsburgh, Milwaukee, and Tampa Bay—who score really well by this metric.
At the bottom of the list, we see teams like the Twins and Diamondbacks—who developed strong cores over the mid 2010s, but failed to put the pieces together to build a contender—as well as the Phillies and Blue Jays, who exchanged a large amount of prospect capital to extend competitive windows in a non-sustainable manner. Other organizations found at the bottom of the list above—such as Houston, San Diego, and Atlanta—spent a large portion of the 2010s rebuilding their MLB roster from the bottom up and are now reaping the benefits moving forward.
Do Some Teams Specialize in Developing Position Players or Pitchers?
With confidence that our metric measures something related to past performance, we divided our results into buckets of position players and pitchers to further identify whether some teams have specifically struggled or excelled in developing bats or arms.
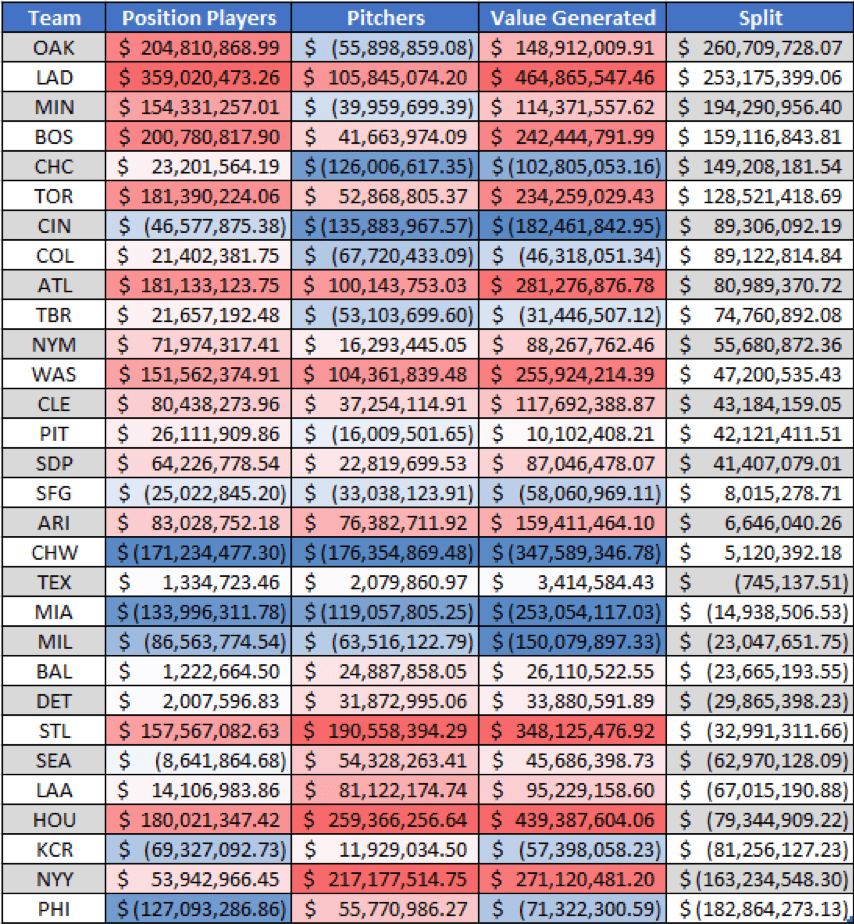
In looking at the table above, we observe some interesting outliers that align closely with our expectations. For example, our results show that Boston, Minnesota, and Oakland have had much greater success in developing hitters compared to pitchers, whereas the opposite holds true for teams like the Royals, Yankees, and Phillies.
Beyond just splits, we also can quantify observations made by other fans and analysts regarding an organization’s ability to develop a specific type of prospect. For instance, it has been well documented that the Cubs have struggled mightily to develop any pitching over the past seven years, and our Value Generated metric estimates that they have lost $126M in expected value on pitching prospects during that time frame. Meanwhile, the Astros and Yankees, who have each received high praise for integrating advanced technologies into their pitching programs, have each realized over a $200M profit in pitchers during the same window.
Can We Isolate Player Development From Scouting?
Since amateur scouting and analytics departments also play a significant role in supplying player-development departments with athletes who are above or below expected talent upon arrival, we wanted to develop a method for analyzing player-development departments in isolation. To do so, we looked at how well certain organizations have influenced the FV’s of prospects they exchanged from other organizations via trades.
For our analysis, we assumed that any change in FV for a prospect within one year of being traded was caused by switching from one organization to another. As a result, a team would be rewarded for improving the FV of an incoming player within one year of arrival, whereas the other team would be punished by an equal amount.
For example, when Alex Jackson was traded from the Mariners to the Braves heading into the 2017 season, the Braves were able to boost his FV from a 40 to a 45 during his first year with the organization. Based on Jackson’s immediate improvement, our methods credited the Braves player-development department with $5.9M in Value Generated and debited the Mariners player-development department $5.9M in Value Generated.
Since this analysis is a zero-sum game with diminished sample sizes, some teams will benefit from trading players to organizations with worse player-development departments, whereas other teams may fall victim to random variation or trading valuable pieces before maturation. Therefore, we have to take these results in context rather than strictly at face value.
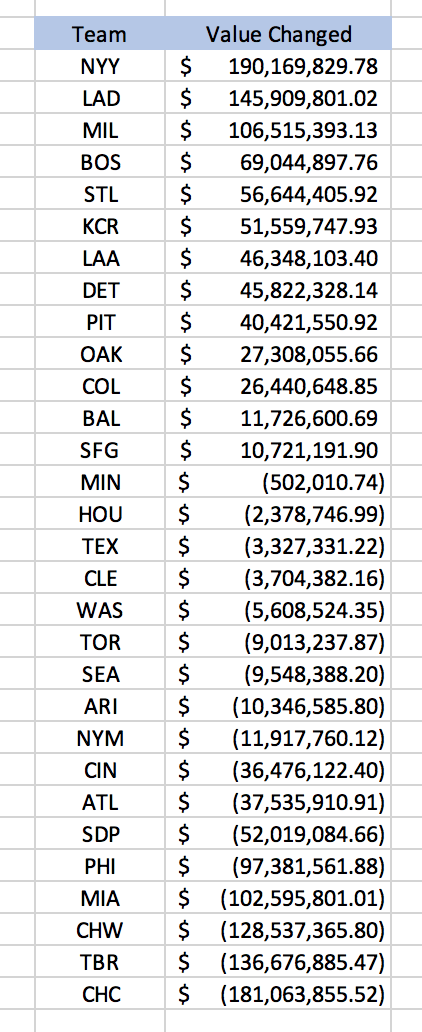
In looking at the table above, we see the Yankees, Dodgers, and Brewers have excelled at either selling high on certain prospects, targeting and developing lesser known prospects from other organizations, or trading with the right teams at the right time. In contrast, the Cubs, Rays, and White Sox have taken particularly strong hits in recent trades, with the Cubs losing Eloy Jiménez, the Rays failing to accrue much value out of their recent acquisitions in the upper levels of the minors, and the White Sox taking significant hits on the Adam Eaton, James Shields, and Chris Sale swaps.
These Metrics Are Descriptive, But Are They Reliable?
A main concern outlined in the beginning of our initial post that still needs to be addressed is whether credit can accurately be attributed to a respective organization for the various prospect outcomes it realizes. Perhaps our Value Generated metric is simply identifying the random luck that each organization has been exposed to over the course of the past seven years and is not a reflection of an organization’s ability to acquire and develop quality MLB caliber players.
For example, although the White Sox are docked heavily in our analysis for not getting expected value out of the Adam Eaton trade, one could reason that Baseball America was a bit high on the likes of Lucas Giolito or Reynaldo López at the time of the trade compared to the rest of the industry. The public widely regarded the deal as a coup for the White Sox, but the White Sox could very well have had lower internal grades on both of the aforementioned players received and still valued that package as the best opportunity to improve their organization. As a result, our model would punish the White Sox too severely due to a lack information.
Since we do not have access to all of the details on certain transactions, interactions, or developmental plans for specific players, we cannot fairly attribute 100% of the observed credit of Value Generated to each individual team and must regress these values.
To do so, we take each team’s Value Generated on a yearly basis and calculate the reliability in our entire sample. Using the Spearman-Brown prediction formula, we find that the threshold needed to explain half the variance in our Value Generated metric is approximately 35 years, so we regress our raw values to $0 by 83.33% to account for this uncertainty.
As you can see from this table, there is still a significant amount of value generated between the best and worst organizations, despite a heavy amount of regression baked into our final estimates.
While these newer estimates of Value Generated are probably closer to the true monetary advantage that the best organizations have realized since 2012, it is also likely that these estimates are slightly too conservative given that we regressed every organization to $0 and limited each organization to only 30 minor league prospects of value per year via The Baseball America Handbook.
These methods artificially suppress our reported numbers because we know that specific organizations (particularly at the higher end of our chart) prioritize and outspend their competitors in player development by a significant margin and that they also have more than 30 players of value in the minors. As a result, organizations such as the Astros and Dodgers should have more optimistic reported estimates of Value Generated that are regressed to a higher dollar amount, relative to their peers.
As proof of this concept, competitors towards the bottom of our list—such as the Phillies, Giants, and Rangers—have all adopted significant changes within their player-development departments that align more closely with the trendsetters in the industry. In our opinion, this indicates that there were clear competitive advantages in player development realized by the Astros and Dodgers during the years in question that should be accounted for.
However, since we are constrained by the information available and want to avoid adding additional assumptions or estimates of value generated, we elected not to adjust our final values to account for these limitations. Instead, we report a conservative $135.4M difference between the best and worst organizations in MLB at acquiring and developing talent for players entering affiliate baseball after January 1, 2012.
Main Takeaways
Despite the uncertainty and chance that has always been a part of analyzing prospects, our analysis finds strong evidence that heavy investment into progressive means of player acquisition and development has provided early adopters, such as the Dodgers and Astros, with a massive competitive advantage over the rest of the league over the past seven seasons.
As teams grasp this and rapidly attempt to catch up, we can’t help but feel cautiously optimistic for the future of baseball. As players are taught to swing with more efficient swing planes, throw with better secondary pitches, and train with modalities that are actually proven to improve performance, the quality of play and the outcomes of the most talented players will surely improve.
This does not mean that there will not be any bumps in the road along the pathway to optimization. Top prospects will still fail to make it to the big leagues, amateur players will continue to be mis-evaluated, and certain developmental plans will still be ineffective—this is inevitable.
However, it is (and always has been) our position that we can put our players and coaches in the best possible position to mitigate these negative outcomes .
So, as we push ahead towards the 2019 season and beyond, this analysis shows us that the question worth answering is no longer a matter of if data-driven player acquisition and development can lead to more efficient outcomes: it is a matter of how.
As the gap inevitably closes between the best and worst organizations at developing talent, some will find a way to move ahead of the curve and some will fall even further behind. Regardless of where each team ends up finishing in the race to catch the likes of the Astros and Dodgers, it seems clear that it will be worth every penny for them to try and catch up.
Written by Sabermetrics Analyst Dan Aucoin
Comment section
Add a Comment
You must be logged in to post a comment.
Joe -
Can’t believe no one has commented yet. This article is fantastic! As a Pirates fan, I came here for hope? Maybe they’re doing something right? I don’t think they are w/ regards to talent acquisition, though. Oneil Cruz is an interesting case of increasing the value of an asset received in a trade, but I don’t know how much of that came from instruction over it just clicking for him.
Anyway, keep these coming. I’m fascinated w/ talent development and this was a phenomenal read.
ALEXANDRO -
whats experience . amazing course . recommended full !!!!! thanks Driveline . the best