Is Finding a Star Nothing But Luck?: Quantifying the Effectiveness of MLB Player Development

As we’ve continued along with The Business Case For Player Development Series, we’ve attempted to evaluate and analyze specific subcomponents of player development in today’s rapidly changing landscape. These micro-level analyses have been useful in identifying the cost of inefficiencies that still occur within player development; however, they have also been limited when attempting to extrapolate these findings on an industry-wide perspective.
In this mini-series, we attempt to expand our focus to analyze the overall state of player development over the past seven years. More specifically, we attempt to quantify each organization’s respective ability to acquire and develop young talent within the minor leagues. These outputs will give us insight into how important a highly functioning player-development department is to win at the MLB level and extend a competitive window years into the future.
This blog post outlines the details and methods behind the creation of our estimates, as well as provides some initial findings. A subsequent post will take a deeper dive into our results and provide some key takeaways for the industry moving forward.
Is Finding a Star Nothing But Luck?
Just past the halfway mark of the 2008 season, the Milwaukee Brewers were coming off a winning streak that moved them up to second place in the NL Central. Motivated to make the playoffs for the first time in 26 years, Milwaukee’s front office orchestrated one of the most famous mid-season deals of all-time, netting CC Sabathia for Matt Laporta, Zach Jackson, Rob Bryson, and a player to be named later.
Sabathia went on a historic second half run that led Milwaukee to a coveted playoff berth, whereas Laporta, the twenty-third ranked prospect by Baseball America at the time, sputtered shortly after switching organizations.
Luckily for Cleveland, the fine print of this deal contained a gentleman’s agreement stipulating that if Milwaukee made the playoffs, Cleveland would get the option of choosing between Michael Brantley or Taylor Green as the final player exchanged in the trade.
With the Brewers clinching the wild card on the last day of the 2008 season, Cleveland took up the opportunity to choose Brantley, who went on to amass 19.7 fWAR before leaving in free agency eleven seasons later.
As it stands, the trade perfectly illustrates how good scouting, good player development, and a massive amount of luck can make a significant impact on the successes and failures of an organization. For all the praise owed to the Indians for identifying, acquiring, and developing a mid-tier prospect into an All Star, there was an equal amount of criticism due for missing on Laporta, Jackson, and Bryson.
This is one of the challenges in evaluating the outcomes of different players within a given organization: there is no telling who deserves credit for the positive or negative, or whether there is any credit worthy of being distributed at all beyond pure chance.
However, as challenging as evaluating a scouting department or a player development department may be, we believe quantifying player acquisition and development is still a worthwhile analysis to undertake. Beyond potentially helping us identify whether continual increased spending on player development is a sensible investment for teams, a robust examination can also provide us with insight into whether one organization can identify and nurture a player to the big leagues with greater success than another, considering all else equal.
Is identifying and developing young baseball players into productive big leaguers an organizational skill? Or are farm system returns merely driven by variance?
With a sample of minor league players large enough to sift through the noise, we find evidence that some organizations are indeed better suited to acquire and develop prospects of equal talent. These organizations, led by heavy investors and early adopters of progressive means of player development, have been able to extract massive amounts surplus value over their competitors during the past seven seasons.
Acquiring Yearly Prospect Grades
To obtain accurate estimates of an organization’s ability to identify and develop a player, we set out to build a large enough dataset of recently acquired minor league players that allowed us to perform the following tasks:
1) Generate an expected NPV via Future Value (FV) for every minor league player entering professional baseball to control for organizations that have a greater opportunity to acquire higher caliber amateur prospects.
2) Map changes in expected NPV via FV for every minor league player on a yearly basis to control for minor league players who switch teams via trades.
3) Estimate an expected NPV for each player graduating to the MLB level to quantify the end product of a player development department.
In order to satisfy these three goals, we first needed to find a reliable source of prospect grades that went far enough back in time and could be translated into dollars on a yearly basis. Fortunately, the The Baseball America Prospect Handbook has been grading a significant number of prospects (900) using the 20-80 scale on a per year basis since 2012, providing us with enough information to get started.
Angels Top prospect Jaime Barria beat the Rangers in his MLB debut Wednesday night.
Back in our 2017 Prospect Handbook, were especially impressed with his changeup pic.twitter.com/cYLiKKsdGH
— Baseball America (@BaseballAmerica) April 12, 2018
However, upon acquiring the aforementioned handbook, some heavy lifting was needed in order for us to use the data. First, Baseball America’s (BA) Prospect Handbook grades are only available in print, so we had to manually enter 2,700 prospect names, grades, and risk factors into a spreadsheet. Second, although Baseball America’s grades are published on the familiar 20-80 scale, their methods of assigning a prospect grade to a player are based on a “Realistic Ceiling” and “Risk Factor” calculation, rather than a traditional FV grade from which our NPV estimates are derived. As a result, we needed to adjust our BA grades to better align with our own fitted estimates of prospect value. To do this, we deducted 5 points from the Realistic Ceiling of every “High” risk profile prospect and 10 points from the Realistic Ceiling of every “Very High” and “Extreme” risk profile prospect.
To validate these conversions, we first looked at how many prospects had a higher adjusted grade than the prospect ranked above them (per BA) within a given organization. We found that out of 2,700 prospects within our sample, only 159 were out of order relative to their respective ranking.
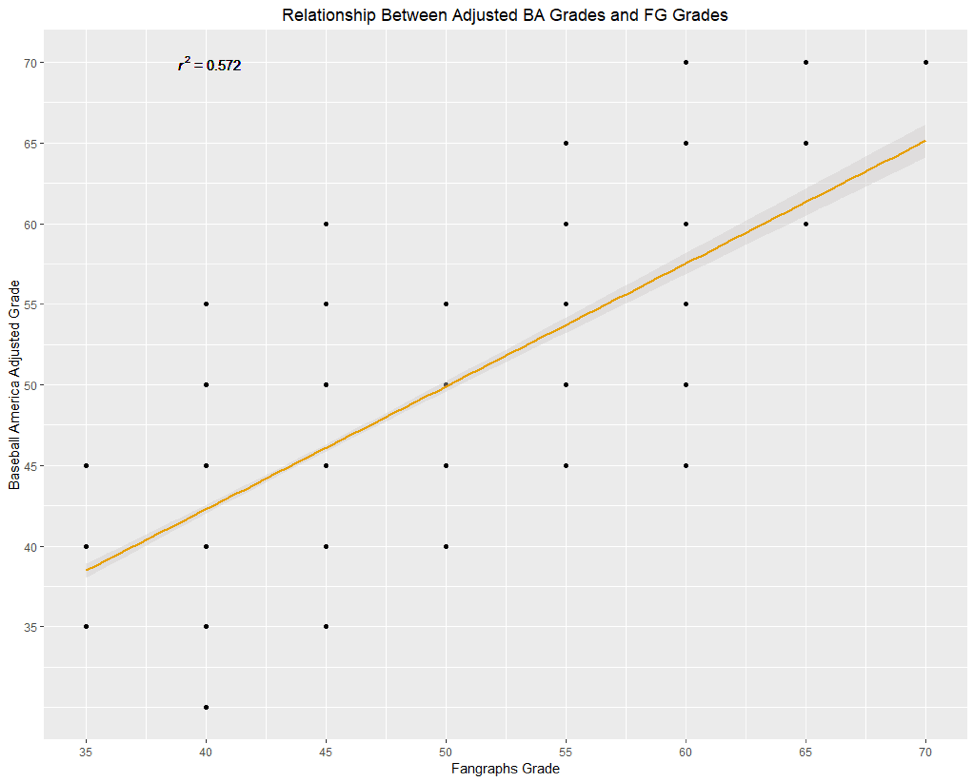
With confidence that our prospect grades were accurate, we then matched our adjusted BA grades to Fangraphs’ “THEBOARD!” FV grades for the 1,092 prospects graded by both outlets from the 2017 season onwards.
As shown above, we obtained an R^2 value of .57 when comparing the two sets of prospect lists, with our adjusted BA grades coming in roughly 1.3 points higher than Fangraphs, on average, over every paired prospect in the sample. Of the 1,092 prospects in our sample, only 54 players had larger than a half-grade discrepancy between the two resources.
We interpreted these results as an indication that many of the discrepancies in prospect grades between the two resources were likely due to a difference in opinion, rather than an unreasonable grade adjustment on our part. Thus, we were comfortable using our adjusted BA grades for the remainder of our analysis.
Extending Our Database to All Minor Leaguers
With yearly prospect grades available to us for all relevant prospects from 2013 through 2019, we then set out to expand our database to include all minor leaguers and their respective signing bonuses received (with the exception of international free agents who signed at 25 years or older or those who started their professional career in AA or higher). As we explain a bit later, this data allowed us to generate a proxy of expected FV for every minor league prospect, as driven by the market, before they put on an affiliated uniform.
While obtaining signing-bonus data for every drafted player since 2012 was relatively straightforward, using publicly available resources to acquire every international free agent’s signing bonus was extremely challenging. To overcome these difficulties, we used a blend of resources including Baseball America, Sportrac, MLB.com, and The Baseball Cube to fill in as many values as possible.
(Note that we have more lenient requirements for Cuban-born players being included in our sample, which explains the discrepancy in dollars spent during 2015.)
In comparing the bonuses of international free agents (IFAs) within our database to Fangraphs fully populated dataset, we found that we were able to obtain information on roughly 24% of all international free agent signings from 2012 through 2017. While disappointing, our database still accounted for roughly 76% of all MLB IFA bonus expenditure during that time period, as well as every prospect graded 45 FV or higher by BA since 2012.
So, although we may be missing the vast majority of signings for $100,000 or less, we do have data on the vast majority of significant signings in a given season and every high-level prospect since 2012, which supplements the main focus of our analysis.
Translating Bonuses to Future Values
With this more complete dataset at our disposal, we obtained amateur FV grades from Fangraphs’ “THE BOARD” for every available prospect prior to their respective Rule 4 draft or July 2 signing window.
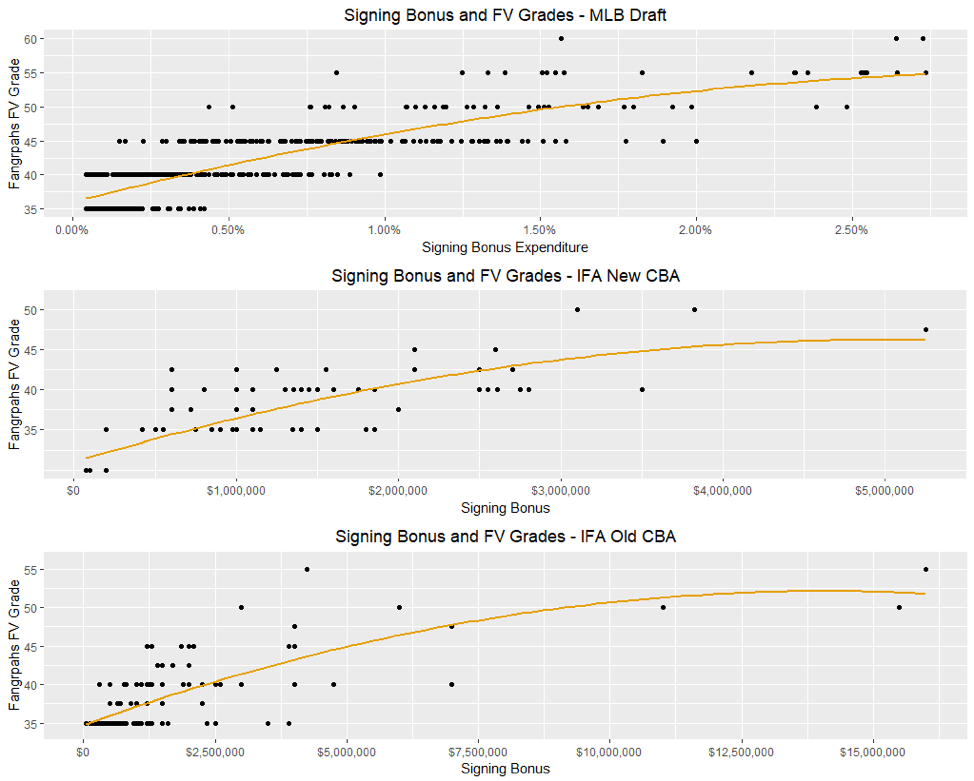
We then used our previously obtained signing-bonus data to generate three separate second order polynomials to predict FV grades for every prospect in our dataset based on when they were acquired, how they were acquired, and how much signing-bonus money they received.
Our first polynomial was built off of the 545 domestic amateur prospects graded by Fangraphs from 2015 through 2018. While this sample spans across two separate CBAs in which slot allotments towards the top end of the draft changed by a significant amount, we found insignificant differences in our results when splitting the players before and after the ratification of the new CBA. As a result, we elected to keep our sample together when building our regression.
To control for inflation, we normalized each player’s bonus total to be a proportion of all bonuses spent within each player’s respective draft. For example, in 2012, Carlos Correa received a $4.8M signing bonus that accounted for 2.45% of all bonus money spent during the 2012 draft, whereas in 2018, Joey Bart received $7.025M bonus that only accounted for 2.38% of all bonus money spent during the 2018 draft. Thus, as it relates to our model, Correa would actually be considered the more expensive acquisition compared to Bart, despite receiving an absolute bonus that was $2.2M cheaper.
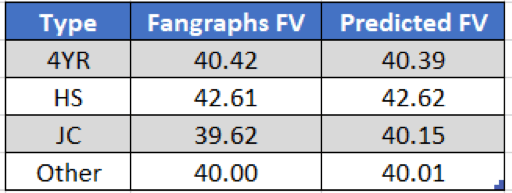
Beyond just bonus money, we also considered a player’s pick number and whether he was a HS, 4YR, or JUCO product; however, none of these contextual factors added any significant predictive power to the model once bonus money was accounted for.
Our second and third polynomials were built using a split sample of 173 international free agents (IFA) graded from Fangraphs from 2015 through 2018. The splitting of the sample was designed to account for the wildly changing spending habits of teams due to the imposed limits on expenditure after the most recent CBA was ratified.
Controls were added to account for nation of origin; however, that information provided no significant predictive power to our model despite there being slight evidence of a premium on Cuban players within our sample, talent being held equal.
(The large signing bonuses of Cuban players seem to suppress the Predicted FV for IFAs from other major countries by a slight margin.)
Once values were fit to each prospect in our larger database, we chose to adjust for the super inflation that occurred in 2015 and 2016 due to impending spending limits by multiplying the 2012–2014 IFA class’ signing bonuses by 1.5. After this adjustment, the number of prospects with a fitted grade of 40 FV or higher for each respective IFA class are shown below.
(Our model was unable to handle Moncada’s signing bonus, so we manually assigned him a 60 grade upon signing.)
With fitted FV estimates for all players within our database, we rounded each value to the closest traditional grade in order to obtain an expected NPV for each prospect upon entering affiliated baseball.
For international players, any prospect that signed for under $250,000, after controlling for inflation, was designated as a non-prospect and received an NPV of $0. For domestic players, any prospect that signed for under $125,000 in 2017/2018 and $100,000 in 2012–2016 was also designated as a non-prospect and received an NPV of $0.
These constraints, while somewhat arbitrary, classified roughly 55% of all acquired prospects per year in our database as non-prospects. Since prior analysis has found that roughly 75%-80% of affiliated prospects are considered non-prospects, this figure was designed to accommodate the roughly 500-700 IFA non-prospects that were missing from our dataset on a per year basis.
(A snapshot of the first 10 picks of 2016 in our DB)
Graduating to the Big Leagues
With a database containing expected NPV estimates and year-to-year changes in NPV for the vast majority of minor league players acquired since 2012, the final step in our methods was to account for prospects graduating to the MLB level.
Evaluating graduated prospects proved to be a more difficult task than initially perceived, as players who have reached the big leagues in our sample have not yet fulfilled their full 6+ years of club control. Making matters more challenging, publicly available multi-year projections of WAR tend to be unreliable and have relatively large disagreements on player evaluations.
As a result, we decided to go one by one and manually grade each graduated player based on his age, 2019 projected WAR, and previous MLB production.
Since these values comprise much of the value teams have generated over the past seven seasons, we wanted to be as transparent as possible. Thus, we have made all subjective grades used in this analysis available via the link provided here. Along with all of our MLB grades, you will also see a tab that instructs you on how to adjust each team’s final results for Value Generated, if you have any strong disagreements with our grading system. For example, if you believe that Kyle Freeland should have been a 60 FV upon graduating the big leagues, the link above provides you with the means to adjust the Rockies final values as you see necessary.
Beyond discrepancies in subjective grading, the tool linked above also allows you to adjust our final estimates of Value Generated based on hypothetical scenarios of an athlete’s development. For example, if you believe that Carlos Rodon would have been a 2.5 WAR player had he integrated his CH more effectively into his repertoire, you can adjust his final FV to a 55 and recalculate Chicago’s final values to account for this.
(A snapshot of the top 10 signees of the 2014 draft with MLB grades highlighted in gold)
Once a player relinquished prospect status, their MLB FV grade remained constant for the remaining duration of his career unless he switched organizations, established himself as an MiLB player again, and then proceeded to demonstrate a significantly different talent level upon reaching the Major Leagues with his new organization. In these specific cases, we wanted to credit the respective player development department that significantly improved a player’s overall talent level while the player was under their umbrella.
This exception was used sparsely, but it did allow us to account for players such as Max Muncy, who, after accumulating -.7 fWAR over two seasons with the A’s, transformed himself into one of the premier power bats in the game since joining the Dodgers. Similar adjustments were applied to Chris Taylor with LAD, Caleb Smith with MIA, Matt Boyd with DET, and Tyler Olson with CLE.
(Both Chris Taylor and Max Muncy revitalized their playing careers after joining the Dodgers, a testament to the organization’s ability to acquire and develop talent over the past seven seasons. Ironically, Taylor and Muncy were drafted seven picks apart in the fifth round of the 2012 draft.)
Obtaining Baseline Results
With a complete database that included yearly changes in value for every acquired prospect in affiliated baseball since 2012, we were able to debit or credit each organization for the change in value, above or below expectation, for each prospect in their farm system signed after January 1, 2012.
(Mark Appel was rated a 55 FV prospect before entering Houston’s system as 2013’s first overall pick. After peaking as a 60 FV heading into 2015, his prospect status dropped to a 50 FV before he was traded to the Phillies prior to the 2016 season. With Appel now currently out of baseball, the Astros incurred a -$21.3M estimate of Value Generated for Appel’s development, whereas the Phillies incurred a -$25.9M estimate of Value Generated for realizing no return on an incoming 50 FV player.)
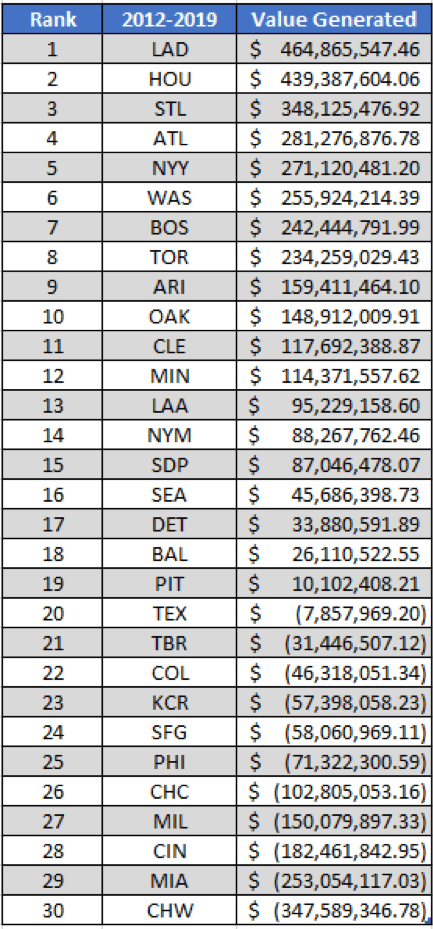
The table below shows our estimates for the raw value generated by each respective organization from 2012 through 2019.
At first glance, the position of many organizations relative to league average seems to align with what intuition would suggest. Teams at the top of the list—such as the Dodgers, Astros, Cardinals, Braves, and Yankees—have developed solid reputations as having either a strong scouting department, a strong player development department, or both. On the flipside, organizations near the bottom of the list have either found ways to build a contender without a homegrown core, or they have struggled to get talent to the majors at the rate we’d expect given their draft position, incoming talent via trades, and international free agent expenditure over the past seven years.
Aside from the order of where teams fall in this leaderboard, it is also fairly eye opening to see the absolute difference in Value Generated between the best and worst teams in terms of acquiring and developing players when controlling for incoming talent. While luck surely plays a significant factor in the $816M separating the Dodgers and White Sox in terms of Value Generated, it is telling that several of the organizations towards the bottom of our list have recently invested in many of the developmental tools the Dodgers and Astros have been using for years. All things considered, it is unlikely that only luck explains the differences in the values provided above and more work is needed to be done to quantify the true first mover’s advantage realized by the Dodgers and Astros.
Concluding Remarks
After leveraging our newly constructed database to generate descriptive estimates for each organization’s ability to acquire and develop talent over the past seven seasons, preliminary findings suggest that we have developed a valid measurement of descriptive performance to disseminate the leaders from the laggards in terms of valuing and developing players at the minor league level.
With these promising initial results, part two of our mini-series will further investigate how teams are able to generate value throughout their minor league system, whether adding expected value to a prospect’s net worth significantly impacts the success of the big league team, and whether we can strip out luck to provide legitimate measures of an organization’s efficiency regarding player acquisition and development.
Comment section
Add a Comment
You must be logged in to post a comment.


Kirin -
It would be interesting to look at prospects that started at some of the highly ranked development teams (ie: Dodgers) and see how players that left that organization and If they continued their success, got better or got worse.