Pairing Various Tools and Tech Together to Better Understand Hitter Tendencies
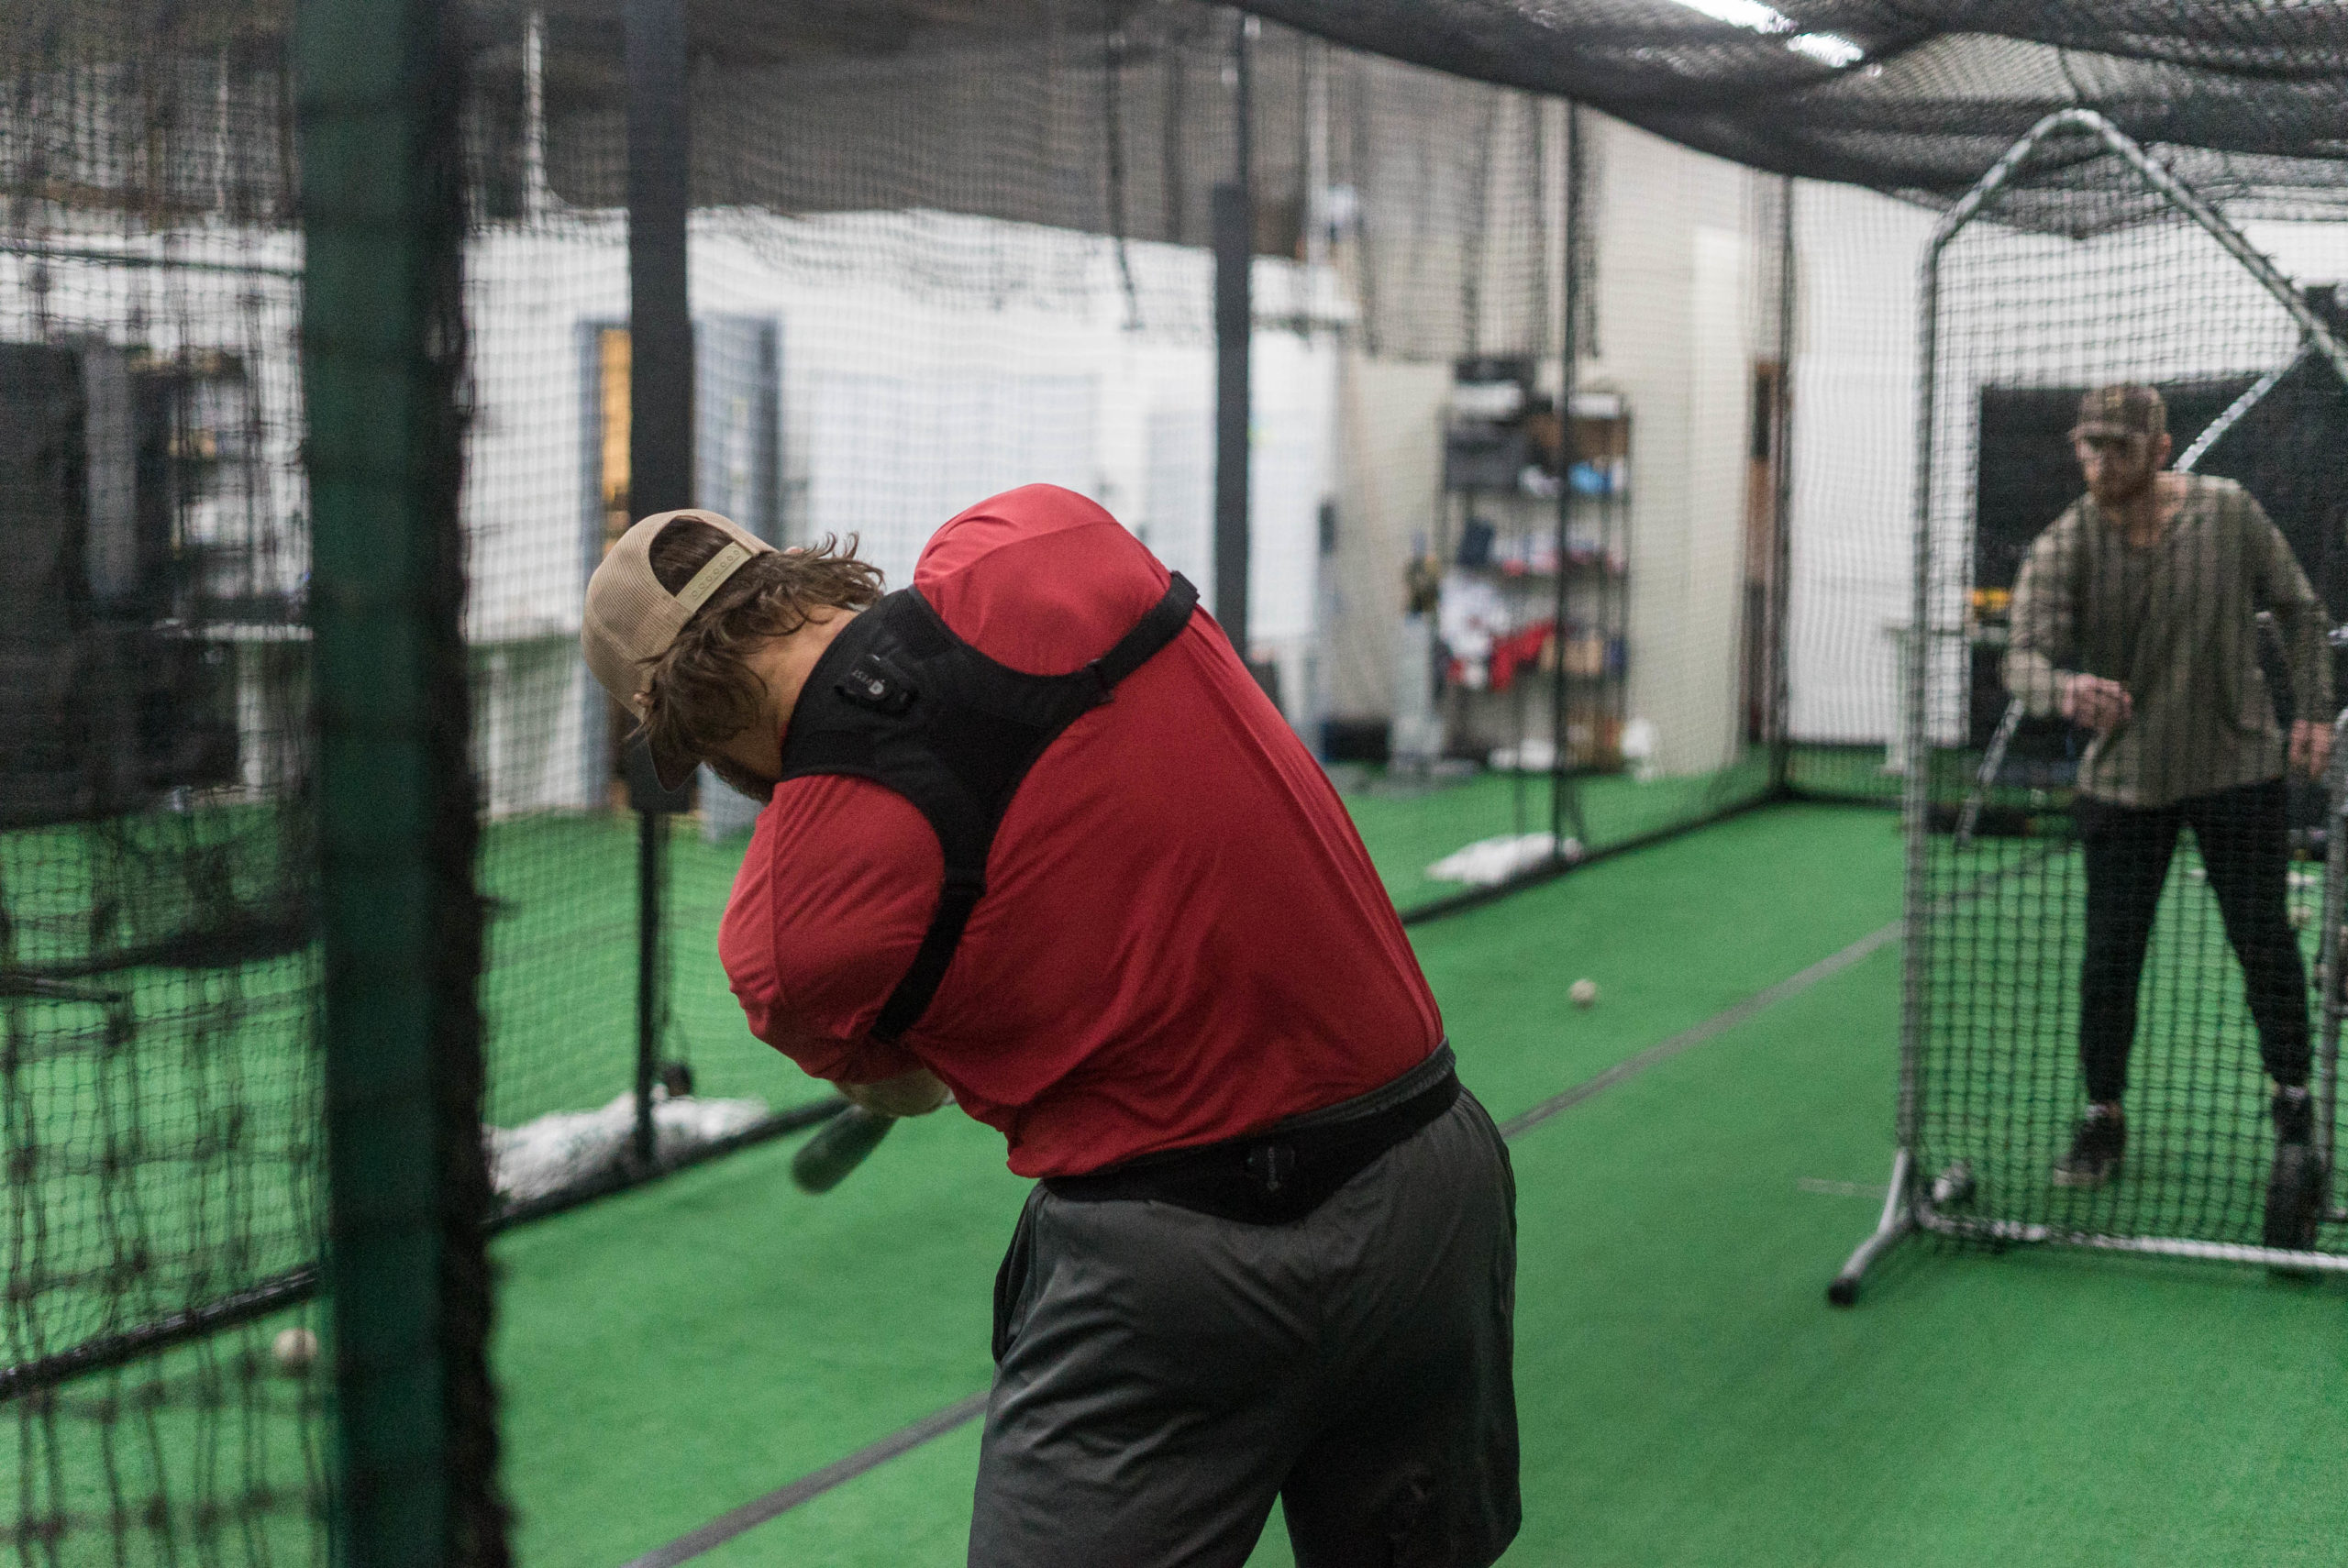
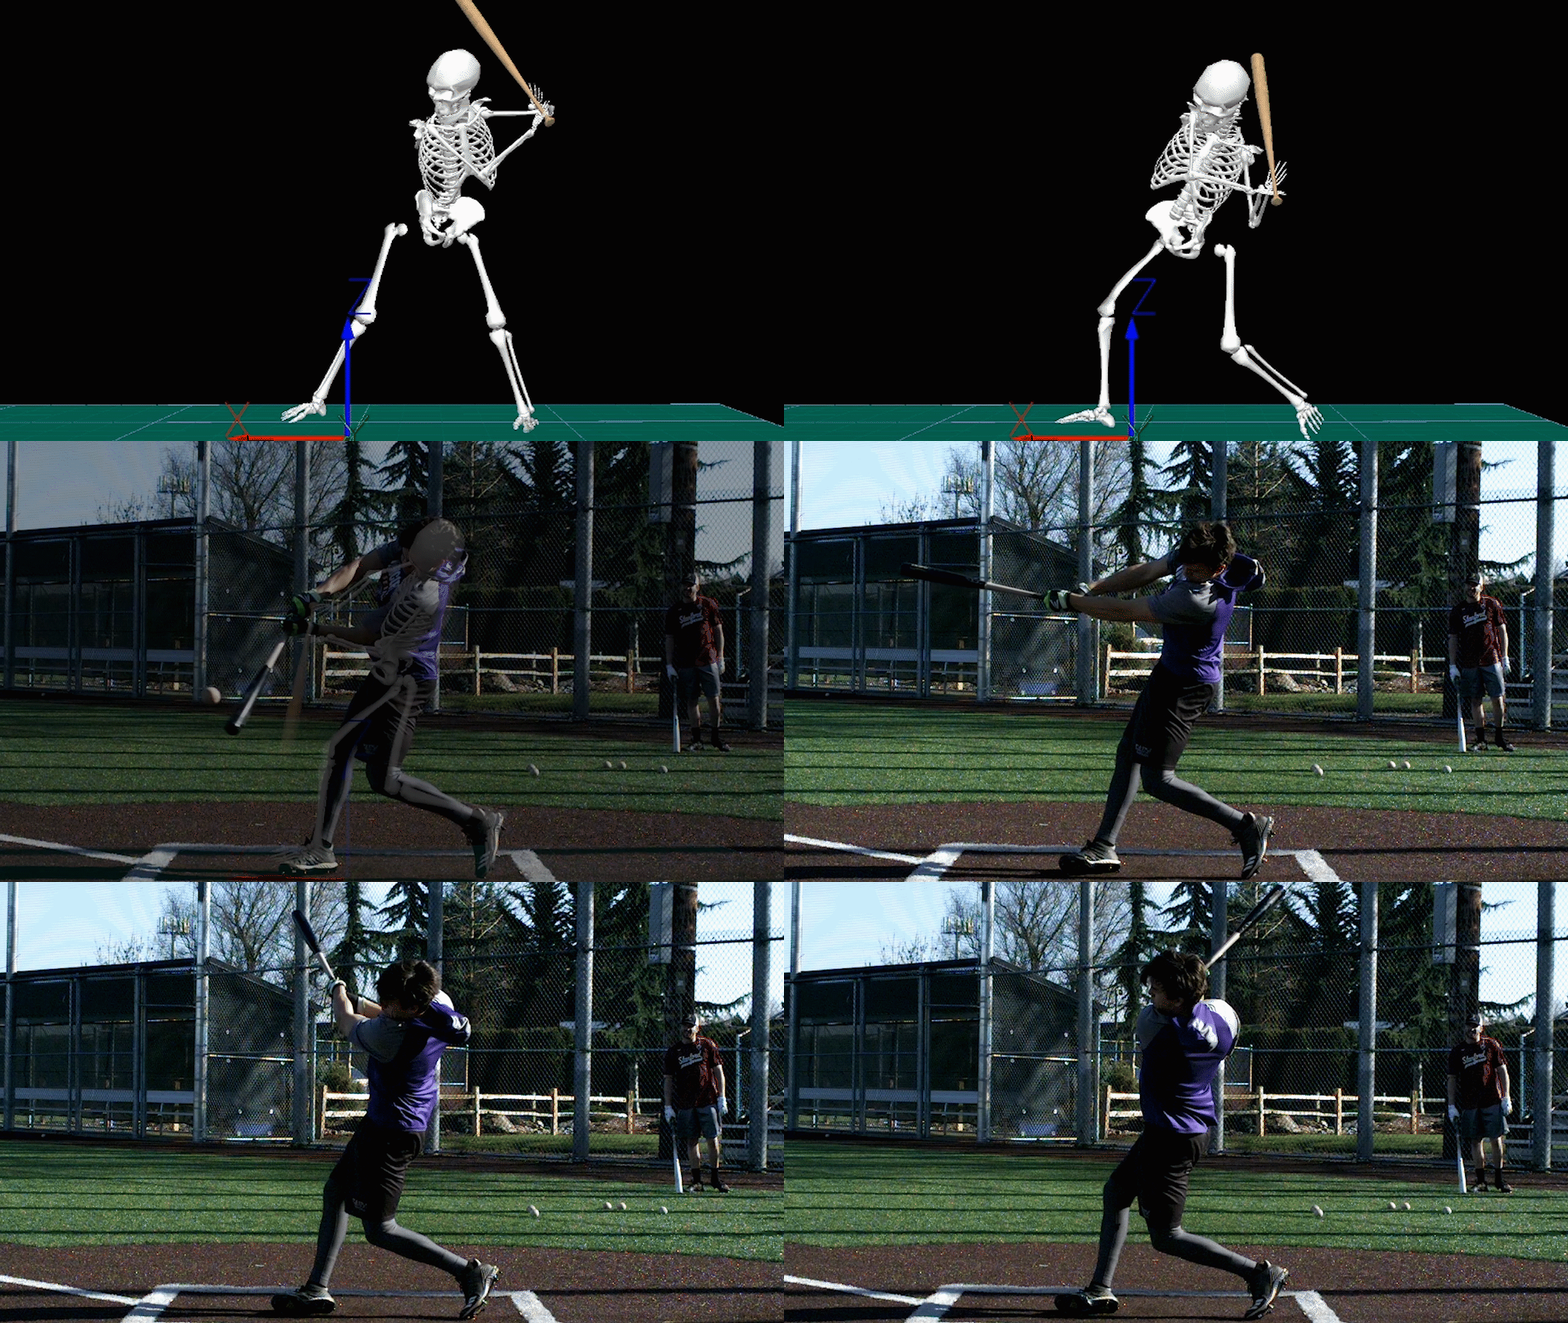
Integrating modern technology to help build an individualized program is arguably one of the biggest challenges facing hitting coaches today. With new tools such as K-Vest, HitTrax, Blast Motion Sensors, and OnBaseU, hitting screenings becoming common among facilities and programs, and the opportunity to develop your players as efficiently as possible has never been greater. Having the tech is the first step, but being able to take four different applications and tie them together to understand why a hitter produces a certain result is really where you can extract the most value out of these tools. But how do we, as hitting coaches, accomplish this?
The ultimate goal for each hitting coach should be to successfully integrate and communicate these data points to an athlete in his own language. That way, it is easy for a coach to help each player understand what and/or why he is doing what he’s doing, and provide him with an actionable plan to make adjustments moving forward, all backed by objective measurables.
This is also a simple method to foster buy-in from your players: “Right now you’re doing X, which is less than ideal. Given this information, I think a good plan of action would be Y, and a good goal for you to shoot for six weeks from now would be Z.”
This article explains how we pair all of these tools together to better understand why each hitter performs in a specific manner. We offer real examples of athletes we’ve ran through our assessment process to offer specific case studies of how we tie all four segments of data together to better understand hitters from a macro perspective.
Foundations of Hitting
30 modules teaching you everything we know about hitting and hitting mechanics.
Tying It All Together
With all of this different data, where do we start? It’s most effective to work backwards through our various pieces of data to gain a clear understanding of why each hitter does what he does: batted ball report, back to swing metric report, back to biomechanics report, back to mobility/stability screen.
The first step is to look at a hitter’s tendencies in his batted ball report. Hitter A displays X result in his batted ball report, which is good information to have, but why is Hitter A consistently producing this result? From there, we work backwards and look at his swing metrics. By understanding exactly how Hitter A’s bat is moving through space, you’re likely to get a clearer picture of why he is impacting the ball in a certain way. Hitter A is producing X result in his batted ball report, and this can be attributed to X score in a certain swing metric (or metrics).
This is also valuable information to have; Hitter A produces this result because his bat moves a certain way throughout his swing. But why is Hitter A moving the bat through space in this way? The next step would be to look at his kinematic sequencing and body positioning data. Hitter A is likely moving his bat through space in X way because his body is moving in this specific way. Lastly, we ask “why?” one last time: why is Hitter A’s body moving like this?
- Step 1: Hitter A consistently impacts the ball in X way.
- seen via batted ball report.
- Step 2: Why does Hitter A consistently produce this result?
- Through the swing metric report, we see that Hitter A’s bat is moving X way through space.
- Step 3: Why does Hitter A move his bat like this?
- By looking at the athlete’s biomechanics report, we see that his bat moves in X way due to his body moving in X way.
- Step 4: Why does Hitter A’s body move this way?
- Through our hitting movement screen, we’re able to see whether or not this hitter has specific mobility and/or stability issues that are causing his body to move a certain way.
Through our hitting mobility and stability screen, we can see if Hitter A moves in X way due to mobility/stability issues, or if it is just an inefficient movement.

Become the Hitter You Want To Be
Train at Driveline
Batted Ball Data – Example 1
A hitter came into our gym recently for assessment and to train on site for one month. Recently cut from his Division 1 collegiate program, his motivation for coming out was to go back to his collegiate program in the fall and make the team. After going through his initial seven-day assessment, we generated a batted ball profile for him. Within the batted ball profile, we found that he struggled to square up balls to the pull side of the field. When putting balls in play to the right side of the field (he’s a left-handed hitter), his average exit velocity dipped down to 76.38 mph and his average launch angle to the pull side fell to 3.50 degrees. So, when he pulled the baseball, it usually resulted in a weak ground ball.
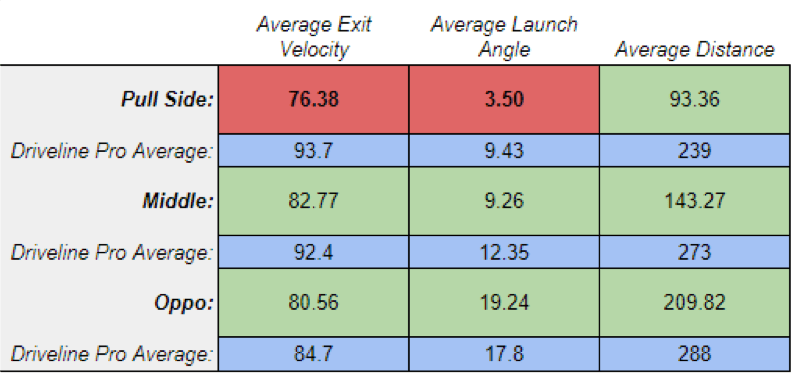
In comparing this result with the rest of his batted ball tendencies, we found that this athlete actually hit balls harder to the opposite field, which is the opposite trend of what we see our professional hitters do. In an ideal world, you can hit the ball equally as hard to all parts of the field, but not many hitters are capable of doing that. If you’re not able to hit for equal power to all fields, you can maximize outcomes on balls in play by having your highest exit velocities at an optimal launch angle to your pull side, because batted balls in the air to the pull side are the most valuable that a hitter can produce.
We can also see in the graph below that this hitter rarely hits anything out in front of the plate:
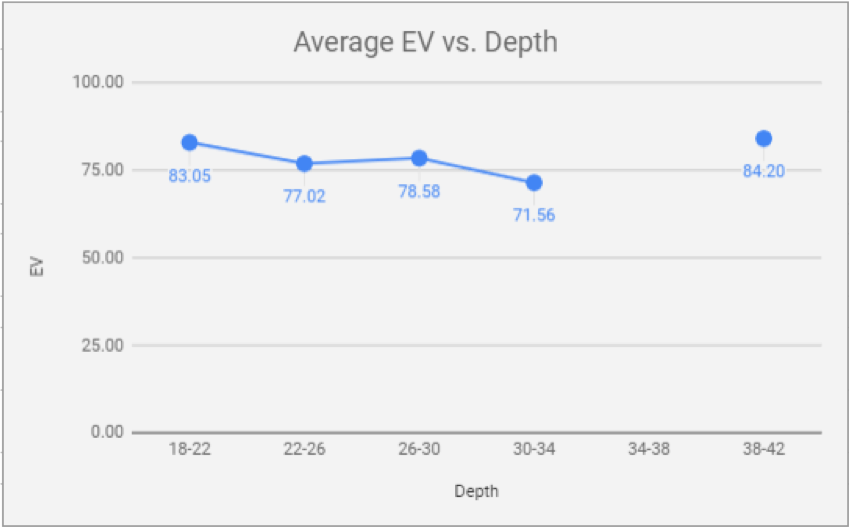
This observation provides us with insight into why this hitter struggles to pull balls; he hits hardly anything out in front of the plate. Generally speaking, the farther to the pull side a batted ball goes, the farther out in front of the plate the hitter will want to make contact. This allows the batter more time to rotate farther and move the bat farther through space. If you’re not impacting the ball out in front of the plate, particularly with pitches on the inner third of the strike zone, you make it more difficult on yourself to produce a good batted ball outcome.
Thus, after seeing this inefficiency in his batted ball profile, we need to ask: Why does this hitter struggle to produce optimal EV and LA metrics to his pull side?
Swing Metrics – Example 1
To dig deeper, we pull up the hitter’s swing metrics to look for any clues for why he is producing suboptimal contact to his pull side.


After looking at his swing metrics, we see that he produces a very low rotational acceleration score, meaning he doesn’t reach peak rotational speed and power very quickly. It’s also likely that this hitter relies on his arms/hands to produce the majority of his bat speed.
We also notice that his early connection scores are a bit high. This means that his barrel is very vertical at the beginning of his downswing, causing the bat to have to move farther through space to get on plane with the incoming pitch. By looking at his swing metrics, we see that he isn’t rotating as quickly as he needs to be, nor is the relationship between his spine and barrel optimal. This prevents him from having a “tight turn” since he’ll need to be able to drive the inside pitch at optimal exit velocities or launch angles.
Had this athlete possessed elite bat speed (+72 mph), he may have been able to get away with lower rotational acceleration scores, but since his bat speed off a pitching machine at game-like velocities was 61 mph on average, these game-like velocities have exposed a couple of holes in his swing.
Kinematic Data – Example 1
Given this information, we seek to understand why this hitter moves the bat through space this way to help him make an adjustment. For more insight, we look at how he moves his body by looking at his kinematic sequencing and body positioning. From these reports, we may be able decipher the root cause of this deficiency.
Provided below is an efficiency graph of this hitter’s kinematic sequence;
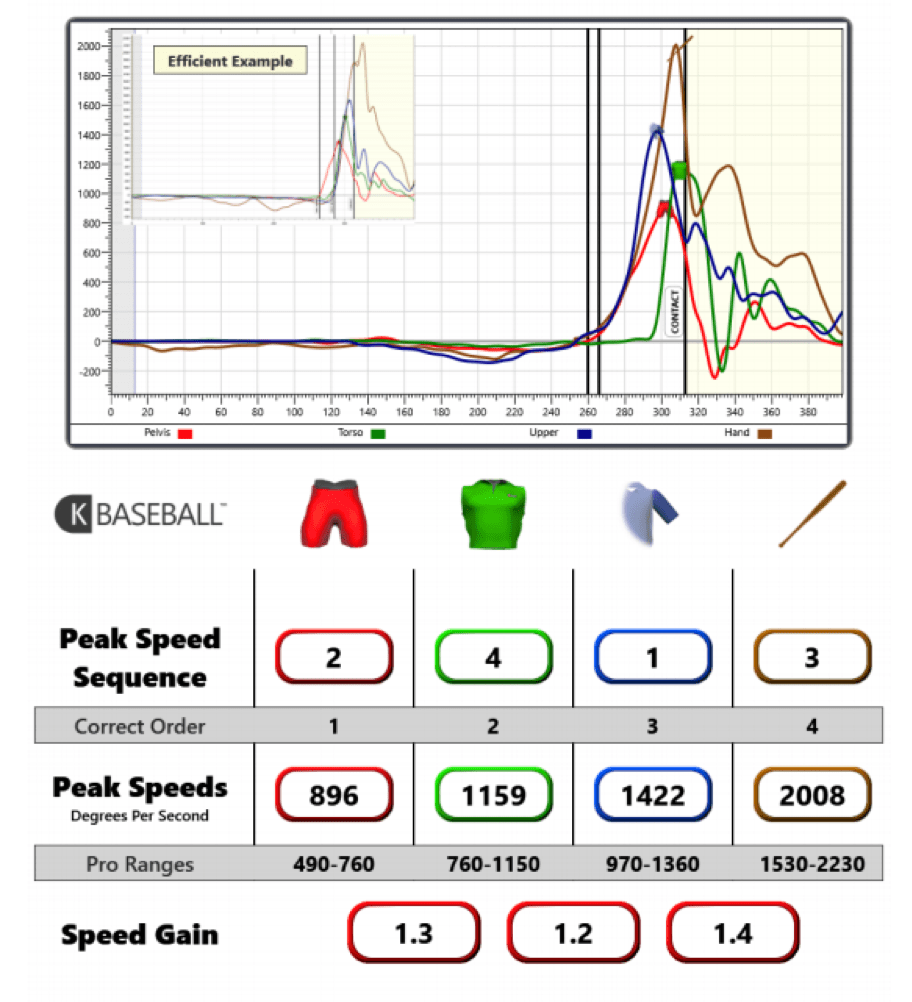
As seen in the graph above, this hitter’s kinematics are out of sequence; i.e., he isn’t transferring energy from the ground and up the chain efficiently. Ideally, you like to see the peak speed sequence go from hips, to torso, to lead arm, to bat, or 1, 2, 3, 4. In this swing, we see this hitter is actually firing his lead arm (1) before his hips (2), and his bat (3) before his torso (4). While all of his peak speeds are within pro ranges, this inefficient sequence likely contributes to his low rotational-acceleration scores, because his hips are following his hands, rather than the other way around. As a result, his bat actually decelerates at contact, which is the opposite of what we see in elite performers. This hitter also demonstrates below-average speed gains between each segment; we’ve found that the best hitters will generally have an efficient sequence and coinciding speed gains of about 1.5 to 1.8 between each link of their chain.
Taking this a step further, we can also take a look at the hitter’s body positions at first move, heel strike, and contact. This hitter maintains good body positions at first move and heel strike, all of which are within K-Vest’s provided pro ranges (the green portion of the below circles), but this changes once he gets to contact:
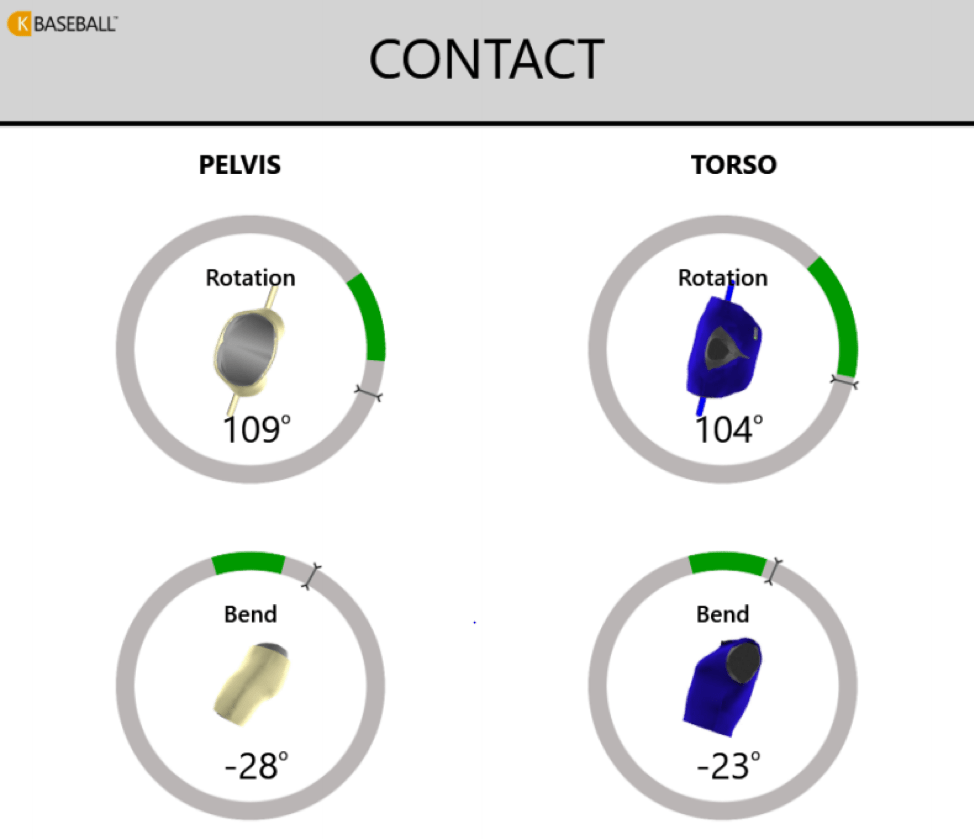
This visual shows segments of this hitter’s body that are in several suboptimal positions at contact. His pelvic rotation and bend, as well as his torso rotation and bend, are all out of pro ranges at contact; he is essentially “fighting against his own body” when he impacts the ball, rather than putting his body is a proper position to generate maximum rotational speed and power.
Since his lead arm fires before his hips, and his bat fires before his torso, the hips and torso are perpetually playing “catch up.” This prevents them from decelerating early enough in the swing, causing both to over rotate at contact in an attempt to make up for the inefficient sequence. This hitter’s pelvic and torso bend are also out of pro ranges, indicating the hitter is “bailing” or “flying out” of position instead of staying stable and rotating around his spine.
Movement Screen – Example 1
This information provides tremendous insight into why he is producing low rotational acceleration and bat speed, which, in turn, helps explain why he struggles with generating optimal contact to the pull side. While this gives us a base to work on, we’re still left searching for answers for what is causing his high early connection scores. For a better understanding of why this is happening, we defer to his mobility/stability screen.
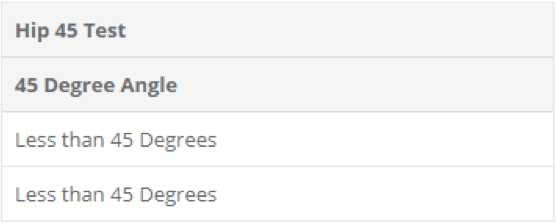
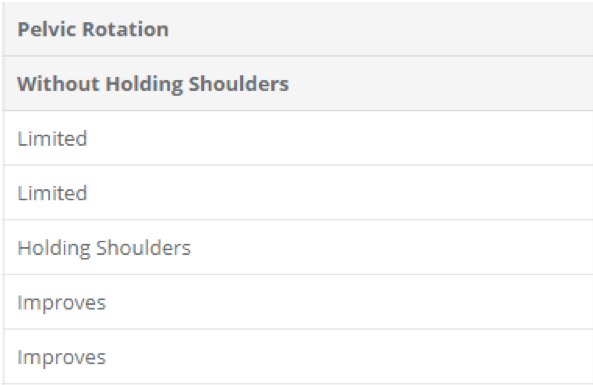
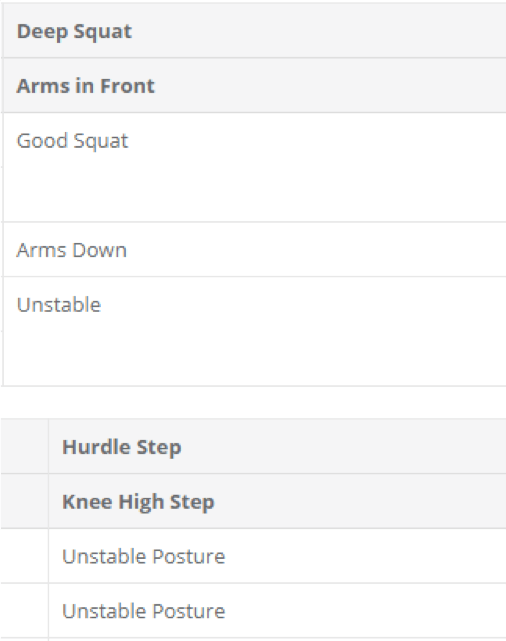
Within his initial movement screen, we can see that he suffers from poor/limited hip mobility, which is likely contributes to why he swings out of sequence. This then may contribute to his low rotational-acceleration scores, which in turn contributes to his inability to impact balls out in front of the plate, which finally contributes to his struggles with the inside pitch and producing quality batted balls to the pull side.
We can also see that he displays poor wrist mobility, or a lack of “wrist hinge,” a deficiency that could also affect his high early-connection scores.
Lastly, we can see in the visual provided below that this athlete struggles with overall stability, which likely results in his body ending up in sub-optimal positions at contact.
Gameplan and Programming- Example 1
By working backwards through our various data collections, we now know this hitter’s lack of hip and wrist mobility, suboptimal kinematic sequencing, and body positioning at contact all likely contribute to his low rotational acceleration and high early-connection scores. In connecting abnormal rotational acceleration and early-connection scores with his struggles to produce valuable batted balls to the pull side, we’ve identified the root causes of his weaknesses at the plate.
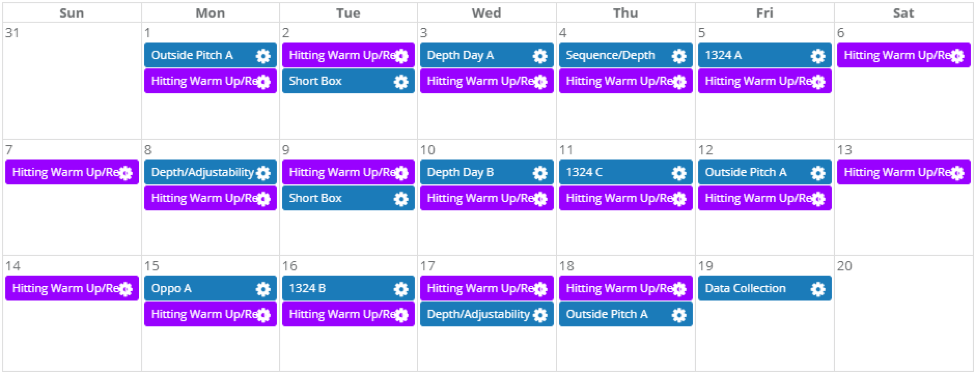
Now we have a baseline for training this athlete and have gained a good understanding of exactly what’s going on with his body and swing. This allows us to address these inefficiencies, not only with individualized hitting programming but also with individualized mobility correctives and strength training in the weight room, as well (all of which can be accessed by the athlete via his TRAQ profile). Below is an example of a month’s worth of hitting, strength, and mobility programming specifically designed for this hitter:
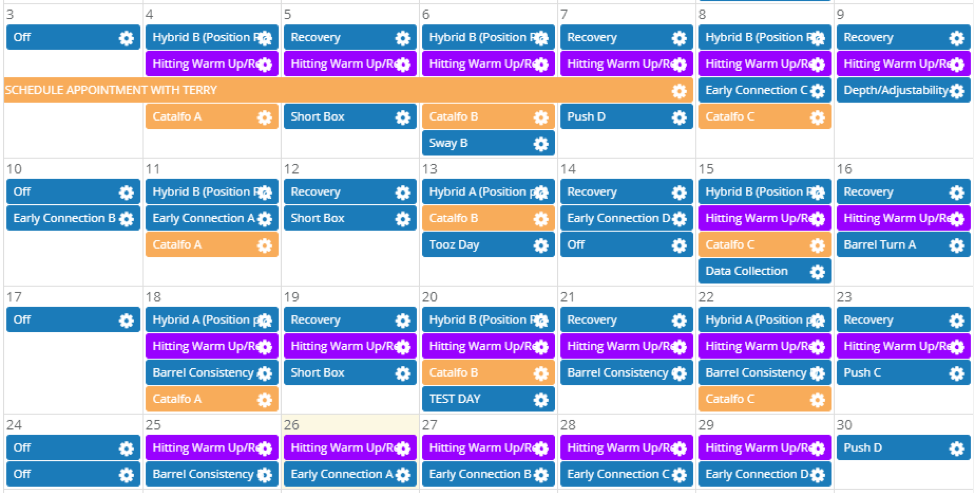
To monitor the effectiveness of our program, we retest each of our hitters bi-weekly. This allows us to update our programming as necessary to provide athletes with evolving programming that is best able to improve the aspects of their swings.
Batted Ball Data – Example 2
Hitter B came to us during the most recent pro off-season after a very successful college career. After being overlooked in that year’s MLB Draft, he came to us looking to train for a month before going to a few independent ball tryouts. After going through our assessment process during his first seven days of training with us, we generated a batted ball profile for him, which is provided below:
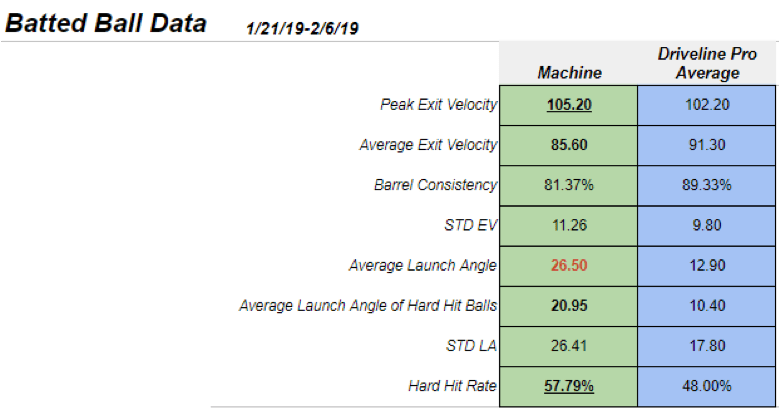
Based on the initial batted ball data, we see that this hitter has some talent. With a peak exit velocity and hard hit rate (a “hard hit” is any ball put in play within 10% of your peak EV, per HitTrax) both well above our in-gym pro averages, this hitter hits balls hard and makes solid contact more often than not. We also see that his average LA is more than double our pro average, so when he misses balls, it is likely that he misses underneath them.
As we continue diving into Hitter B’s batted ball profile into his advanced batted ball data, we start to see some trends that are worth addressing:
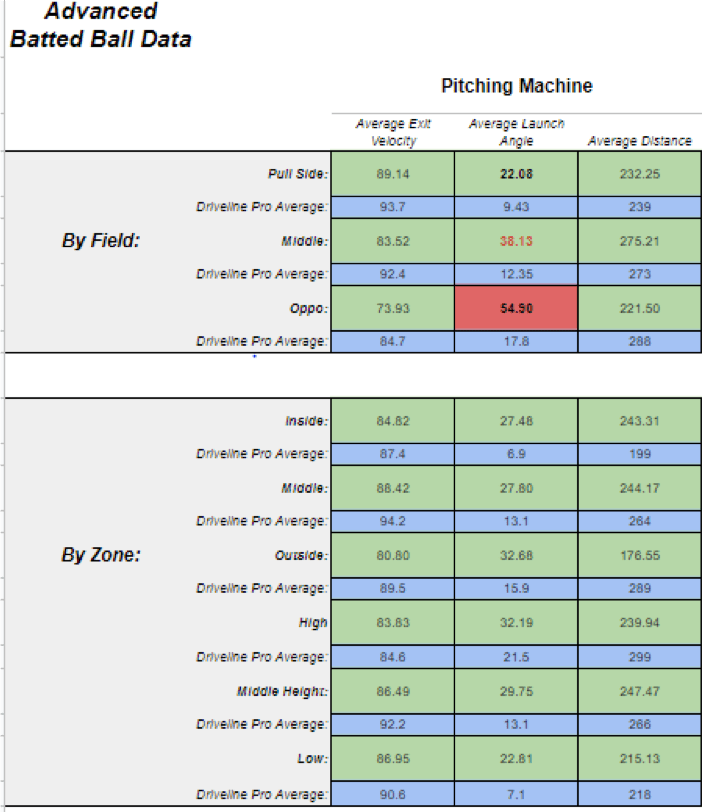
We can see Hitter B’s average EV to the pull side is well in-line with our pro averages. However, when he hits the ball to center and left field (he’s a LHH), his average EV falls well below our pro averages. In addition, we can also see that Hitter B’s average LA to all three parts of the field are substantially higher than our pro averages. He produces an optimal EV and LA combination to the pull side (89 mph at 22 degrees gives you a great chance for a positive outcome), but 83.52 mph at 38 degrees to the middle of the field is essentially a lazy fly ball. Furthermore, when this hitter puts a ball in play to the opposite field, his average EV drops off quite substantially (down to 73.93 mph), and his average LA skyrockets up to nearly 55 degrees. This means that his average ball in play to the opposite field is equivalent to a routine pop up.
The obvious takeaway from the batted ball report is that while Hitter B can mash balls to the pull side, he struggles when going the other way. Taking it a step further and looking at his batted ball data sorted by field, we can see that Hitter B’s lowest EV, highest LA, and shortest distances are pitches on the outside part of the plate.
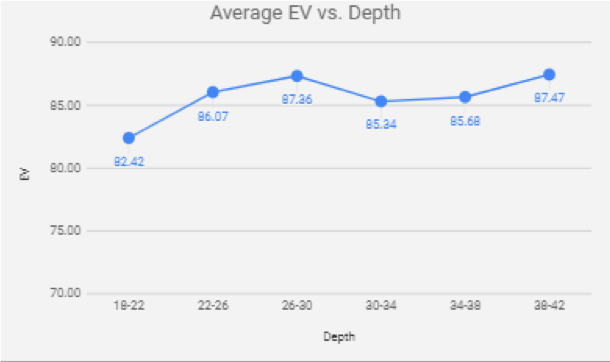
Last, we can see that Hitter B’s softest hit balls (or lowest average EV) are on balls he makes contact with deeper into the plate, towards the catcher.
Swing Metrics – Example 2
With the information gathered in Hitter B’s batted ball report, we see that this hitter has talent and can produce professional level EV. However, there are a couple of holes in his swing: he struggles to hit balls hard and on a line to the opposite field, as well as on pitches in the outer third of the strike zone.
Armed with this information and the methodology outlined in our previous example, we turn to Hitter B’s swing metrics to figure out why he is consistently producing sub optimal batted ball metrics to the left side of the diamond:


Looking at Hitter B’s swing metrics, we observe that his swing is relatively clean at first glance. He produces good bat speed (averaging in the high 60s and peaking at 83.1 mph), and maintains a healthy attack angle of 8 degrees. However, a deeper dive uncovers a below average rotational-acceleration score, an on-plane efficiency of less than 50 percent, a relatively low connection at impact score, and a relatively high time to contact score relative to his peak and average bat speed.
What insight does this information provide us? While Hitter B’s rotational-acceleration scores aren’t terrible, we want to see him hovering around 15-16 g. The below average score indicates that he generates the majority of his bat speed in the later parts of his swing, which could mean he heavily relies on his arms and hands to generate bat speed. Additionally, Hitter B’s relatively low on-plane efficiency score means that he isn’t getting on plane with the incoming pitch until the later parts of his swing. As a result, both of the scores on these metrics provide straightforward evidence as to why Hitter B struggles with optimal contact on pitches away, as well as driving the ball to the opposite field.
Additionally, and arguably most relevant, Hitter B has a connection at impact score of 80 degrees, which is lower than the 90 degree score you’d like to see. The connection at impact score measures the relationship between the hitter’s spine and the hitter’s bat at contact with the ball. Generally speaking, hitters in our gym with low connection at impact scores have a tendency to “slice” or “cut” balls to the opposite field. The ball will likely come off the bat with side spin at a higher than desirable launch angle. In this instance, this theory is supported by Hitter B’s advanced batted ball data (low EV and high LA to the opposite field, and on pitches in the outer half of the zone).
Lastly, Hitter B’s average time to contact of 0.16 is a bit higher than our pro averages in gym, indicating that his swing can sometimes be a bit “long” and/or that he makes the majority of his contact out in front of the plate. This is generally a good thing, but it’s likely this hitter is actually making contact with pitches in the outer third of the zone a bit too far out in front of the plate, rather than identifying the outside pitch, and letting the ball travel a bit deeper.
By pulling up some additional point of contact data, we can see more that supports this theory:
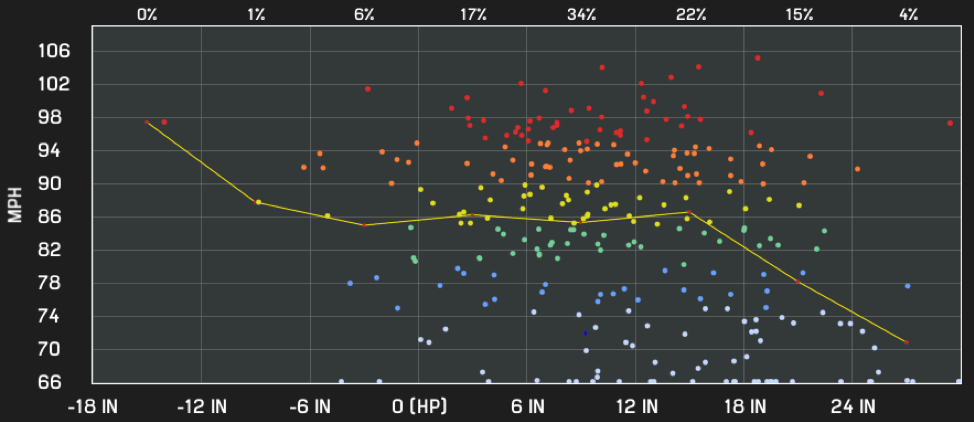
The vast majority of this hitter’s batted balls are impacted 6-18 inches out in front of the plate. As you can see on the X axis in the graph above, home plate is 0, anything negative is above or behind home plate, and anything positive is the distance in front of the plate at which contact is made.
Kinematic Data – Example 2
With a detailed understanding of which pitches Hitter B struggles against and why his swing characteristics contribute to those weaknesses, we can continue to work backwards to identify the root cause of these issues through how his body moves. Below is an efficiency graph of Hitter B’s kinematic sequence and speed gains:
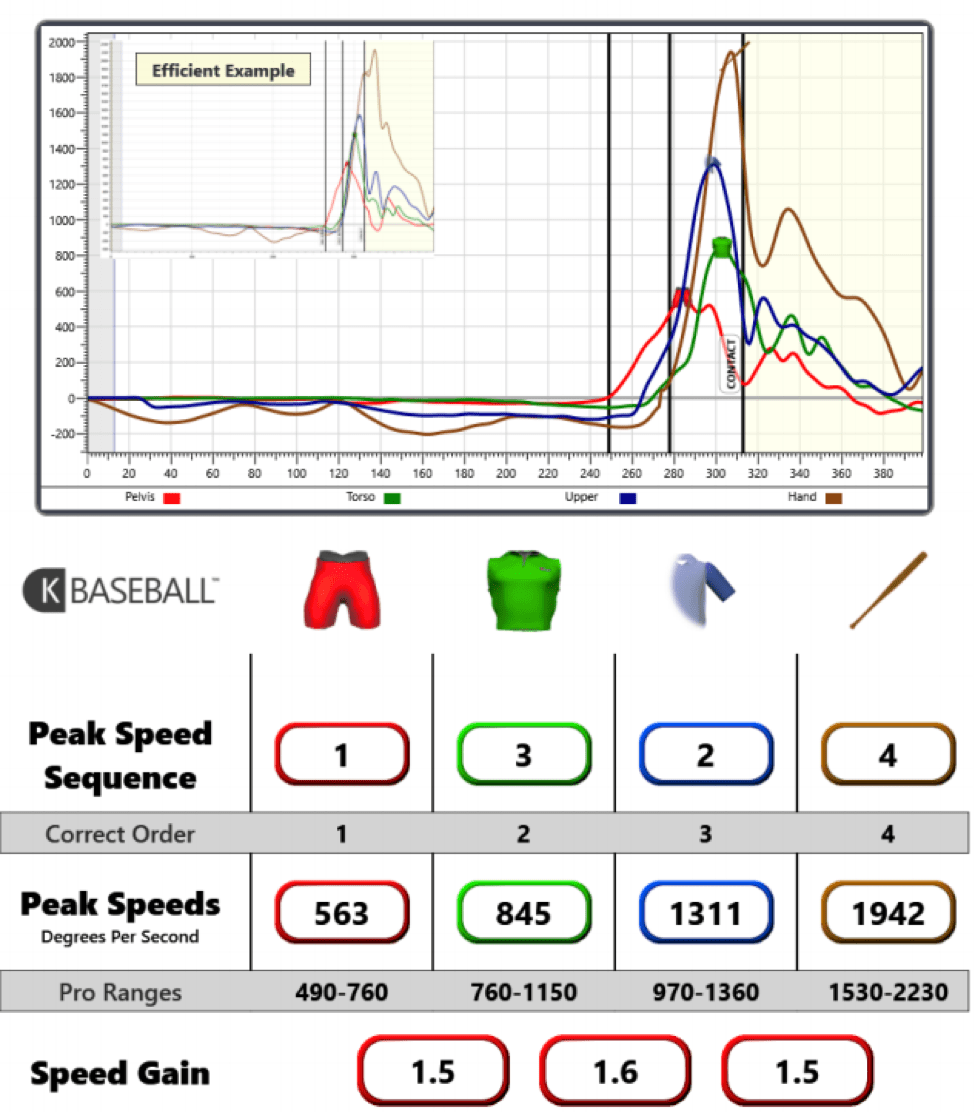
We can see that Hitter B is out of sequence. His lead arm actually fires before his torso, which the opposite of what we would see in an efficient example. So, while he produces peak speeds and speed gains that are sufficient, the fact that his lead arm fires before his torso and most of his point of contact data is 6-18 inches out in front of the plate provides validation that this hitter relies on his arms and hands to generate the majority of his bat speed.
This data also helps explain Hitter B’s below average rotational-acceleration scores. Had he been in sequence and using his torso more efficiently, he’d have been able to produce peak bat speed more quickly, which in turn would help improve his rotational acceleration and time to contact scores.
Taking this a step further, let’s take a look at Hitter B’s relevant body positions at contact:
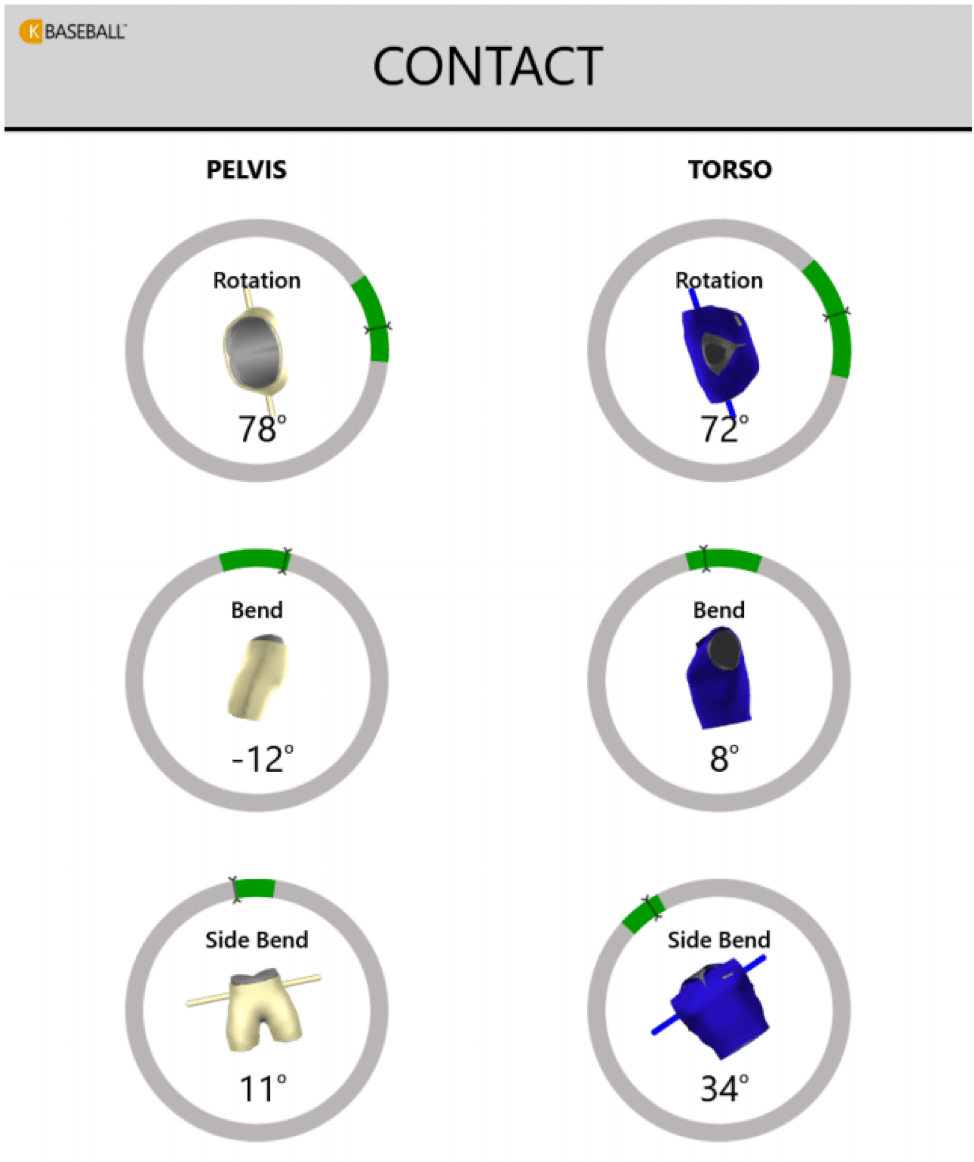
While all of these body positions at contact are within K-Vest’s provided pro ranges, we can see that Hitter B’s pelvic bend, pelvic side bend, and torso side bend are on the edge of those provided pro ranges. Hitter B’s borderline pelvic side bend and torso side bend scores could be contributing to his low connection at impact scores, which is likely what’s causing him to “cut” and “slice” balls to the opposite field rather than driving them on a line.
Movement Screen – Example 2
So, what do we know so far? We know Hitter B struggles to drive the ball to the opposite field and struggles to drive the pitch on the outer third of the plate, which of course go hand in hand.
We theorize this could be attributed to a less-than-optimal point of contact on outside pitches, a relatively low rotational-acceleration score, and a low connection at impact score. In diving deeper, we posit that these swing metric scores can be attributed to out-of-order kinematic sequencing, as well as borderline pelvic and torso side bend positions at contact.
As shown with Hitter A, truly getting to the root cause of Hitter B’s deficiencies requires us to better understand why his body moves as described above. For example, are these body movements the result of a lack of mobility/stability? Or has Hitter B just patterned himself to move like this?
For additional insight, we dive into Hitter B’s movement screen:


Looking at Hitter B’s movement screen, we see that he displays limited mobility in both pelvic and trunk rotation, but, interestingly enough, passes both arm (shoulder and elbow) movement screens. On the surface, these results provide good insight into why Hitter B fires his lead arm before his torso. Furthermore, Hitter B also displays limited thoracic spine mobility, providing more reason for why he is so apt to rely upon and fire his lead arm before his torso.
The limited pelvic rotation Hitter B displays could be a likely factor in his sub-optimal pelvic side bend at contact position. Rather than rotating his hips as much as he should, he manipulates them vertically in order to be on time and get his barrel to the ball.
Additionally, Hitter B also displays limited wrist mobility, or struggles to create sufficient “wrist hinge,” which could factor into Hitter B creating sufficient bat lag. This likely explains why the vast majority of Hitter B’s point of contact is so far out in front of the plate: his limited mobility causes him to release the barrel very early.
Now, what do we know?
- We know Hitter B displays limited pelvic and torso rotation, as well as limited wrist mobility.
- It is likely that these mobility inefficiencies contribute to this athlete’s sub-optimal sequencing (1, 3, 2, 4) and body positions at contact (pelvic and torso side bend).
- Diving deeper, these sequencing and body-position inefficiencies likely contribute to the athlete’s low rotational acceleration (11.6 g) and connection at impact scores (80 degrees).
- Tying everything together, these aforementioned swing metric scores are what’s likely causing Hitter B to struggle with pitches in the outer third of the strike zone, as well as driving the ball to the opposite field. (Low EV, high LA)
Gameplan and Programming – Example 2
With all of this information and a theory supported by several different sects of data, we generated a holistic program for this athlete to combat these identified inefficiencies. For Hitter B, we developed a hitting mobility warm-up and cool down designed to address and improve his limited pelvic, t-spine, and wrist mobility. In the weight room, a strength training program was designed to help him move more efficiently and get stronger in his specific areas of needed improvement. Lastly, Hitter B’s hitting programming was specifically designed to force movement adaptation tailored to improve his struggles with the outside pitch, driving the ball to the opposite field, and allowing for a deeper point of contact when warranted. All of which was dropped into his TRAQ profile for him to be able to access anytime, anywhere, on any device.
What’s Next
We believe in an integrated, data-driven approach to training athletes. All of the different tools and technologies we use can and should be tied in together. The more information you have on a given athlete, the better training and programming you can provide them. We also believe in incrementally retesting our athletes so we can quantify progress and improvements, and make adjustments if we’re not seeing the results we expect.
The hitting community now has incredible tools available to them, all of which should be used in conjunction with one another. We know more about hitting now than we ever have before, but there is still much we don’t know.
The next steps in the evolution of Driveline Hitting will be validating the current technology we use via motion-capture analysis, measuring and testing hitter’s ground-reaction force, and gaze tracking each hitter’s pupils to better understand what a hitter sees when he steps in the box as he tracks pitches.
There’s a lot we don’t know, but we’re self-aware enough to know that we don’t know, and we’re on the road to finding out.
Train at Driveline
Interested in training with us? Both in-gym and remote options are available!
- Athlete Questionnaire: Fill out with this link
- Email: [email protected]
- Phone: 425-523-4030
Written by Hitting Trainer Collin Hetzler
Comment section