Elbow Stress, PULSE, and Velocity
Explaining Elbow Stress and Torque
When measuring elbow stress in biomechanic labs it is often peak stress that is being measured. This peak stress often occurs during what many researchers call the ‘arm cocking’ phase of the pitching motion. The arm cocking phase is found between front foot contact and max external rotation.
The stress that occurs during this time is called valgus stress, which in turn is going to cause an equal reaction of varus torque at the elbow. A great explanation can be found in Biomechanics of Baseball Pitching: Implications for Injury and Performance by Glenn Fleisig
“In the arm-cocked position, shortly before max external rotation, the arm is experiencing varus torque. In this position peak elbow varus torque is 99+-17 Nm. Which is the equivalent to holding roughly a 55lb weight in your hand at that instant.”
As Newton’s third law of physics explains, every action causes an opposite and equal reaction. So in an effort to stop your arm from externally rotating too far from valgus stress, an eccentric internal rotational (varus) torque is needed.
This torque is often the peak torque placed on the elbow. It’s up to the UCL and the surrounding musculature to support this load.
So at a basic level we understand that decelerating the arm in external rotation and initiating internal rotation (arm cocking, max external rotation to acceleration) is very stressful on the elbow.
Using PULSE to Measure Stress
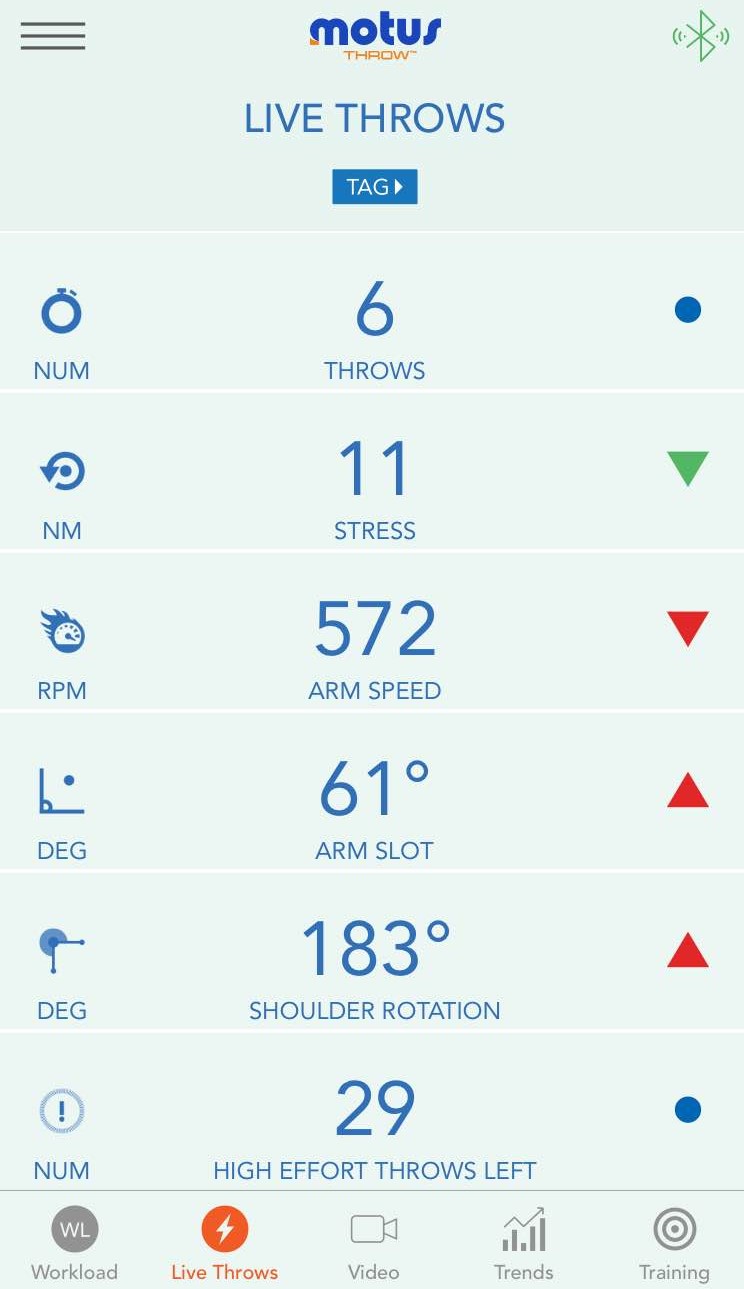
We believe that the PULSEthrow sensor is an accurate measuring tool for total elbow stress. Significantly lowering the bar from biomechanics lab all the way to the field for athletes and coaches to collect valuable data.
Mike Reinold presented some interesting data at this year’s SaberSeminar stating that the newest PULSEthrow sensor has an intraclass correlation (ICC) value of 0.99 for valgus/varus torque vs. stress (newton-metres) and the American Sports Medicine Institute’s lab in Birmingham, AL. We have since confirmed those findings with Glenn Fleisig (head of ASMI biomechanics research). Therefore, we can be confident that the PULSEthrow sensor gives very close readings to the elbow torque values that ASMI publishes.
The PULSEthrow stress metric gives its measurement in newtons/metres. Newton/metre (Nm) is a unit measure of torque, which can be described as a twisting force that tends to cause rotation.
So now we know what the PULSEthrow app is measuring (stress in Newton Metres (Nm)) and that it is accurate when compared to a lab such as ASMI.
Knowing this we also need to understand there is a difference between total stress and specific stress. What the stress metric doesn’t tell us is whether this stress is occurring directly on the UCL or some combination of the UCL and the surrounding musculature.
As James Buffi has stated previously: “There are more than 10 muscles that cross the elbow, and when we only consider the total elbow load, we really have no way of calculating how any of these muscles are individually affecting the load on the UCL during a pitch.”
We can assume that the PULSEthrow stress metric is an accurate measure of total elbow stress but we don’t know how that stress is distributed throughout the muscles and ligaments in the elbow.
What do the other metrics mean?
At this point we don’t have enough biomechanics data to validate the other metrics. We hope we will be able to do so by spring but for now we will be looking at the stress measure.
What does the PULSEthrow stress metric mean? Finding Context in Research
We can look at peer reviewed research to find some context in the stress readings. Keep in mind all these numbers are snapshots, we don’t know how or if these numbers would change under different training circumstances.
Some of the differences between studies can be explained by the time in which the study was conducted, the technology available or used, and the sample of athletes. (Which is why we try to recreate as much research as possible!). But you see a range of 52-120 Nm as possible varus torques produced on the elbow, which seems to be a large range.
The PULSEthrow app offers a high effort range of their own, 52-67 Nm, which falls in line with the studies above and our the mean stress we found from our athletes of 62 Nm. Again what these numbers mean in a specific training context is still up for debate.
One study in particular did point out differences in stress levels between playing levels.
The researchers found that joint forces and torque increased with each level of competition, with some difference in kinematics between levels as well. This gives some context to stress levels you may see with the PULSEthrow with athletes of different ages.
(For reference of this article Kinematics in the above article refers to: max pelvis angular velocity, max upper torso angular velocity, max elbow flexion, max shoulder external rotation. Though not the most accurate definition Kinematics describes motion and can be thought of as actual measurements of mechanics or mechanical differences.)
So we have an idea of when peak stress on the elbow occurs and we have a tool that can accurately measure the stress, but we don’t know exactly how that stress is distributed. Moreover we have some context as to how those numbers compare to biomechanical studies of athletes of different ages
Data We’ve Collected
We have had 17 pitchers so far throw bullpens in the facility, ranging from 6-19 pitches when they were wearing the PULSEthrow sleeve. The number of pitches differed because of different goals of the mound work (mound velo vs bullpen) and some athletes did not like the feel of the sleeve.
For the purpose of this article we are only looking at 4 & 2 seam fastballs. The data was collect as either mound velocity days for gap year athletes or baseline data collection for professional athletes. These pitchers threw less than 10 off-speed pitches in total those were removed from the analysis.
Update: The original article had 17 pitchers and has since been updated to 19 pitchers. The numbers below have been changed to reflect that change. The numbers below also only look at the 6 fastest pitches from each pitcher.
Is there a correlation between Stress and throwing velocity?
Looking at our own data with a Pearson correlation coefficient we ended up finding a fairly small relationship between the stress metric and pitch velocity (through 114 pitches): .29 Rˆ2. Which was quite a surprising finding.
We can even take out the clear outliers (88.6 MPH at 36 Nm stress and 84.45 MPH at 30 Nm stress.) and the relationship only moves up to .32 Rˆ2 which is still surprisingly low. Looking closer you can see that the measurements of each pitcher are highly individualized. We saw a range of stress levels among our 17 pitchers from 30 Nm to 90 Nm.
This contradicts a commonly believed hypothesis that when comparing pitchers across a population the ones who throw the hardest also experience the greatest stress. We are only looking at elbow stress, this may not hold up when looking at both elbow and shoulder stress. But this is a very interesting finding nonetheless!
Looking further at our data we found small correlations between both MPH/Arm Speed (.13 Rˆ2) and Stress/Arm Speed (.02 Rˆ2). Even though there was a high range of mean stress readings (30 Nm – 90 Nm) the mean between all pitches was 61 Nm with a standard deviation of 15.7 Nm. All of our data is open-sourced, you can find it here.
Our data off the mound ended up being similar to the findings of the following study:
Correlation of Shoulder and Elbow Kinetics with Ball Velocity in Collegiate Baseball Pitchers (Open Access)
“Simple linear regression revealed very small Rˆ2 values, indicating that very little of the variance in joint kinetics can be explained by ball velocity…the correlations between ball velocity and both elbow-valgus torque and shoulder external-rotation torque were not significant”
This would suggest that mechanics and the role of the elbow musculature would play a bigger role in stress levels than currently believed.
One of the other more interesting findings was how much variance pitchers can experience themselves just throwing fastballs. Some pitchers were consistently in the same stress range others would have one or two strong outliers. Seeing these variations in stress readings can lead us in a few possible directions.
First the PULSE may occasionally get a misread, though we believe this is unlikely. Second the sensor placement may move after a certain number of pitches, throwing off the readings because of a change in location of the sensor. Third there could be small mechanical differences that are causing changes in metrics.
We lean strongly towards the second or third hypothesis. If you are going to use the PULSEthrow make sure, for reliability purposes, to remind the pitcher to check on the sleeve a make sure that the sensor is in the same position.
Update: Dr. Mike Sonne wrote a follow up blog post using our data. He found that removing the two pitchers who threw 6 pitches while only looking at the top 9 velocity throws from the original 15 pitchers the correlation between velocity and stress goes up to Rˆ2 0.32. Suggesting the relationship between stress and velocity is significant.
“In summary, pitch velocity shows a significant relationship with arm stress, using PULSE. If you throw harder, chances are, you will have higher levels of stress on your UCL. It is important to properly condition and be strong, so you can withstand these stresses. There are many other factors that go in to determining just how much stress is on the UCL, but these must be further studied by hard working groups like Driveline, and researchers in other facilities.”
Contradictions in Research: Stress and Velocity
At this time our numbers do not suggest a strong relationship between elbow stress and velocity but this conclusion contradicts other research, including some of our own.
- Dr. Mike Sonne found an Rˆ2 of .84 between pitch velocity and elbow stress using the data that we have. The data was collected on flat ground throws and not at maximum velocity.
- Kinematic and kinetic comparison of full-effort and partial-effort baseball pitching.
- Found a relationship between velocity and stress, but it’s unclear whether the differences were due to increased ball velocity or altered kinematics.
- Kinematic and kinetic comparison of baseball pitching among various levels of development.
- Had increased velocity and stress between various age groups. Kinematic differences were also present between the groups.
These studies are not clear if the increase in stress is due to velocity increases or changes in kinematics. So the relationship between velocity and stress is still incomplete.
Will higher Stress be more likely to Lead to an injury?
What we see so far is that the measurements that we are collecting do fall in line with some of the available research. So can we make the assumption that higher stress may be related to a higher injury rate? No because we still don’t know how the stress is distributed.
If you look at the last study listed in the earlier infographic comparing elbow varus torques you can see that they had a fairly interesting study comparing previously injured pitchers with a healthy control. 38 pitchers with no injury history compared to 39 who had UCL reconstruction in the last 4 years. There was no biomechanical or passive range of motion differences between the two groups and no significant difference in varus stress. In fact the mean varus stress of the two groups was the same, 99 Nm with the only differences coming in the standard deviation.
PULSE may enable us to collect enough data on athletes prospectively instead of retrospectively to reveal differences between elbow stress levels.
Training Purposes
At this point it is too early to tell what these numbers mean for training purposes. Especially considering there have been computer models that have found increasing muscle force can decrease the load on the UCL. If this were to occur while wearing a PULSE you would still see the stress metric, but have no idea if that number is keeping you healthy or risking injury.
It’s quite possible that you could strengthen the surrounding musculature have total stress increase but have stress specifically on the UCL decrease and have no idea. It’s also possible that stress being very low could be a good thing or an injury risk because that isn’t a high enough amount of force to protect itself over time.
At this time all of these are theoretical possibilities because we don’t yet understand how elbow load changes in response to specific throwing and training protocols.
Thinking about stress knowing there is a large unknown of the effects of strong or weak elbow musculature makes it clear that we can’t yet state what the ideal stress range is.
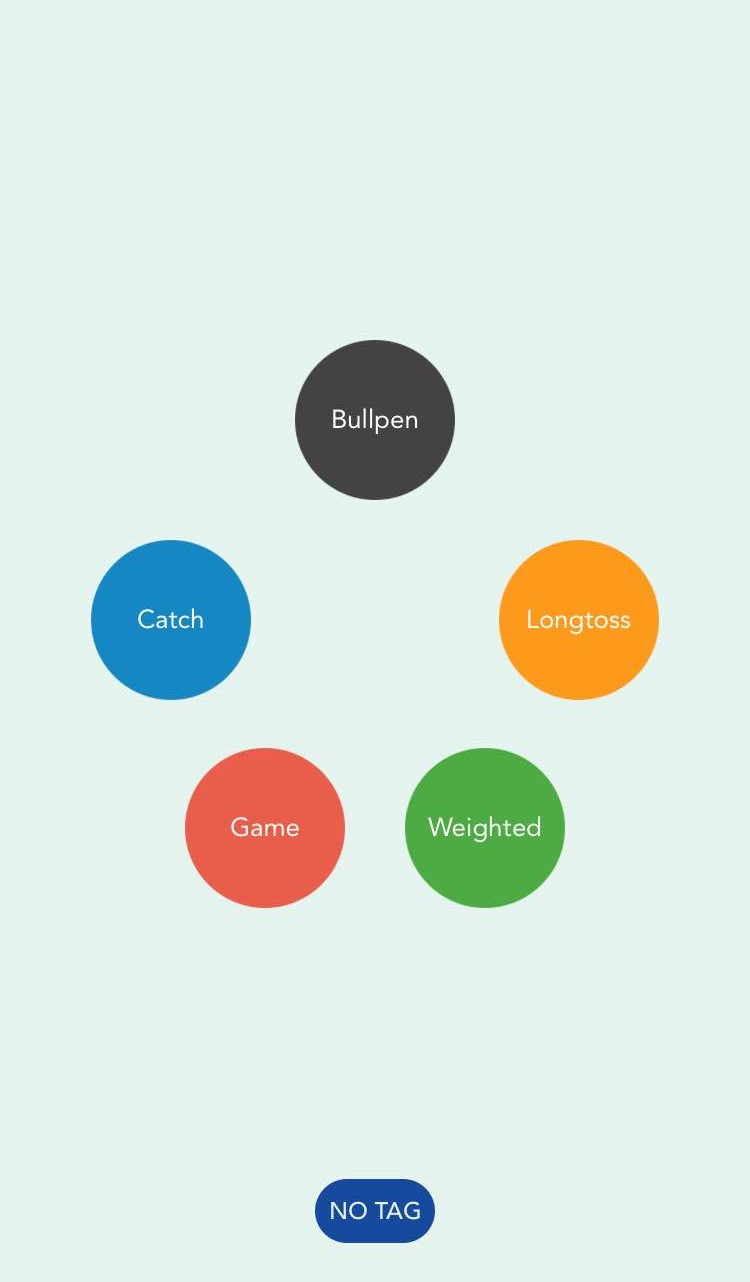
Best case scenario: keep collecting data under different training circumstances and see where it leads. This is what the PULSE enables us to do. You can wear the sleeve when you are pitching, throwing flat grounds, long tossing, using Plyo Ball ® and track progress over a period of time. We can then take this data, see how it changes under different training protocols and then get closer to understanding the true context of what it means. The PULSEthrow app also has options for weighted ball and long toss data collection. Growing the possibilities of trying different training protocols and their effects.
Summary
We know when peak stress on the elbow occurs. We have a tool that can accurately measure the stress and we have some context as to how those numbers compare to biomechanical studies. But we don’t exactly know how stress in either (PULSE or Lab) measurement is distributed between the UCL and surrounding musculature. Because of this the relationship between velocity and stress may not be a direct as previously believed because stress numbers can be altered by mechanics and muscle strength. This isn’t the time to make drastic decisions off of one session of readings. It’s the time to use this technology to track athletes as they progress over time.
This article was written by Michael O’Connell, who is our first analyst in the Research and Development department of Driveline Baseball. He and Stephen Hart (Driveline Trainer) collected the data and designed the study. This article was edited and approved by Kyle Boddy, President/Founder of Driveline Baseball.
Want to read more about the data-driven research we’ve got going on at our facility? Check out our research articles.
Comment section
Add a Comment
You must be logged in to post a comment.
Dave Perry -
I haven’t been able to find any research that identifies which phase of the pitch accounts for UCL tearing. Is that known, or assumed? A tennis serve looks very similar to a pitch in terms of maximum external rotation, yet tennis players rarely (ever?) need TJS. The abstract linked below notes a varus torque of 67.6 Nm during a tennis serve, which is similar to Driveline’s pitcher readings. Does gripping the racket add more musculature support to the elbow? Is UCL tearing actually occurring in a later phase of the pitch?
https://www.ncbi.nlm.nih.gov/pubmed/12801213
Driveline Baseball -
Right now it’s believed that peak Varus torque it often at Max External Rotation. It’s hard to pinpoint exactly when/where a tear occurs but probably closest to the moment of peak stress.
Unsure how gripping a tennis racket would affect the musculature support, though some believe that’s why tennis players don’t have as many UCL issues. The exact moment a tear occurs at is a good question though!
Weighted Baseball Research and the Data Supporting Their Use - Driveline Baseball -
[…] speaks more to the fact that we don’t yet fully understand the relationship between velocity and arm stress because there are so many variables to account for – also remember that there is no solved […]
Bullpens, Tracking Elbow Torque, and mStress - Driveline Baseball -
[…] This article builds on the previous research that we did with the MotusTHROW Sleeve that looked at the relationship between elbow stress and velocity. […]
YBE 079: Can Motus Baseball Help Improve Performance? - Youth Baseball Edge -
[…] Driveline endorses Motus Baseball to measure elbow stress […]