Quantifying Swing Decisions: An Individualized Approach
Overshadowed in an age of attack angles, launch angles, and bat sensors lies arguably one of the most fundamental, and perhaps misunderstood, concepts in all of hitting: swing decisions at the plate.
What’s the count? Who’s pitching? What’s the score? Where was the pitch located? What was the quality of the pitch type that was thrown?
All of these pieces of information (and more) can be considered by the batter when determining what to swing at. This is why identifying a correct swing decision requires a lot more context than what is initially perceived.
Foundations of Hitting
30 modules teaching you everything we know about hitting and hitting mechanics.
Is There an Expert Approach?
Given that batters must weigh several game-level factors while being challenged to hit a small white ball traveling at speeds well beyond what our eyes can track, it’s not surprising that research by Gray (2010) has found that expert batters have demonstrated an innate ability to decide when to swing relative to the general population.
But while expert batters are more capable of identifying strikes from balls compared to novices, the similarities among experts mostly ends there, because they also demonstrate a larger range of aggressive or passive tendencies at the plate relative to novices (Gray, 2010).
Assuming that the findings from Gray’s 2010 paper hold true on a macro level, it is likely that there is not one expert approach that every athlete should adopt. Instead, it appears that expert athletes functionally adapt their approaches and advanced strike zone awareness to best suit their playing styles, attributes, and individual needs.
As coaches, trainers, and analysts, the real challenge then becomes measuring which batters have developed more efficient tendencies that best suit their hitting abilities and which have not put themselves in the best position to succeed.
Thus, in this blog post, we work to develop a framework that attempts to measure a batter’s ability to decide when to swing at the big league level—independent of individual player tendencies. The hope is that we’ll not only develop a better metric for evaluation purposes, but also apply some of the methods and findings discussed here with our own hitters as well.
Become the Hitter You Want To Be
Train at Driveline
Building an Approach Metric: What Has Been Done Before?
On the path to assessing swing decisions, analysts have most frequently leveraged Fangraphs’ plate discipline statistics to measure the rate at which batters make good decisions at the plate (swing at strikes / take called balls) relative to bad ones (swing at balls / take strikes).
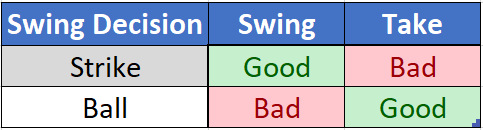
(We often determine whether swing decisions are good or bad based on whether a pitch was a strike or a ball, as shown in the four categories above. We argue that this classification method ignores valuable information and can be improved.)
This common four-category approach used to measure a player’s swing decisions certainly has had value in allowing the public to separate the best batters from the worst in terms of plate discipline. However, simply breaking down pitches by whether they are balls or strikes inevitably ignores valuable context when measuring swing decisions, unfairly debiting or crediting certain hitters over others depending on style, approach, and talent level. Consider the following:
– These methods treat a 3-0 pitch swung at on the outer corner as a good decision, whereas a 3-0 take down the middle as a bad decision.
– These methods give equal credit to a batter who swings at a pitch inside the zone compared to taking a pitch outside the zone despite having no evidence that these decisions provide equal value to the hitter.
– These methods give all or nothing credit to a batter for swinging at or taking a pitch on the outer portion of the plate when at the moment a batter must decide to swing, called strike probability, is neither 0% nor 100%.
– These methods do not consider the specific pitch location preferences of the batter, nor do they consider his talent level.
– These methods ignore all game contexts and different pitch types.
(Given the limitations above, we find that swinging at more strikes leads to no uptick in performance at the big league level.)
When considering these shortcomings together, it’s clear that we can and should do better when attempting to identify who is the most efficient in deciding when to swing.
A Better Attempt at Quantifying Swing Decisions
We haven’t been the only ones to recognize the limitations with current plate discipline metrics. Stephen Loftus of Beyond the Box Score created a metric titled wDiscAA, which considered the count, pitch type, and location of a pitch to approximate the likelihood that a league-average batter would swing at a given offering. With more granular approximations that controlled for myriad issues that traditional plate discipline metrics have typically ignored, Loftus’s wDiscAA was able to give batters proportional credit for making the correct swing decision at the plate, better attributing deserved credit in the right context.
(League-wide called strike probability from Loftus, where dark red indicates a high likelihood of a strike, and yellow indicates a high likelihood of a ball.)
While these methods were a significant improvement over other public metrics, wDiscAA still suffered from three main limitations worthy of mentioning.
For one, wDiscAA was set to be a cumulative statistic rather than a rate statistic. So, more talented batters who received more plate appearances in a given season ended up toward the top or bottom of the leaderboard.
Second, wDiscAA credited a player’s decision to swing relative to league-average behavior and not the preferences of the batter himself. So, if a batter often swung at a specific pitch in his nitro zone (say at the knees), he would not receive credit for this optimal behavior if the league did not share this preference.
Lastly, wDiscAA did not account for a player’s Z-Contact%, which means that the metric, similar to simple plate discipline metrics, likely preferred hitters who were more aggressive in the strike zone.
Intuitively, this may seem like a positive trait since swinging at strikes is typically considered a good quality to have. However, because batters who have high a Z-Contact% are afforded the opportunity to be more selective in looking for “their” pitch deeper in the count (since they are less likely to swing and miss at a pitch inside the zone for a strike out later in the AB), they are punished for taking a higher propensity of strikes in the strike zone compared to batters who have a low Z-Contact% and must swing at the majority of pitches in the zone to avoid striking out.
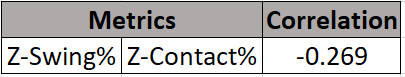
(Interestingly, a correlation of Z-Swing% to Z-Contact% shows that MLB batters have mostly adapted the rate at which they swing at strikes based on their ability to make contact, generating a highly specific approach at the plate.)
Creating Our Own Swing-Decision Metrics
With a clear need for a refined and updated swing-decision metric in the public realm, we decided to use our Statcast database to generate three different metrics: a simple framework (Simple Approach) that can be applied in less technical setting, a moderate framework (Adjusted Approach) that controls for more context, and a complex framework (Swing Decision+) that leverages Loftus’s methods on a more individualized scale.
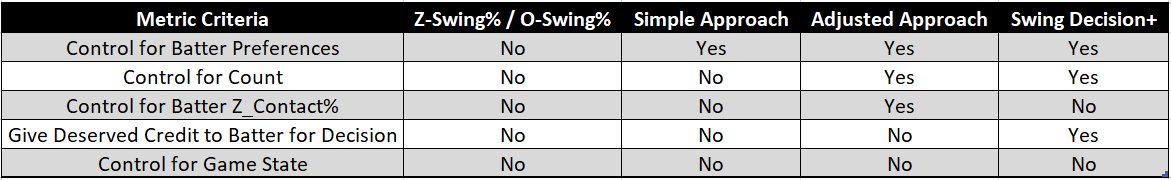
(The table above lists the five main considerations when analyzing swing decisions and whether each metric controls for each criterion.)
To begin analyzing swing decisions on an individual level, we first turned to the work of Jeremy Greenhouse, who built a framework to model the expected run value of when a batter swings at a pitch at a given location in comparison to when he takes.
Using Greenhouse’s methods as a blueprint, we created a custom swing-decision matrix for every player season with >100 balls in play (BIPs) from 2015 to 2018 by modeling the intrinsic run values (rather than basic run values) on a swing-and-take condition for each player season in our database.
After fitting estimated run values for a hypothetical swing or take for every pitch thrown since 2015, we subtracted the “take” intrinsic run value estimate from the “swing” intrinsic run value estimate, leaving us with what we call Swing Run Differential, or the estimated intrinsic run value of a batter’s swinging at a pitch relative to taking it.
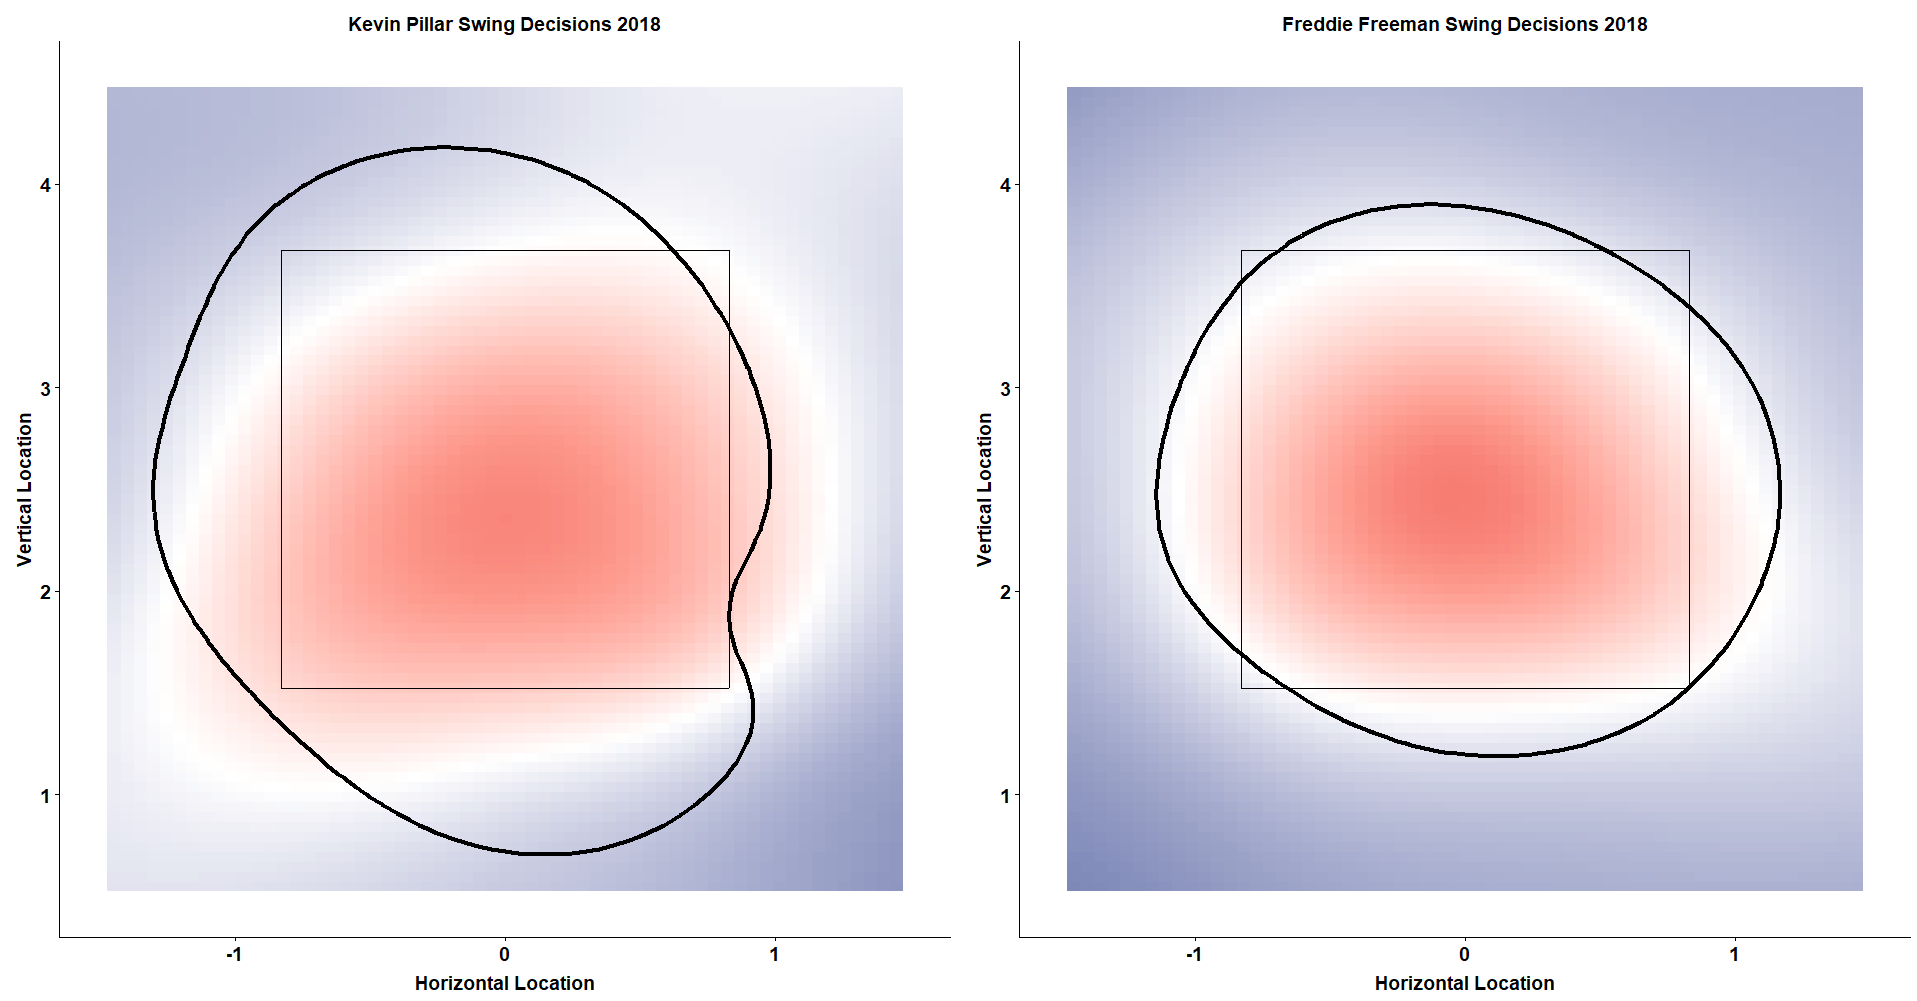
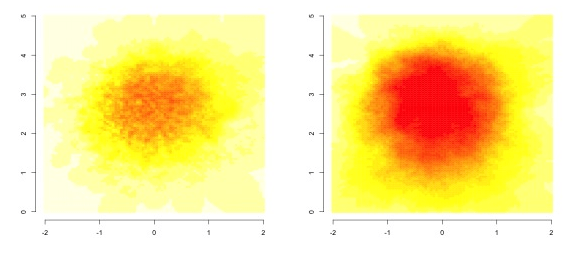
Similar to Greenhouse’s results, if a pitch was located in an area that had a positive Swing Run Differential (as shown in red below), a batter was estimated to be more productive when swinging at that pitch. If a pitch had a negative Swing Run Differential (as shown below in blue), a batter was estimated to be better off taking that pitch instead.
(These two heat maps show the Swing Run Differentials of Kevin Pillar [left] and Freddie Freeman [right]. Locations in red indicate where each batter performs best when swinging, while locations in blue indicate where each batter performs better when taking. The black circle is an estimate of their 50% swing probability. As one can see, Pillar is much more likely to swing at pitches he should take relative to Freeman.)
A Simple Approach Metric
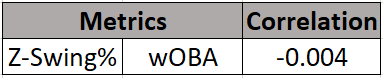
Given a more individualized way to disseminate when a batter should swing and when he should take, we first wanted to see whether these customized zone metrics could outperform traditional Z-Swing% and O-Swing% at measuring plate discipline.
To compare, we created simple “should swing” (pitches with a >.05 Swing Run Differential) and “should take” (pitches with a <-.05 Swing Run Differential) buckets that were designed to isolate when each batter should hypothetically swing ~100% of the time and ~0% of the time, respectively, regardless of context in order to optimize their swing decisions.
After bucketing pitches and obtaining the swing rates of each batter by bucket type, we divided a player’s Should Swing% by Should Take% to weight Should Take% more heavily in our overall Simple Approach metric. (This is to account for the fact that chasing a bad pitch is almost always a bad decision, whereas taking a pitch over the middle of the plate may not always be the incorrect choice in specific situations.)
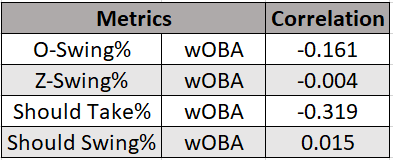
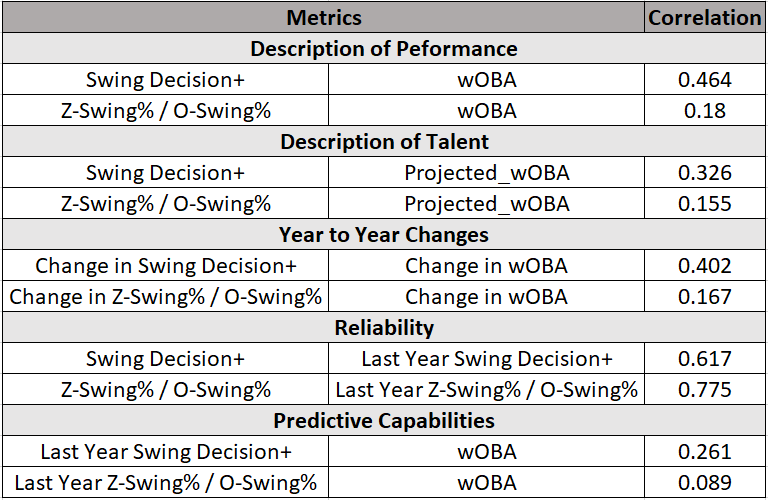
With our simple framework set, we divided Z-Swing% by O-Swing% to obtain a baseline “naïve” metric for comparison purposes and generated the results below.
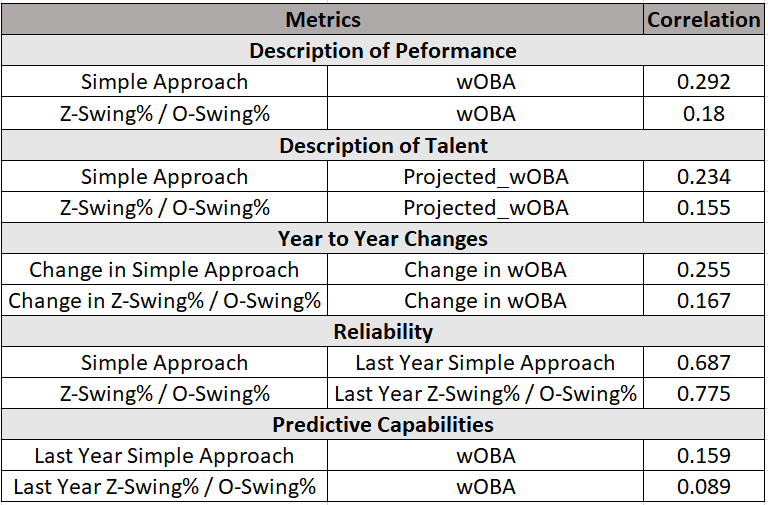
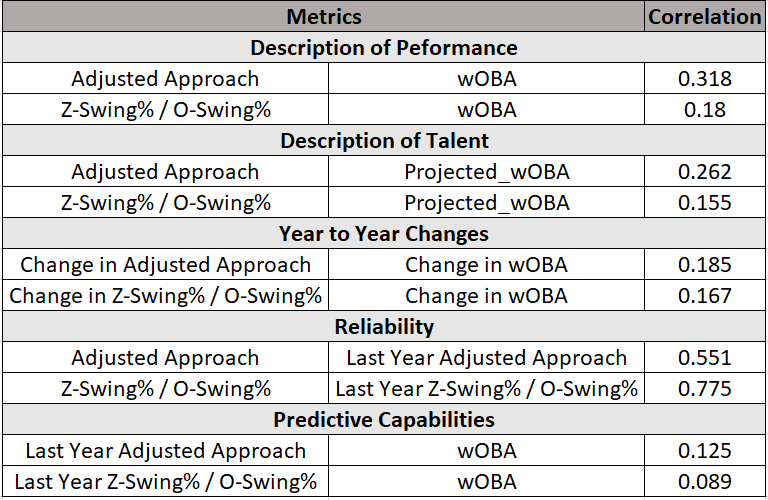
Initially, we see a couple of interesting correlations that stick out from the rest. For one, our Simple Approach metric more accurately describes batter performance and talent than the baseline metric and performs better in predicting next year’s wOBA as well.
Further, a year-to-year improvement in Simple Approach also better correlates with a year-to-year improvement in wOBA relative to Z-Swing / O-Swing, giving us more confidence that we’re measuring something tangible regarding swing decisions.
But while everything with Simple Approach appears fine on the surface, a closer investigation as to why our metric performs better than Z-Swing / O-Swing reveals some shortcomings.
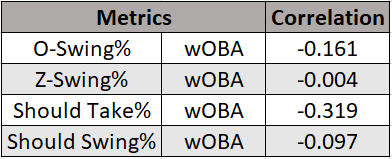
Looking at the table above, we see that Should Take% has a relatively strong negative correlation with wOBA compared to O-Swing%, which is what we would expect given that swinging at bad pitches is considered detrimental to performance; however, Should Swing% actually has a negative correlation with wOBA as well. Meaning, as batter production increases, the swing% on pitches we believe batters should be swinging at actually decreases.
After taking a closer look at why this reverse correlation might exist, we identified three potential reasons.
First, because a swing is worth more than a take for better batters when compared to worse batters, it is likely that our most talented players in our sample have a greater amount of plate locations that are classified as “should swing.” Since these additional plate locations are likely outside of a batter’s nitro zone, the Should Swing% of elite batters likely drops, contributing to the slight negative correlation between production and Should Swing% we see above.
Second, because better batters also end up ahead in the count more often, leading to a more selective approach on pitches that our model thinks a given batter should swing at, Should Swing% is again biased against more talented batters.
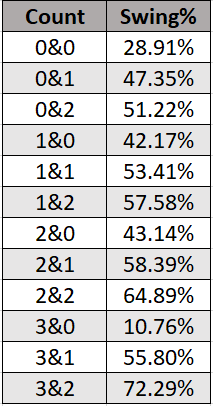
(Swing% by count during the 2018 season.)
Last, because a batter’s Z-Swing% is significantly correlated to his O-Swing%, really good batters with a high Contact% tend to have a lower Swing% than worse batters, even against pitches that are classified as really good to hit.
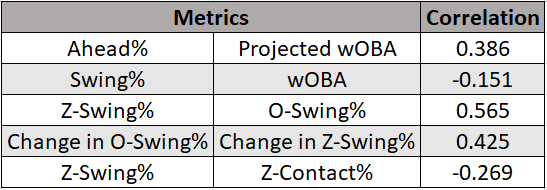
(Better batters end up ahead in the count more frequently and swing less frequently compared to lower performing batters. Z-Swing% and O-Swing% are closely related to one another, and as either metric rises or falls, so too does the other.)
While taking hittable pitches might be a net negative for any batter, the tradeoff that exists between not swinging at good pitches to hit and avoiding chasing bad pitches can be a worthwhile one for high Z-Contact% batters (as briefly mentioned above).
So, with these caveats in mind, we found it quite obvious that controlling for additional context was necessary if we wanted to create a more valuable swing-decision metric.
A Moderate Swing-Decision Metric
To build on our simple methods, we decided to adjust each player’s Should Swing% to account for both how often a batter was ahead in the count relative to league average, as well as his propensity to make contact in the zone when swinging relative to league average.
With these adjustments applied, our new Adjusted Approach metric demonstrated a slightly greater ability to describe performance and talent, while the correlation with Should Swing% and wOBA improved to a robust .01 in our sample. (Just kidding on the robustness, but at least it is positive this time!)
Despite the improvements, the descriptiveness added to Adjusted Approach came at the expense of lower reliability and predictiveness, likely because a player’s Z-Contact% and Ahead% fluctuates on a year-to-year basis, making Should Swing% more volatile.
Although our fairly simply swing-decision metrics fare reasonably well against the baseline, we felt that there was still room to improve with more rigorous methods.
A Complex Swing-Decision Metric
Thus, we decided to integrate our Swing Run Differential metric with the aforementioned work of Loftus to build a model that calculated swing probability based on a pitch’s Swing Run Differential and the count it was thrown in.
With our new model built, we fit each pitch in our dataset with a swing probability estimate based on league-average swing behavior and batter-zone preferences (which inherently consider a batter’s specific called strike probability), subtracted 0.5 from each estimate to zero out a 50% swing probability (when a batter should be indifferent to swinging), and multiplied this number by -1 if a pitch was taken.
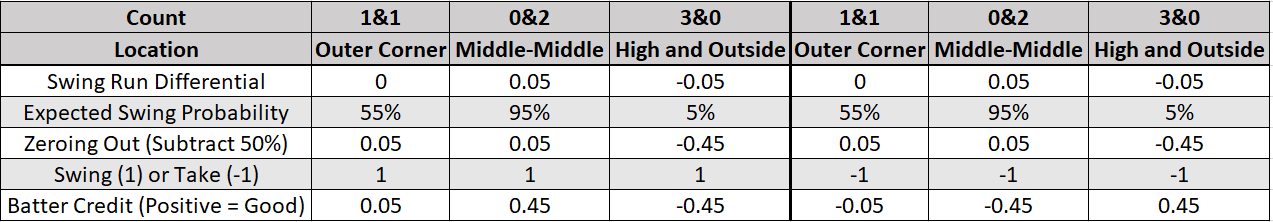
(These three pitches both when a batter swings [left] and takes [right] shows how Swing Decision+ credits or debits a batter for a swing decision. 50/50 choices are worth very little, while obvious swings and takes are worth significantly more.)
Rather than summing these totals together by player, we averaged them on a per-pitch level. We also elected not to weight swing decisions by count and transformed our values to be on a “plus” scale for easier interpretation.
As we can see from the 2018 leaderboard provided below of Swing Decision+, there are some familiar faces that score among the best and worst, albeit in a different order than most traditional plate-discipline leaderboards typically provide.
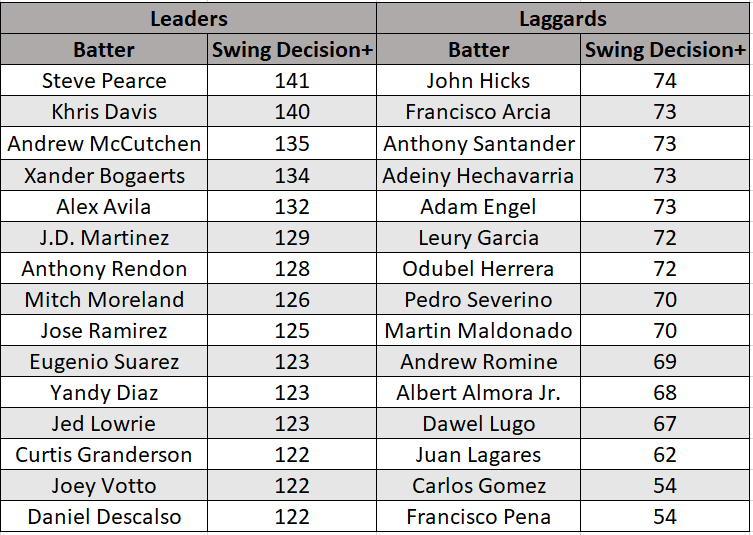
(The 2018 leaderboard shows that Steve Pearce had the best swing decisions (141 = 41% above league average) among players with >100 BIPs. Francisco Pena had the worst swing decisions in 2018 according to Swing Decision+, performing 46% below league average.)
When we compare our new swing-decision metric to our simple and baseline approach metrics, we see much higher descriptive and predictive capabilities of performance and talent across the board. More importantly, we also see that as a player improves his own Swing Decision+ from year to year, he also improves his wOBA by a significant level as well. Meaning that even when we control for a batter’s talent in the year prior, an improved Swing Decision+ still equates to better production in the following season.
By taking an individualized approach to measuring swing decisions that gives batters deserved credit on a per-pitch basis and controls for batter preference and count, it does appear as though we’re able to do a much better job at measuring a player’s ability to make the correct choice at the plate.
Still Room to Improve?
That said, we still believe Swing Decision+ has a few limitations in its current form that can be addressed in future iterations.
For example, better batters will still have a larger expected swing probability compared to worse batters if we hold all other context equal, because Swing Run Differential will always be larger for better batters at most pitch locations. Fortunately, this bias is somewhat offset in the current version of Swing Decision+ since better batters see more pitches outside the zone, which typically have a low swing probability regardless of talent. That said, controlling swing probability for batter talent should provide a slight improvement to Swing Decision+ moving forward.
(Better batters see less strikes, on average.)
Swing Decision+ also fails to directly consider pitch type and relevant game context such as the base state and score. This is likely low hanging fruit for future improvements.
The Importance of Individualizing an Approach at the Plate
In practice, a specific approach based on an individual’s underlying results is rarely designed for a player in today’s game. Instead, players are typically exposed to overarching team and organizational-wide philosophies based on a hitting coach’ or coordinator’s personal beliefs regardless of whether that approach fits the player’s needs.
In attempting to create a better swing-decision metric at the MLB level, we believe we have highlighted the importance of individual considerations when analyzing a batter’s approach. In an era where data is now ever-present in making specific considerations to an athlete’s training plan, we probably can and should be thinking about what information we are weighting when providing an athlete advice on what to look for and when to swing.
Moving forward, we believe that a better strategy on how to improve an athlete’s approach likely starts by considering heat maps, Z-Contact%, chase rate, and how all of those things interact with one another before evaluating and suggesting adjustments to a given player.
As has been shown in previous research, hitting coaches can have a significant influence on the selection of pitches batters swing at the plate, so we should not overlook the impact that a refined approach can have on player performance. Given that the best players in the game have seemingly adapted their approach to best match their skills, it should be a point of emphasis that we try to get all of our players to do the same.
Train at Driveline
Interested in training with us? Both in-gym and remote options are available!
- Athlete Questionnaire: Fill out with this link
- Email: [email protected]
- Phone: 425-523-4030
This article was written by Dan Aucoin, Research Analyst in R&D
Comment section
Add a Comment
You must be logged in to post a comment.
Matt -
I think this is clearly a pathway; I also felt as though college teams + will benefit from this data; especially if a data scientist or data analytics resource (human or App) can do the heavy lift of capturing, normalizing and applying these formulas/methods to an athlete. Outside of college +, a team could benefit from applied analytics but how can this type of modeling and enriched data “context” be applied for teams below collegiate or those that do not have resources? I think this should be packaged and combined with available measuring programs/aids to add value to academy or school programs.
dan1 -
Thanks for the comment, Matt. Of course, as you add layers of complexity to a given metric, its application to lower levels of play tends to dwindle a bit given the tech limitations. The rationale behind including the Simple and Moderate Approach metrics within the piece was to lay out what should be considered when differentiating a good swing decision from a bad one. At the lower levels, you could have someone chart games to obtain contact% both within and outside the zone, player “nitro zones”, the count of a given pitch, pitch type, etc. and then determine whether a batter made a good or bad swing decision on a per pitch basis. Definitely a lot of heavy lifting needed, but having Trackman or Pitch Fx isn’t an absolute necessity to institute something a bit more specific for an individual batter. Hope this makes sense, and you can forward any additional questions to my email [email protected]