A Look at Long Term Weighted Ball Research
Weighted balls continue to be a hot topic of discussion in baseball. We’ve written about weighted-ball research before, and with new research coming out recently, we felt it was time for another update.
How We’ve Gotten Here
Many years ago, a number of studies looked at weighted balls and how using them affects velocity. The results were positive.
In 2016, there was finally a biomechanics study on weighted balls that looked at the differences between throwing 4- to 7-ounce balls off a mound and while pulling down.
The publication of Glenn Fleisig’s study on 4- to 7-ounce weighted balls was well received. We were able to learn something new about them rather than just training results.
The natural next step is to look at longer-term studies using heavier weighted balls with a wider range of programming. However, this is far more difficult because there are so many different combinations of ball weight, intensity, and frequency—not to mention work outside of throwing; mobility and strength work matter too.
The good news is there are a couple of studies looking at using heavier weighted balls in training programs.
Today, we examine one paper, one thesis, and one presentation on using weighted balls in training and conclude with some take-away lessons from reading them.
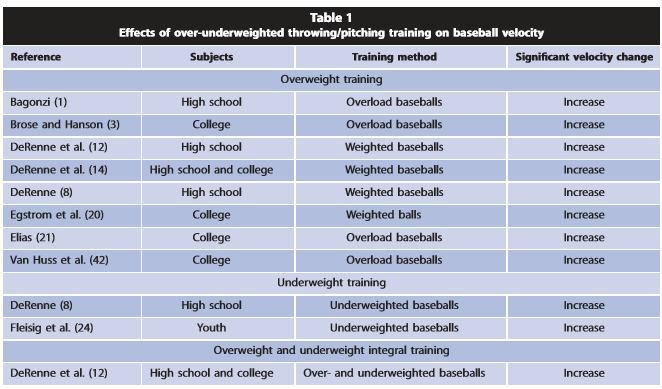
Effect of a 6-Week Weighted Baseball Throwing Program on Pitch Velocity, Pitching Arm Biomechanics, Passive Range of Motion, and Injury Rates
M Reinold, L Macrina, G Flesig, K Aune, J Andrews
First Published June 8, 2018
What the Researchers Did
This paper took 38 athletes, between ages 13 and 18, and randomly assigned them to either a control group, which did a throwing program with only regular 5-oz baseballs or a weighted-ball group, which had pitchers complete the same throwing program as the control group with additional weighted-ball training.
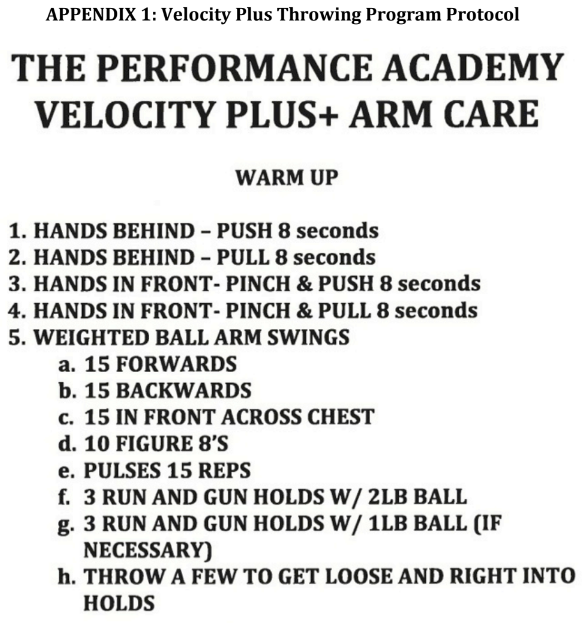
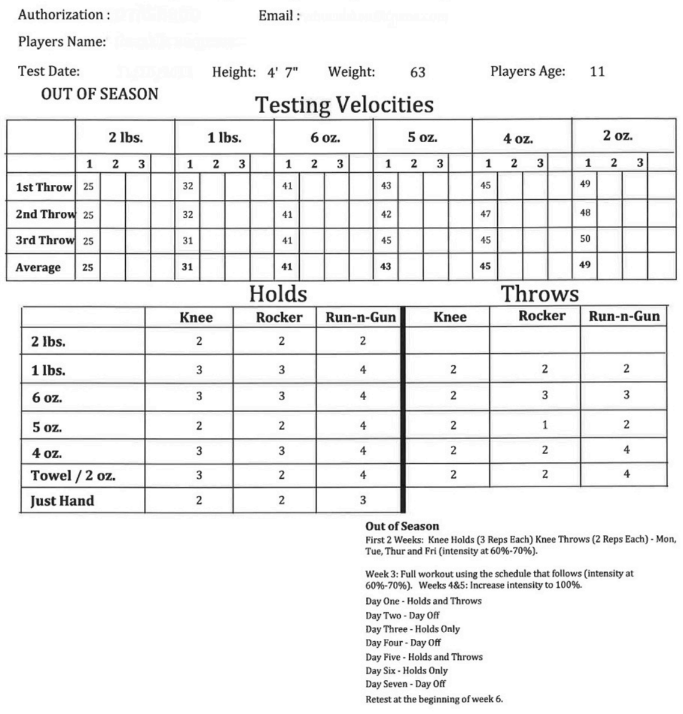
The weighted-ball program followed is shown below using balls weighing 2, 4, 6, 16, and 32 ounces. Three drills were performed with each ball weight: Half Kneeling Throws, Rocker Throws, and Run and Gun.
The weighted-ball group performed the outlined repetitions with a 10-second rest between sets. The control group was instructed not to throw any under- or overload balls during this time.
Before and after the 6-week training period, pitch velocity, shoulder and elbow passive range of motion, and shoulder strength were measured. In each groups’ pre and post bullpens, the Motus sleeve was used to measure elbow torque (or stress, as Motus calls it) and arm speed.
What Were the Results?
These are the big ideas from the results section:
- Pitch velocity showed a statistically significant increase (3.3%, P < 0.001) in the experimental group (WB group) .
- There was a statistically significant increase of 4.3% of shoulder external rotation in the experimental group (WB group).
- The overall injury rate was 24% in the experimental group (4/17, 2 athletes were removed for other injuries). Of those 4 injuries, two occurred during the training program and two in the season after training. No pitchers from the control group were injured.
Both groups showed an increase in pitching velocity, but the weighted-ball group showed the larger increase.
Both groups showed an increase in elbow torque (as measured by the Motus sleeve). Interestingly, the control group had a larger increase in elbow torque than the weighted-ball group, but the difference was not significant.
We have used the Motus sleeve to measure bullpens, and our numbers have been higher than those published in this study. This is most likely because our velocities were significantly higher.
In theory, an increase in elbow torque puts a player at a higher risk for injury. However, the control group did not experience any injuries.
Arm speed increased for the control group and decreased for the weighted-ball group. As we have mentioned earlier, the Motus unit sits on the forearm, meaning it cannot directly measure internal rotation. At times, arm-speed measurements can change per pitch, as we’ve seen before. Because the sensor sits on the forearm, it can change based on the velocity of forearm rotation.
The athletes also performed a baseball-specific strength and conditioning program, specifically focusing on strengthening the external rotators. The external-rotation strength of the control group increased, whereas the training group showed no change.
The Effects of a Baseball Throwing Velocity Improvement Program on Shoulder Range of Motion (Thesis)
C Rodrigo (Under the direction of Joseph B. Myers, Elizabeth E. Hibberd, and William Burniston)
First Published: 2014
What the Researchers Did
The researchers wanted to specifically examine the effects on range of motion of a weighted-ball throwing program. This study included a control group and a group participating in the weighted-ball throwing program. The researchers were blinded to the group assignments of the participants.
Post-testing data was collected on 32 individuals: 20 in the control group and 12 in the intervention group. These 32 were from an original group of 57 baseball players between the ages of 8 and 17. Of the participants, 47% indicated that their primary or secondary position was pitcher. The study started off with a higher number of participants but a number dropped out. Reasons for leaving either group were not tracked.
The program lasted 10 weeks. The players in the weighted-ball group threw four days a week: two days under staff supervision at a training complex and two days on their own. The throwing programs were individualized for each athlete.
Although the throwing programs were individualized, the researchers did include general guidelines that the throwing program followed.
What Were the Results?
After the 10-week period, the only significant difference between the weighted-ball group and the control group was that the weighted-ball group showed a significant decrease in Dominant Arm Total Arc of Motion of 16.4 +/- 11 degrees. The control group showed a mean decrease of 6.2 +/- 13 degrees.
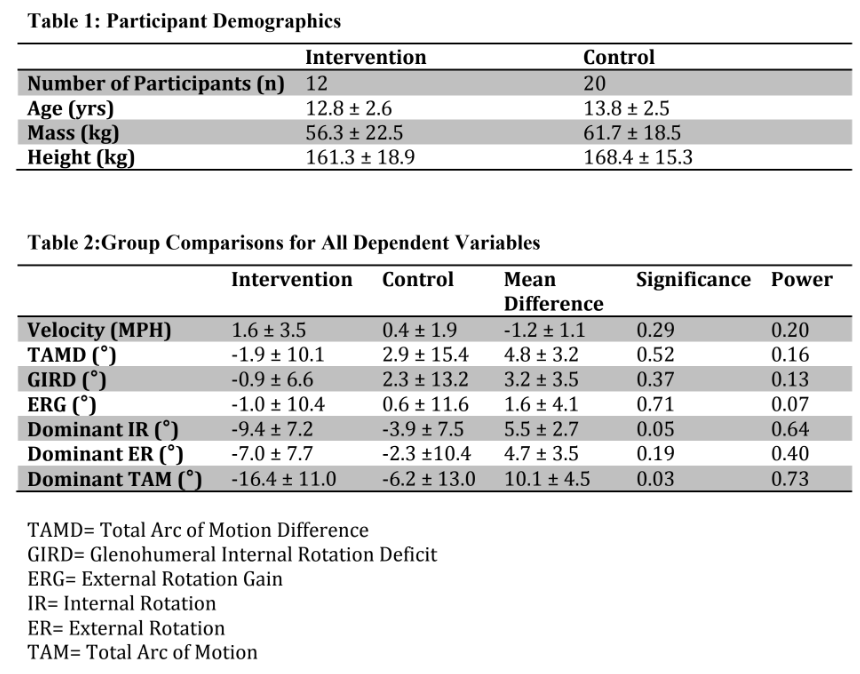
No significant differences between groups were present in the change scores for velocity, TAMD, GIRD, ERD, Dominant IR, or Dominant ER. This program did not include a specialized stretching routine; players may have stretched on their own, but they were not given targeted exercises.
The researchers mentioned several limitations, including the wide age ranges: 10-17 years old for the control and 8-17 for the intervention/weighted ball. There were also unbalanced groups, with 12 athletes in the intervention group and 20 in the control group.
They also said that alternative workouts, either lifting or other baseball work, may have been conducted during this time and affected the results. Finally, the researchers noted that the findings had low statistical power, in part because of the small sample size and the large number of participants unable to complete the study, for a variety of reasons.
Effects of Velocity, Distance and Shoulder Range of Motion in Two Throwing Programs
D Peters, H Maliska, E DeLeon, S Coste
Presented: 2018
*Note: The summary below is from a conference presentation, not a paper, so the analysis is shorter.
The study involved 20 college baseball players aged 18 to 22. The players had their maximum throwing distance measured, as well as their throwing velocity, shoulder range of motion abduction, flexion and external rotation. After the initial screening, players were randomly divided into two groups: a weighted-ball group and a long-toss group.
The weighted-ball group performed the following program three times a week:
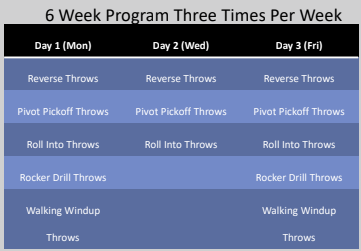
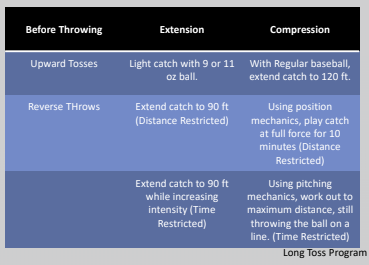
The long-toss group performed the following program three times a week:
What Were the Results?
Throwing distance improved in both groups, as did range of motion; however, there was no significant difference in velocity. The long-toss group also showed the greatest increase in distance and range of motion.
The researchers also noted several limitations to the study in addition to the relatively small sample of each group: The post testing had drastically varied weather when compared to the pre-test, especially wind. The range of motion was measured by different researchers pre and post test that could have increased the error of the measurements. Internal rotation ROM was not measured, so we can not tell if there was a change in total range-of-motion. Lastly, because this is a presentation, the exact distances and measurements are not listed.
Lessons Learned: What We Can Take From the Research
Each of these has its own strengths and weakness. But after reading each of them, there are still some lessons we can take, along with better questions we can look to answer in the future.
Too Many High-Intent Days
The first and second study supports what we have mentioned previously: doing more than two high-intensity days is too many.
High-intent weighted-ball training should at minimum be considered as much, if not slightly more, work than a bullpen.
This means that high-intensity days should be planned appropriately and without excess. High-intent weighted-ball training is a good example of something where more does not mean better.
Don’t Overlap Throwing Programs
One thing we wish the first study mentioned above had had was more information on the non-weighted ball throwing program. Whether or not we look to high-intent training with weighted balls or just for warm-ups, there needs to be a balance in throwing loads appropriately. This is especially true for high-intent throwing.
You wouldn’t find two 5-oz throwing programs and do them simultaneously, so you shouldn’t take a 5-oz throwing program and overlap that with a high-intent weighted ball program.
Weighted balls as a warm-up can be introduced along with a throwing program that includes bullpens and long-toss. However, that requires athletes to treat warm-up throws as a warm-up, so they don’t blow it out because they feel good. Second, it requires some reduction in throwing of regular baseballs before bullpens, simulated games, or long-toss.
The first 6-week study had a control-group throwing program and a weighted-ball group that did the control group’s throwing program and the weighted-ball throwing program. There isn’t any information on what the control group program was, so all we can tell is that the weighted-ball group had more volume because they did both.
Overall Training Economy Needs to Be Managed as Well: Multiple Variables to Consider
When we talk about training economy, we are saying that everything an athlete does needs be accounted for; otherwise, you run the risk of fatigue or, worse, injury.
The first study mentioned found that ER strength stayed the same in the weighted-ball group but increased in the control group. Both did a baseball-specific strength program that focused on strengthening the rotator cuff, particularly the external rotators.
The no-change in the weighted-ball group, while showing an increase in the control group, may be attributed to the weighted balls requiring too much shoulder work on top of the shoulder program. It’s possible that ER strength of the weighted-ball group might have increased if the throwing volume of the weighted-ball group was decreased or the volume in the weight room and shoulder program was decreased.
We can make the example a bit simpler. Let’s say you have a high school athlete who needs to improve his squat. He’s never really squatted before, and since this is some simple mobility work, he’ll be doing front squats twice a week. Monday is a heavy day, with Friday as a lower volume and weight day to help groove the pattern. This, at the very least, should help him improve, but there can also be the risk of too much work.
Doing back squats on Monday, Zercher squats on Wednesday, and front squats on Friday with superseded goblet squats in between sets and a finisher of 100 bodyweight squats after each day is probably too much.
This means that the programming of what you are trying to improve matters a lot, whether throwing or weight room specific.
The programming of how every piece fits together is the key. This is especially true of the arm.
The second and third studies focus largely on the sets and reps on the weighted balls, but they provide little information on other throwing or weight-lifting work.
Lifting and mobility training all play a part in an athlete’s range of motion and velocity work. They should be accounted for whenever possible.
Range of Motion Questions
Counterintuitively, the first and second study had range of motion findings that were opposite of one another. (We’ll leave out the third study for now because the full numbers are not available, internal rotation was not measured, and two different researchers measured the pre/post tests.)
Both gaining and losing too much range of motion can be negative. Research shown that range of motion changes after one outing, after a season, while doing a warm-up, and while doing specific stretching.
Ideally, the full individual numbers would be available so we could see how high the outliers were compared to the average (the first study mentioned that two athletes who got hurt gained 10, 11 degrees of ER) in order to see if there were any commonalities, so those athletes with similar attributes could be, at minimum, screened away from that programming.
Screen Your Athletes: Researcher and Coach Differences
Finally, two of these studies (the first and third) had groups randomized into throwing groups. While this makes good sense from a research perspective, it makes little sense from the realities that coaches and players face.
From a coach’s perspective, he wants to take in information about a player and set him up with the best set of tools or variables available to succeed.
Not discussing these differences in approach is one of the reasons why we usually end up with researchers and coaches talking past one another—both with legitimate gripes:
- Researchers complain, “Ah, but how do you know of X is actually what made them better when you have all these variables.” This is true.
- Coaches might look at a group of athletes and say, “Based on X, Y, and Z that athlete should be focusing on X in practice not Y. Otherwise he’s not being set up for success.” This is also true.
Training decisions should be made based on screening. The more impactful research is going to be through communicating certain characteristics and showing coaches what to look for and what interventions can help them.
This means researchers need to realize that randomizing participants may not be the best approach, and they should loop in coaches on other ways to screen athletes. Coaches also need to get more specific in screening and tracking so they can help researchers see what real-life interventions are occuring.
Training decisions should be made based on screening. The more impactful research is going to be through communicating certain characteristics and showing coaches what to look for and what interventions can help them.
This means researchers need to realize that randomizing participants may not always be the best approach, and they should loop in coaches on other ways to screen athletes. Coaches also need to get more specific in screening and tracking so they can help researchers see what real-life interventions are occurring.
Conclusion
We’ve taken something away from each study mentioned today. However, it’s important to note that we still have a lot of work to do in the future. Much of this work will not be on individual items, such as weighted balls, but how multiple items interact with one another.
This idea stems from dynamic systems theory and the idea that we are looking at the interaction of systems with one another, not trying to change something from the top down.
The truth is that while we want to highlight this one mechanical position or a certain training tool as important or not, there are serious limits to eliminating other variables. Real life is all about the interaction of a large number of variables. Knowing that athletes may have 10 important variables, focusing on 4 of them, and claiming 1 of them is bad leads to serious limitations regardless of what that one thing is.
Acknowledging and attempting to measure the effects of how different variables interact is incredibly difficult, but if we don’t start trending in that direction, then we run the risk of claiming findings that make sense in a vacuum but fail in the real world.
This is why we push for open and as much data as possible so we can not only study the averages but also the outliers—along with getting better ideas of what pieces work or don’t work well together.
A Pitching Mechanics Example:
Single variable take: Position X results in elbow torque 1 standard deviation higher than the mean.
Multivariable take: Position X, along with positions Y & Z, results in elbow torque 2 standard deviations higher than the mean.
Or
Position X, along with A & B, results in elbow torque at the mean.
A Training Example:
Single variable take: Introducing X into a training program resulted in no change in velocity and no change in injury rate; therefore, it is not useful.
Multivariable take: Throwing program X along with weight-lifting program Y and mobility program Z resulted in no change in velocity and no change in injury rate.
Or
Multivariable take: Throwing program X along with weight-lifting program A and mobility program B resulted in increased velocity and no change in injury rate.
Acquiring a better knowledge of how different pieces layer with each other is the key to the future of understanding how to increase velocity, get better performance, manage fatigue, and reduce injury risk. It’s much harder to do, but it is vital to helping get more research applicable to coaches.
This article was written by Research Associate Michael O’Connell
Comment section