Pitch Design: What is Stuff+? Quantifying Pitches with Pitch Models
By Chris Langin, Pitching Trainer
The art of “pitching” has many variables associated with it, some easily quantifiable and others not so much. Every pitcher, coach, and organization is constantly in a battle of weighting these variables in a manner that maximizes development and performance on the field.
While there is little agreement on how important “secondary” variables such as deception and sequencing are towards generating outs, it is generally accepted that three pitcher talents stand out above the rest.
The ability to:
- Command the baseball.
- Generate ball velocity.
- Manipulate the baseball and acquire unique movement on pitches.
These three traits come with the bonus of being rather easy to quantify at the MLB level. We don’t necessarily need a radar gun, nor a pitch model (explained below) to let us know that Aroldis Chapman has a good fastball.
However, given the innate bias associated with human evaluators, it’s likely that a pitch model can more reliably detect a 40-grade fastball from a 45-grade one than an evaluator working alone and without data. Ideally, the combination of strong baseball savvy mixed with a well-regarded model grants us the most optimal evaluation of location agnostic pitch quality.
Stuff+ Driveline’s Pitch Model
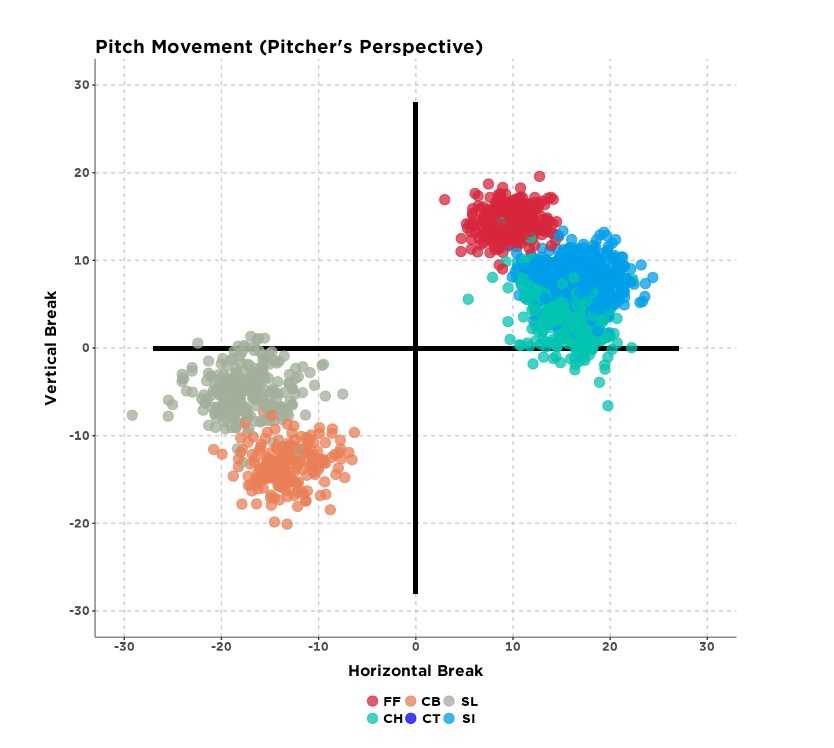
The Pitch Model we reference at Driveline is known as “Stuff+” and is currently going through it’s 4th iteration. As mentioned above, the model filters out plate locations (thus characteristics of command which is measured in a separate metric) and primarily concerns itself with the following ballflight metrics:
- Pitch Velocity
- Vertical Break
- Horizontal Break
- Arm Angle
- Release Extension
The main influencers are the first three descriptors mentioned: velocity, vertical break, and horizontal break — though, we’ll discuss the need to ensure arm slot context is taken into account — along with extreme release extension values.
The need to account for interactions between these variables may not be immediately apparent given that more movement and velocity often lead to a higher quality pitch. However, there are particular instances where certain pitches break that handy rule of thumb.
For example, more velocity on breaking balls often comes with a tradeoff in glove side action. A sinker that gains vertical break usually drops in effectiveness, whereas a generic four-seamer that gains vertical break gets an uptick in effectiveness.
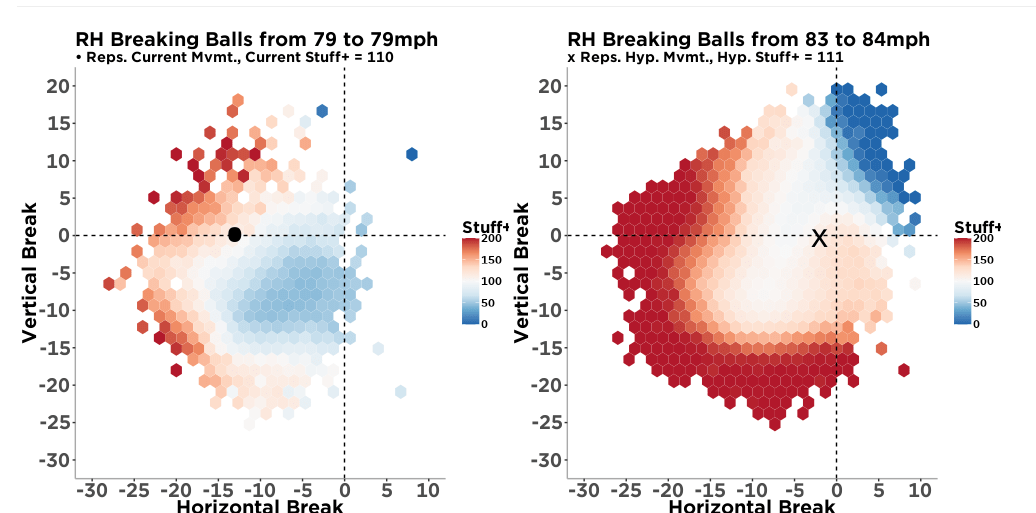
When developing offerings in the offseason, the ability for an athlete and coach to use Stuff+ to immediately summarize a 79-mph slider with more movement against an 83-mph gyro-esque slider is quite valuable. Perhaps the deviation in stuff+ between the 2 offerings is large enough to settle on one of the offerings with minimal bandwidth allocation towards improving or changing on particular pitch.

Stuff+ is scaled similarly to IQ — with a score of “100” meaning that pitch graded out as league average relative to other pitches thrown in that pitch type bucket. A fastball with a Stuff+ of 75 would be 25% below the league average for fastballs. A curveball with a Stuff+ of 130 would be 30% above the league average amongst all breaking balls.
The seven “popularized” pitch types are rearranged into three distinct pitch buckets — with those pitch types competing amongst each other within their associated pitch grouping.
Fastballs
Breaking Balls
Offspeed
- Changeup
- Splitter
It’s important to keep in mind that these pitches compete amongst each other—breaking balls tend to lower run values more than Fastballs, meaning a four-seamer with a Stuff+ of 150 is not necessarily equivalent in “raw stuff” to a slider with a Stuff+ of 150.
| Raw Pitch Type | Run Value per 100 pitches | Grouped Pitch Type |
| SL | -0.98 | Breaking |
| CT | -0.59 | Breaking |
| CB | -0.58 | Breaking |
| CH/SP | -0.42 | Off Speed |
| FF | -0.19 | Fastball |
| SI | -0.14 | Fastball |
Without further ado, let’s see some examples of Stuff+ in action.
Stuff + for Four-Seam Fastballs
2021 Four-Seam Averages
| Handedness | Velocity | Horizontal | Vertical | Release Height | Extension |
| RHP | 94.1 | 7.5” | 16.4” | 5.9’ | 6.4’ |
| LHP | 92.8 | 7.8” | 16.6” | 6’ | 6.3’ |
Highest graded four-seamer in 2021 (that was a strike)
Chapman is well regarded for having perhaps the most electric arm the world has ever seen. Of the top 10 graded fastballs this season, he owned 8 of them. His 101.5+ mph throws are outrageous outliers, as they are thrown 4 miles per hour harder than 95th percentile four-seam velocity (97.6).
Daniel Bard vs. Mike Fiers
Mike Fiers Metrics, Velo: 89.8 (9th percentile), Vertical Break: 20.4″ (92nd), Horizontal Break: 11.5″ (80th), Stuff+: 80
In the example above, these hurlers deviate significantly in how they obtain their near league average four-seam fastballs. Bard is among the league leaders in spin and fastball velocity, but suffers from significant inadvertent cut at release.
The result is a pitch that is left with rather unremarkable movement characteristics relative to competing fastballs across the league. Fiers has thrown 51% heaters across his 10-year major league career despite averaging 89.4 miles per hour. He obtains significant total movement on his heater, giving him a heater that ranks around league average when he cranks it up into the low 90s.
Four-Seam quality is predominantly a result of two things: velocity and vertical break. If you combine Bard’s velocity with Mike Fiers movement profile, you more or less get Michael Kopech, who ranked 2nd in the league in Stuff+ on his four-seamer at 225.
Arm side run, or even cut, does play a role in the potential of the offering — with pitchers that are at either extreme generally grading out more favorably. Gerrit Cole is an example (1st in Stuff+) of a pitcher who obtains significant arm side run and carry — whereas Clayton Kershaw has been a beneficiary of high carry combined with cutting action on his heater for years.
Stuff+ for Sinkers
2021 Sinker Averages
| Handedness | Velocity | Horizontal | Vertical | Release Height | Extension |
| RHP | 93.4 | 15.5” | 9.3” | 5.7’ | 6.3’ |
| LHP | 92.1 | 15.6” | 9.4” | 5.8’ | 6.3’ |
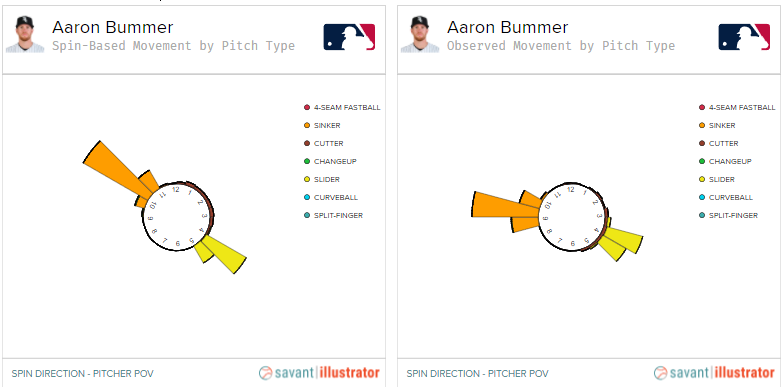
Highest graded Sinker in 2021 (that was a strike)
Bummer is in a class of his own when it comes to left-handed Sinkers. His 191 Stuff+ average not only leads the league for sinkers, but it is 57 points better than the next best left-handed sinker (Gregory Soto). Bummer accomplishes this with 90th percentile velocity from the left side and the ability to manipulate the pitch (largely through seam shifted wake) so that it moves in just a lateral direction — resulting in a pitch that averages less than an inch of carry.
Sinkers differentiate from four-seamers in many ways. The most obvious is that the sinker’s value is tied towards generating low run value contact in the form of ground balls. An average four-seamer will likely outweigh a “good” sinker in its ability to generate whiffs, but it won’t necessarily outweigh it in its ability to negate runs. The model currently is agnostic towards how the movement is created (spin-induced vs. non-magnus) ; it only cares that the movement and velocity is generated in some manner.
Our Stuff+ model allows us to put four-seamers and sinkers on the same scale, allowing us to rank them independent of their differing run prevention characteristics.
Joe Kelly vs. Dillon Tate
Joe Kelly’s sinker is similar to the Bard example above in that its above average rating (113) is almost completely accounted for by its velocity (97.7). Kelly does at least achieve above average arm side run, but his average sinker doesn’t identify as having a unique movement profile due to its lack of depth. As the pitch has an additional inch of carry relative to the league average sinker.
Dillon Tate, who didn’t even begin throwing the pitch until 2019, is able to generate a significant amount of depth on the pitch (88th percentile), along with above average arm side run (77th). When you add in his velocity (95.5) it’s a bit easier to understand why the offering rates 32 units ahead of Kelly’s (145).
Arm Slot Context
Fastballs also require us to look at arm slot context prior to providing a final judgement – our model is aware of the effect slot deviation has on stuff as well.
Blake Snell vs. Josh Hader
While Snell beats Hader handedly in all the key metrics we’ve discussed for the four-seamer — Hader’s ability to impart well above average carry and velocity on his four-seamer with one of the lowest arm slots in the league proves superior.
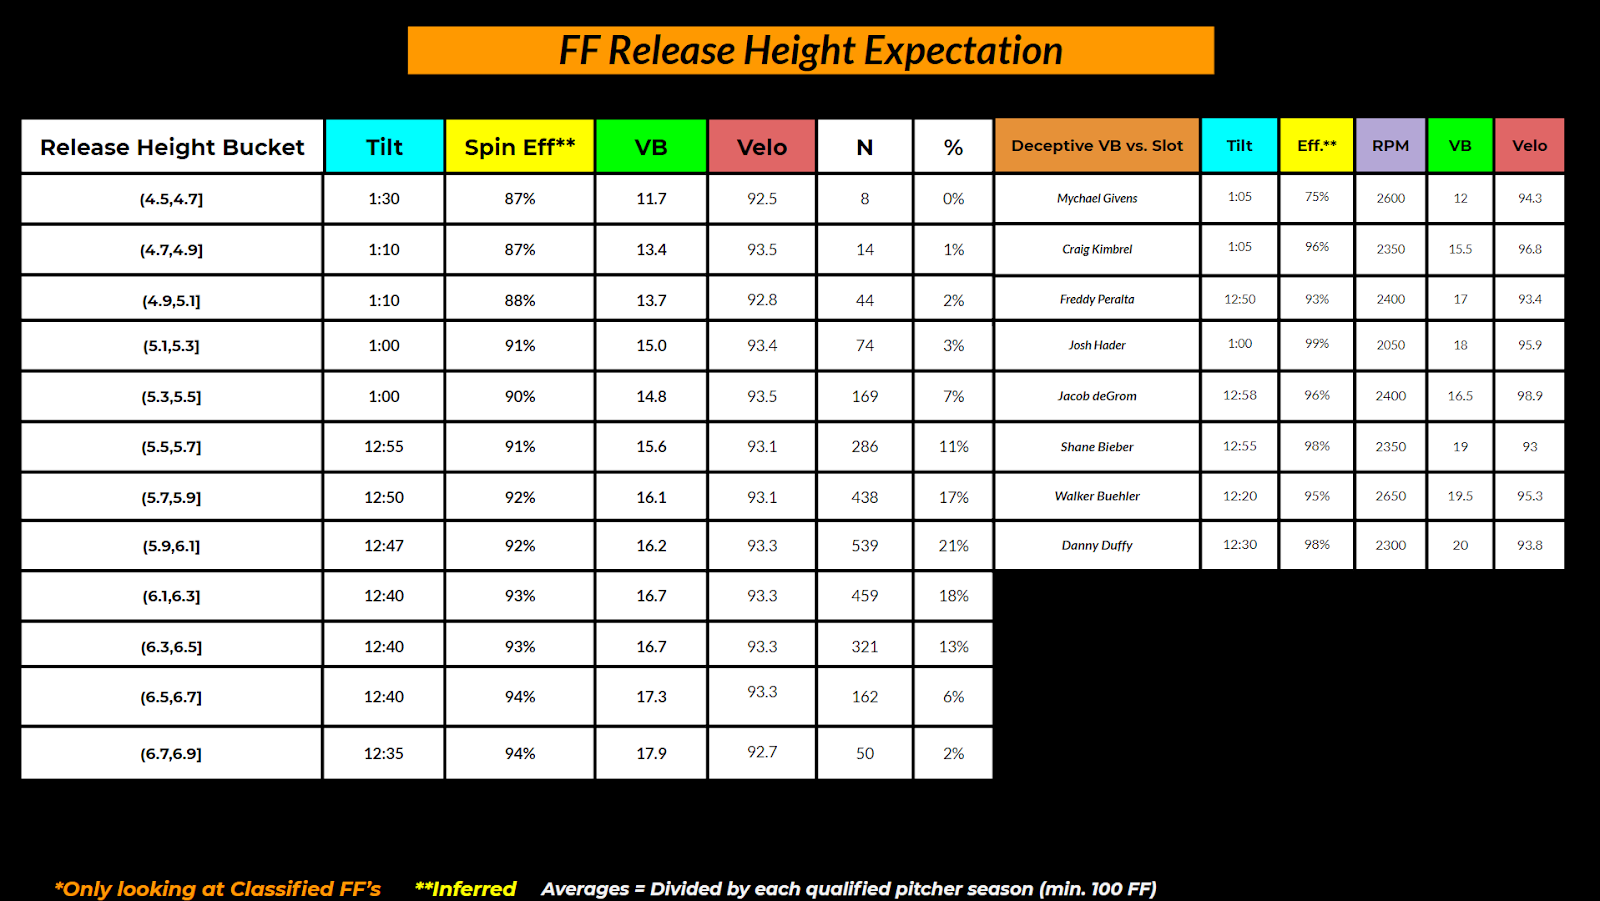
If we bin pitchers by 0.2 feet increments, we can see that pitcher’s with Snell’s slot (6.5’+) generally come equipped with more carry on their pitches. While it’s difficult to explain precisely why pitchers who defy their release expectation receive a benefit, we know they do.
Pitchers who have lower slots are able to throw pitches with flatter vertical approach angles relative to their high slot peers. However, Stuff+ isn’t concerned with command nor targeting strategy — which has a large impact in how a hurler benefits from that advantage. Thus, deception can be assumed the main culprit for why pitcher’s such as Hader defy their raw velocity and pitch movement metrics.
Stuff+ for Cutters
We have moved on from fastballs and are now onto the breaking ball pitch groupings. Cutters, Sliders, and Curveballs are lumped together and evaluated simply off of their ball flight and release characteristics.
2021 Cutter Averages
| Handedness | Velocity | Horizontal | Vertical | Release Height | Extension |
| RHP | 89.5 | (-) 3” | 8” | 5.9’ | 6.3’ |
| LHP | 86.8 | (-) 1.8” | 8” | 5.8’ | 6.2’ |
This is a good reminder that we’re simply discussing the context of a pitcher’s “stuff” as opposed to leveraging an entire arsenal and having a differing intent behind each pitch. This context is of utmost importance prior to diving into cutters – as they’re on the same scale as curveballs and sliders.
Highest graded Cutters in 2021 (that were strikes)
In the example of Clase and Alvarado, we can see that they each achieve elite scores in different fashions. Essentially, Clase is throwing a more traditional cutter, with four more inches of sweep and absurd velocity. Alvarado, who nearly matches Clase’s stuff score on this pitch, is throwing essentially a league average slider… at 94 miles per hour from the left-hand side! The edge visualization provides good context, as Alvarado’s drops far more than the league average cutter – essentially acting like a gyro ball.
Nathan Eovaldi vs. Shane Greene
Eovaldi throws a more traditional back spinning cutter. The pitch ranked about average (104) amongst breaking balls this year – though it’s role in the arsenal was apparent, as it was mixed in at about the same rate as his CH, SL, and CB – offerings often more associated with missing bats than generating contact. Greene has more of a “hybrid” cutter in that it has slider sweep mixed with cutter carry… with the velocity (87.4) right in between the average cutter and slider velocity for a RHP. He also leverages a swing and miss breaking ball (SL; 166 Stuff+) 28% of the time.
Thus, the Cutter is highly contextual, with the maximization of stuff not necessarily being the highest priority. That being said, hurlers who are developing or fine tuning a cutter may be curious as to whether or not their pitch plays best when leaning into a Shane Greene sweeper type cutter or sticking with the back spinner that Eovaldi throws. This is where Stuff+ comes in handy, as very slight manipulations can turn a Cutter with a stuff+ of 75 into one that is 100 without it just becoming a slider.
Stuff+ for Sliders
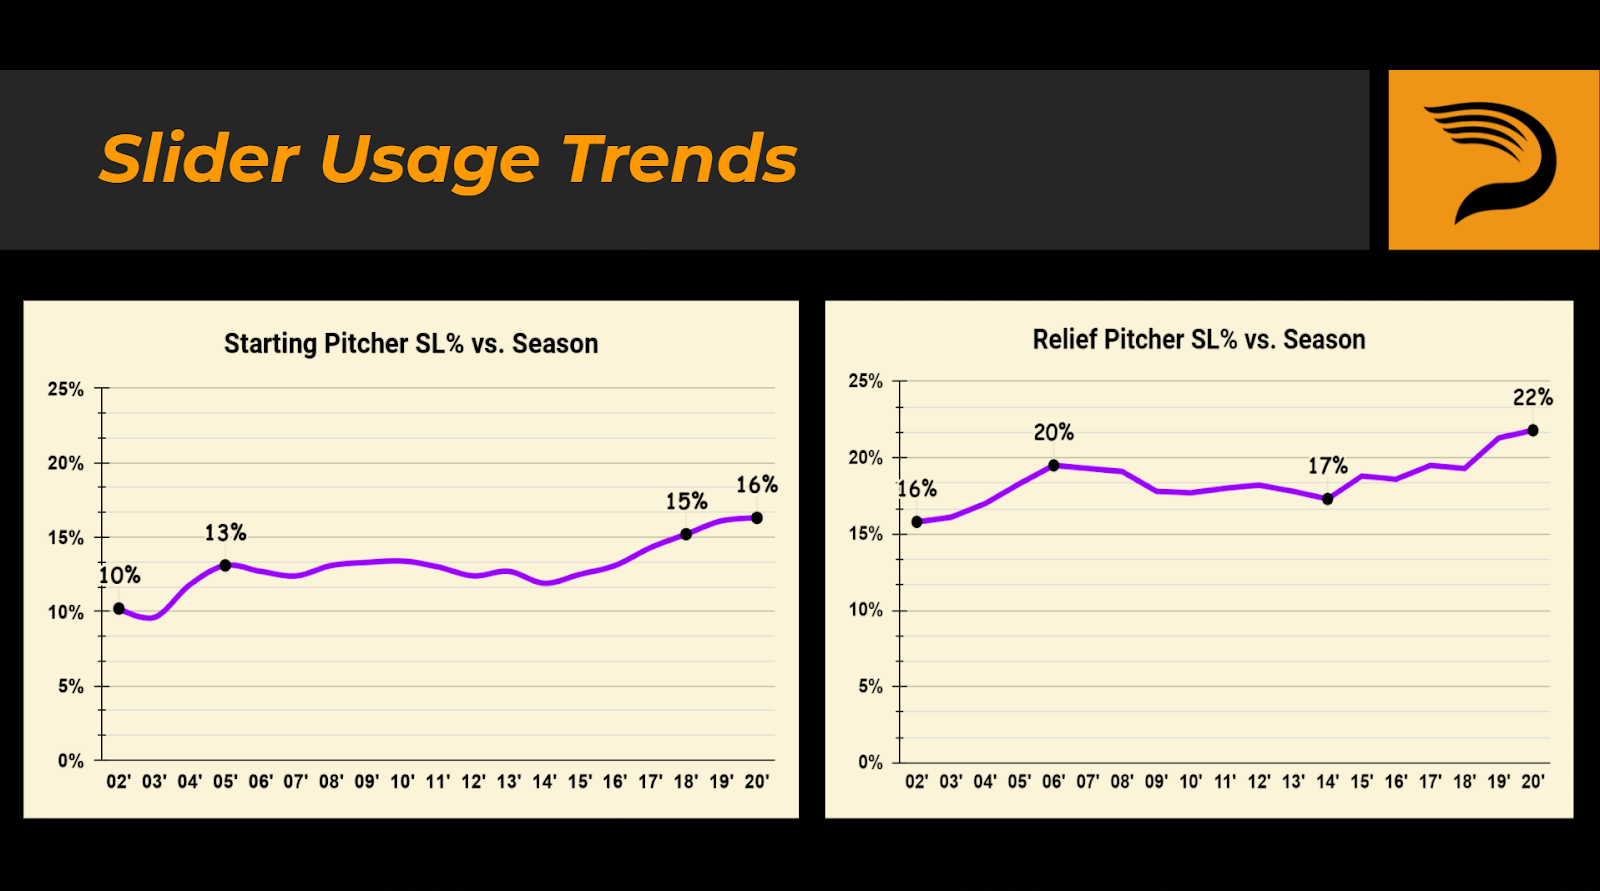
It’s no secret that the slider has become “the best pitch in baseball” across the league. Run values back up this theory, and usage of the offering has gone up drastically over the past 2 decades. The average slider had a Stuff+ of 119 in 2021, 25 points higher than the average cutter.
2021 MLB Averages
| Handedness | Velocity | Horizontal | Vertical | Release Height | Extension |
| RHP | 85 | (-) 6.6” | 1.4” | 5.8’ | 6.25’ |
| LHP | 84 | (-) 6.1” | 1” | 5.9’ | 6.25’ |
Highest graded Sliders in 2021 (that were strikes)
Tanner Scott was the Stuff+ king (246) for sliders this season… closely trailed by supination sensation Dillon Maples (233). Scott largely is the beneficiary of unheard of velocity from the left side (88.5) and the ability to often top spin breakers without a significant loss of velocity – essentially turning them into 88+ mph slurves at times.
Sliders are generally a bit more straightforward – some pitcher’s need to balance the shape of the pitch amongst the remainder of their arsenal, but oftentimes the remaining breaking pitches are fit around the slider, which tends to be most pitchers optimal whiff-inducer (especially to same handed hitters).
Zack Wheeler vs. Matt Wisler
Wheeler has more of an “overpowering” slider. In the pitch to Freeman, the movement is beginning to mimic that of a cutter… though the elite velocity allows it to maintain its status as a well above average breaking ball (140). Wisler, who is known for being a one trick pony with his slider, has more of a finesse offering. While he trails Wheeler by 13 ticks on this specific pitch, he has more than 4 times the sweep and less carry.
Sliders have as much movement deviation across the league as any pitch type. With whiff-inducing breaking balls being such a priority these days, stuff+ ensures that we get our athletes as close to their optimal breaker as possible – given current publicly available ball flight and release metrics.
Stuff+ for Curveballs
Curveballs, the most traditional form of a breaking ball, are our last breaking ball of interest. This pitch differs greatly in arsenals – with some acting primarily as get me overs, and others acting as the core putaway pitch.
2021 MLB Averages
| Handedness | Velocity | Horizontal | Vertical | Release Height | Extension |
| RHP | 79.7 | (-) 9.9” | (-) 11.2” | 5.95’ | 6.25’ |
| LHP | 77.8 | (-) 8.7” | (-) 9.1” | 6’ | 6.1’ |
Highest graded Curveballs in 2021 (that were strikes)
We once again witness the benefits of being left-handed here. Pomeranz’s curveball is quite unique, as it grades out significantly better than Shane McClanahan’s CB, who ranks 2nd amongst lefties. Kelly’s curveball is essentially wizardry given his unexplainable ability to impart cutter-esque velocity to the pitch while still obtaining elite depth.
Over the course of the season, Kelly averaged league average curveball movement, but threw the pitch 7.5 ticks firmer than the average righty. Pomeranz is able to achieve a bit more of a “downer” profile – meaning the pitch has 12-6 action relative to the league average curveball.
Adam Wainwright vs. Matt Harvey
Harvey CB, Velo: 82.2 (79th), VB: (-) 6″ (24th), HB: (-) 3.2″ (13th), Stuff+: 95
Since his memorable strikeout of Carlos Beltran in the 2006 NLCS, Adam Wainwright has been known for having one of the biggest benders in the game. He picked up 225 called strikes with it during the 2021 season. While the pitch essentially omits velocity (6.3 ticks slower on average than a RH CB) it makes up for it with an outlier combination of depth (17.2”) and sweep (17.4”). In the example above, Harvey is throwing more of a “gyro curve” with the velocity (82.2 mph) helping make up for the loss in movement – allowing it to rank about league average amongst breaking balls.
Context of the remaining arsenal is a heavy consideration for every curveball. Even so, some suffer from a lack of experimentation, as pitchers with a Stuff+ model in front of them may learn they don’t have to be quite so strict with the spin direction of the offering, or may simply learn that the pitch plays better with more of a gyroscopic shape.
Stuff+ for Offspeed
Our final pitch grouping is “offspeed” which consists simply of changeups and splitters. We actually group these pitches together when analyzing them – as the role of a splitter and a changeup is generally the same. Additionally, pitcher’s pairing both of them in the arsenal is relatively rare in the states.
2021 MLB Averages
| Handedness | Velocity | Horizontal | Vertical | Release Height | Extension |
| RHP | 85.6 | 13.9” | 5.5” | 5.8’ | 6.35’ |
| LHP | 83.6 | 14.5” | 7.4” | 5.85’’ | 6.25’ |
Prior to continuing, we should contextualize that offspeed effectiveness is based on the differential from the fastball. This means that instead of looking at individual velocity and break values, we should look at these metrics relative to the fastball. We will add an additional table and take fastball + sinker averages and negate that from a pitcher’s offspeed metrics.
Fastball Contextual Metrics
| Handedness | Velocity | Horizontal | Vertical |
| RHP/LHP | -8 | (+) 3.4” | (-) 8.1” |
On average, pitcher’s drop 8 ticks off their fastball, add nearly three and a half inches of arm side run, and generate 8 inches of depth relative to their average fastball.
Highest graded Changeups in 2021 (that were strikes)
Williams CH, Velo: 82.6 (13.7 off FF) – 97th percentile, VB: (-) 14.8″ (29.5″ off FF) – 99th, HB: 19.2″ (6″ off FF) – 80th, Stuff+: 275
Devin Williams “airbender” is among the games most famous pitches. Offspeed “stuff” evaluation is arguably the most difficult of the groupings we’ve discussed – what we do know is that looking to add depth on the pitch tends to be a worthwhile investment – as most of the game’s best changeups are approaching or exceed 15+ inches of vertical separation off their fastball.
Jharel Cotton vs. Alec Mills
Mills CH, Velo: 81.3 (7.1 off FF, 43rd percentile), VB: 0.3″ (9″ off FF, 63rd), HB: 10.8″ (-4″ off FF, 3rd), Stuff+: 71
This example may better bring to light the need to contextualize the changeup/splitter off of a pitcher’s fastball metrics. Cotton’s CH is equipped with 7 more inches of carry relative to Mills, but receives a grade double that of Mills. This is due to the fact Mills throws a heavy proportion of sinkers, which in a sense, chokes out the potential of his changeup.
With Stuff+, and thus the Blob tool inside TRAQ, we can project how much adding in a high volume of sinkers into a pitcher’s arsenal would hinder their changeup. For pitcher’s such as Mills, it’s entirely possible further development of the changeup isn’t all that possible, as his changeup is dropping a rather impressive 12 inches relative to the average metrics of his four-seamer.
Release Extension
Finally, we’ll briefly mention release extension. While it isn’t of extraordinary importance, pitcher’s that deviate greatly from league average’s will certainly receive a boost (or penalty) due its influence on reaction time for the hitter.
When accounting for flight time differential, an additional foot of release extension is worth the equivalent of 1.6 mph. Though, relatively few big leaguers deviate by more than half a foot relative to the league average – hence it’s light influence in a majority of hurlers’ arsenals.
Stuff+ Recap
Stuff+ can be counterproductive if abused. It should not be thought of as a replacement for any additional pitch quality analysis. We must remember that Stuff+ is location agnostic and looks at pitches individually. Good baseball intuition is still required to contextualize whether or not simply maximizing the stuff+ on a given pitcher’s cutter is optimal for their specific arsenal.
Stuff+ takes away some bias from the equation and provides a strong summary score for how a pitch rates based on its pitch flight characteristics and release parameters. Stuff+’s biggest strength is that it captures this without a need for a massive sample size – allowing for immediate feedback during pitch designs in the offseason.
When utilized properly, Stuff+ is an invaluable tool – there’s simply too much variability in breaking ball shapes and their differing effectiveness to simply look at percentile rankings amongst the big three metrics (velo, vertical break, horizontal break) and assume an accurate model. Stuff+ contextualizes when added carry is good on a slider, and when you should be nudged towards a sinker instead of a four-seamer.
Comment section