How Different Drills and Ball Weights Affect an Athlete’s Workload

By David Besky – Data Scientist
In any training program, in throwing as in lifting, the goal is to stress the body with an appropriate stimulus. The key is for this stimulus to be great enough to cause adaptation while also appropriate given the athlete’s needs and previous training such that they’ll be able to recover sufficiently to achieve that adaptation.
PULSE allows for precise tracking of throwing workload, and all you need to do is put the sensor on before throwing and sync the data post session (or mid-session if you want intermittent feedback to make on the fly adjustments).
Given that athletes will vary in terms of regulating volume and intensity, two athletes may differ moderately in terms of workload even when given the same instructions and program. With PULSE, you’re able to track that, provide individualized feedback, and adjust programming to optimize the athlete’s training.
That said, until you have a detailed picture of each athlete’s training habits, it can be helpful to have some ballpark numbers averaged across different athletes to create a rough framework for the workloads you want to prescribe, based on workout type, ball weight, and different drills.
Looking at data from our in-gym athletes, who have been using PULSE since September 2020, we can calculate those average values, as well as look at the variation between different athletes.
By Workout
One of the main concerns when designing a program is determining how much an athlete should throw on a given day. This is dictated by their preparedness and desired/required throwing fitness goals or training state.
Generally, we recommend progressively increasing workload week over week when training during the offseason to avoid spiking the acute workload (workload for a given week) much over the level of throwing fitness the athlete has developed in prior weeks.
In our training programs, the desired throwing intensity and volume have historically been indicated by workout types as follows:
- Recovery Days: <60% intensity
- Hybrid B Days: 60-80% intensity
- Hybrid A Days: 70-90% intensity
- Plyo Ball ® Velo: 90-100% intensity with 100% effort throws using Plyo Ball ®
- Mound Velo: 90-100% intensity with 100% effort throws using baseballs on the mound
- Pulldowns: 90-100% intensity with 100% effort throws being pulldowns
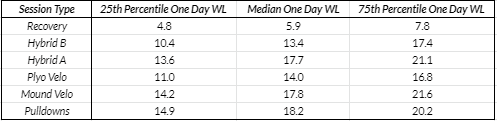
Below, we see the following average values of One Day Workload (a combined measure including number of throws for the day and intensity of those throws) for those different workout types:
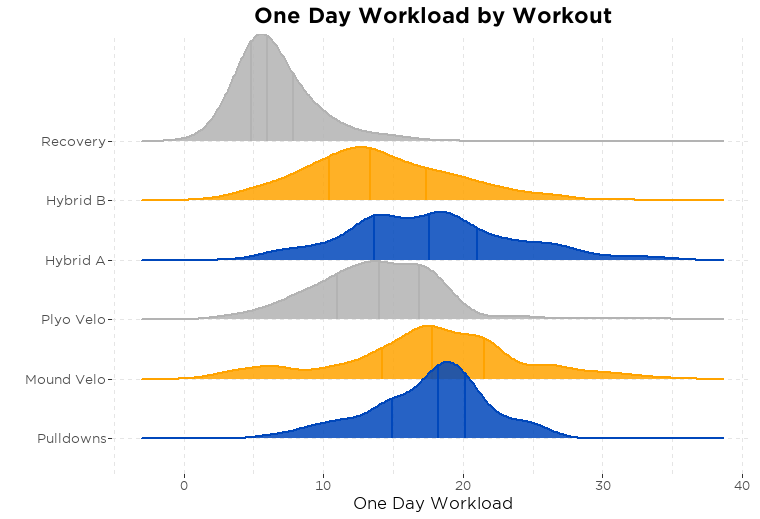
Vertical lines indicate 25th percentile, 50th percentile, and 75th percentile values.
We see that the lower intensity throwing days (Recovery and Hybrid B days) generally have lower One Day Workloads, as might be expected.
Looking at those three main classes of velo days, we see that Plyo Ball ® velos have the lowest One Day Workloads in-gym on average, with a median One Day Workload of 14.0, compared to 17.8 for mound velos and 18.2 for pulldowns.
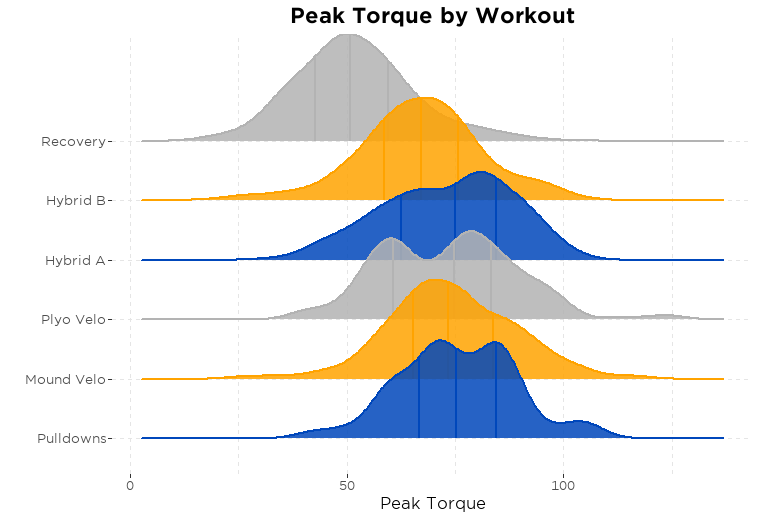
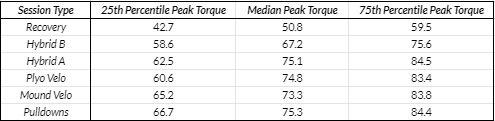
In addition to the cumulative One Day Workload, another consideration may be an athlete’s peak single throw torque on a given day. Generally, we’ll give more weight to One Day Workload as it incorporates the intensity of all throws and is not going to be as affected by an athlete cranking out a single throw at high intensity on submaximal days.
Still, especially in rehab settings, peak torque can be a useful check-point for ensuring that intensity is being increased as desired.
The other component of workload is total throws, so we can also break that down by day type:
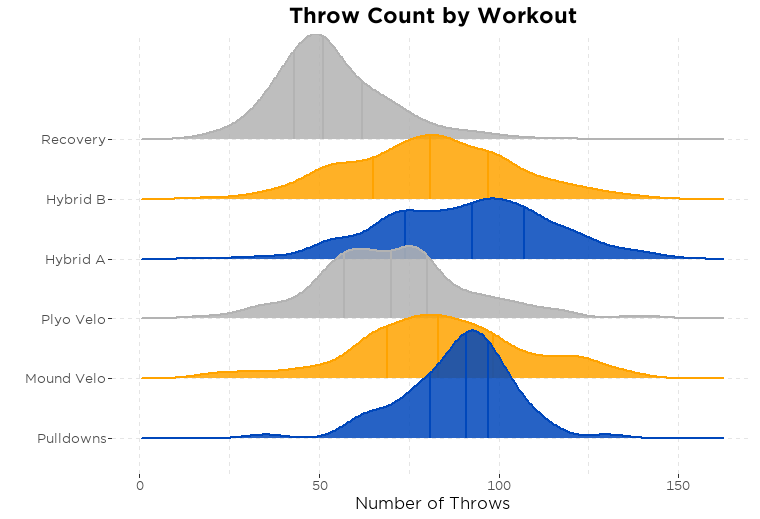
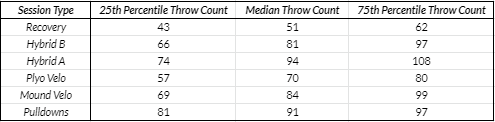
The relatively higher workload days tend to be at least in part caused by athletes taking more throws on those days (rather than the increase being driven by intensity only).
And even though time doesn’t factor into cumulative workload, we can also compare how long athletes took to complete all their throws for different workouts using the time stamps on throws:
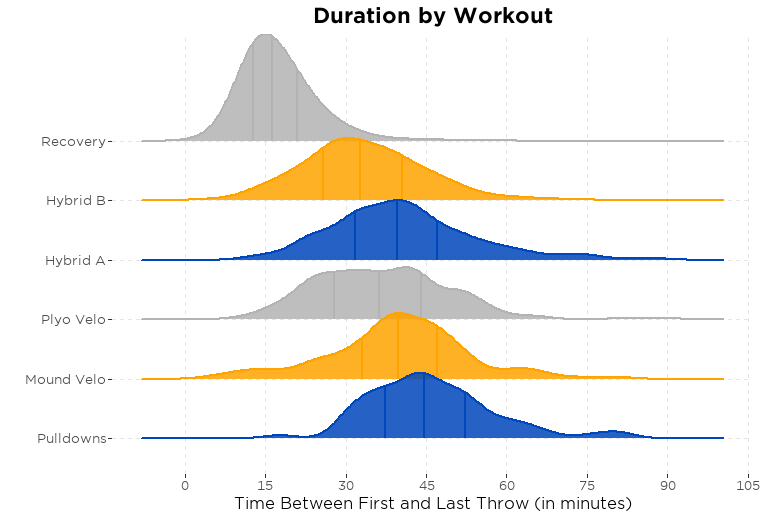
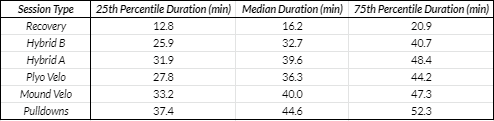
These times are just based on all the athlete’s throws on PULSE during the workout and thus do not include a general dynamic warm-up and non-throwing specific warm-up components (such as J-Bands, Wrist Weights, Shoulder Tube, etc.).
We see that our athletes usually spend 15-20 minutes throwing on recovery days, and between 25-50 minutes on other days, spending a bit longer on pulldown days than on other workout types, on average.
By Ball Weight
Within a workout, changing ball weight and using various constraint drills will have some effect on the workload of individual throws, so having a ballpark idea of the size of the effect may help you tailor programming as needed.
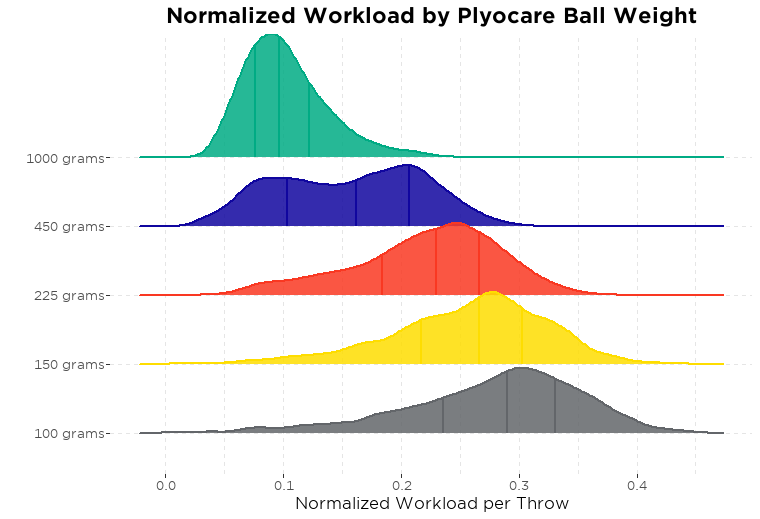
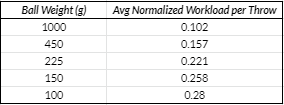
So, for example, if an athlete did 10 throws with the blue ball, that would on average be 1.57 workload units (10*0.157) towards their One Day Workload total. Alternatively, it’d take only about 5-6 (5.6 to be exact) gray ball throws to achieve that same cumulative workload (on average—individual athletes will differ, but these average values provide a starting point for comparing across different weights).
By Drill
In addition to varying the number of throws an athlete will do with each ball weight, you may also vary drill volume for specific athletes based on what you want them to emphasize.
With a rough idea of how workload/torques vary between drills, we can make adjustments as necessary if switching the balance between the different drills.
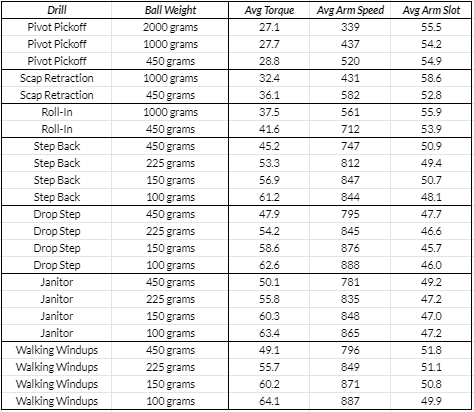
While most of the actionable info comes from workload/torques, we can look at the other metrics as well to get an idea for any variation relevant to different drills:
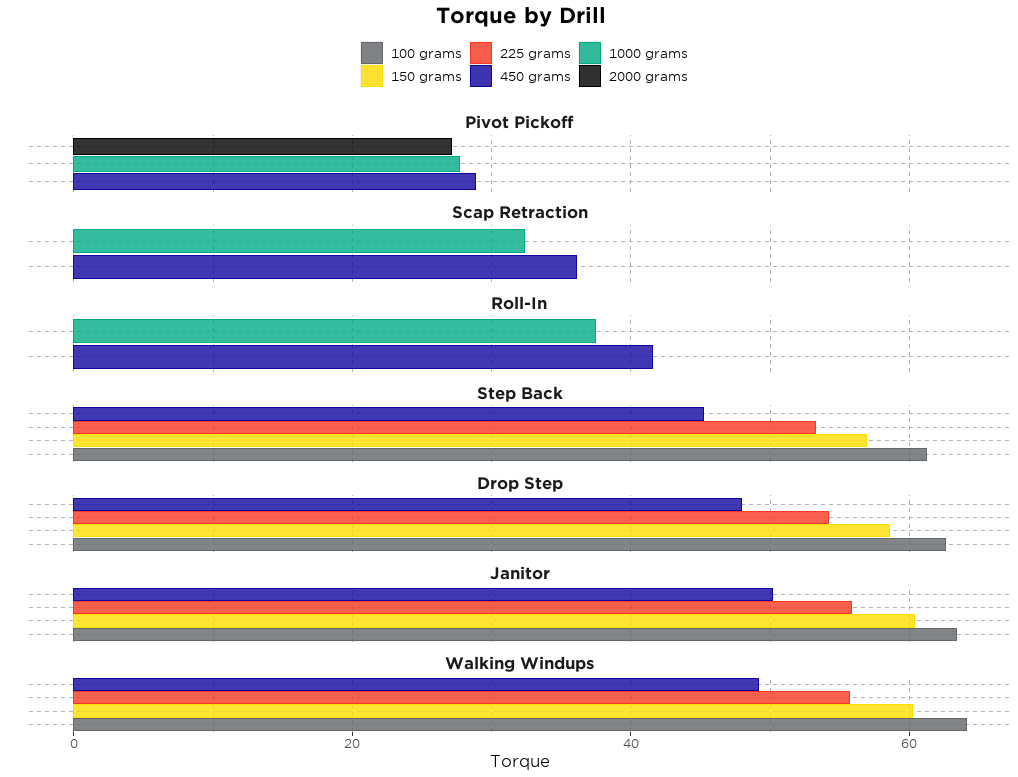
We see that the more constrained drills like the pivot pickoff and the roll in, which are typically done with the heaviest balls, come in with the lowest average torques. They are typically used on recovery days more than the other drills, so that may bias the comparison slightly. Among the drills for which we’ll cycle through the four lighter balls (blue, red, yellow, gray), Janitors and Walking Windups have slightly higher torques than Step Backs and Drop Steps, across the different ball weights.
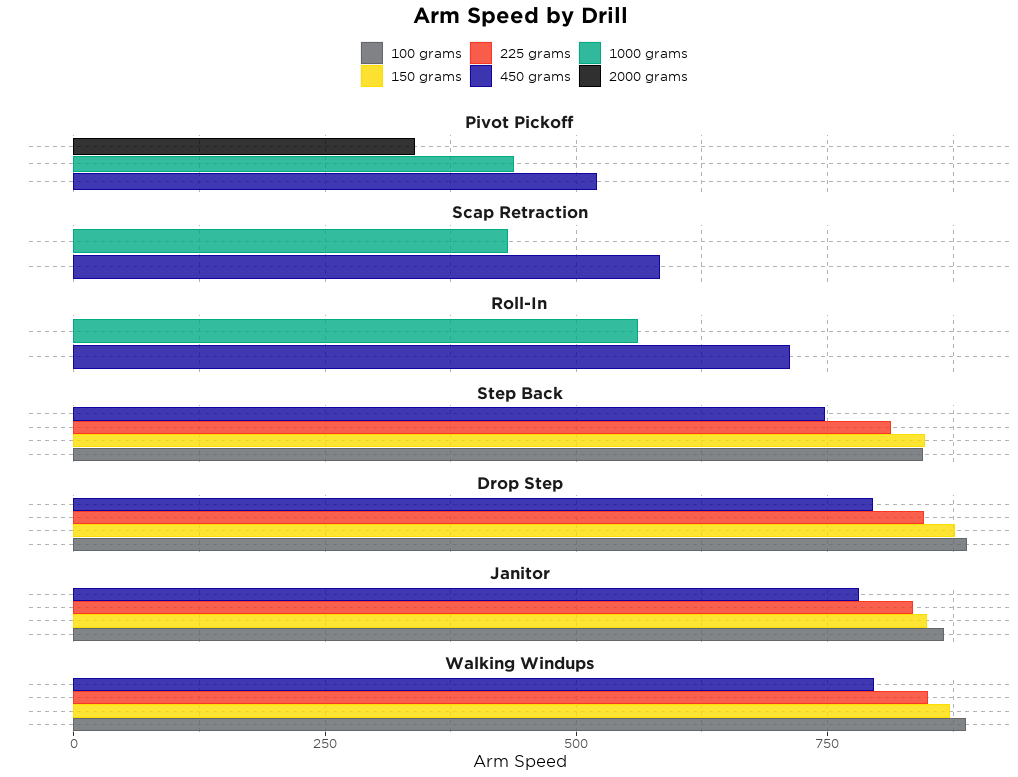
As with the torques, we see higher arm speeds for underload balls and less constrained drills.
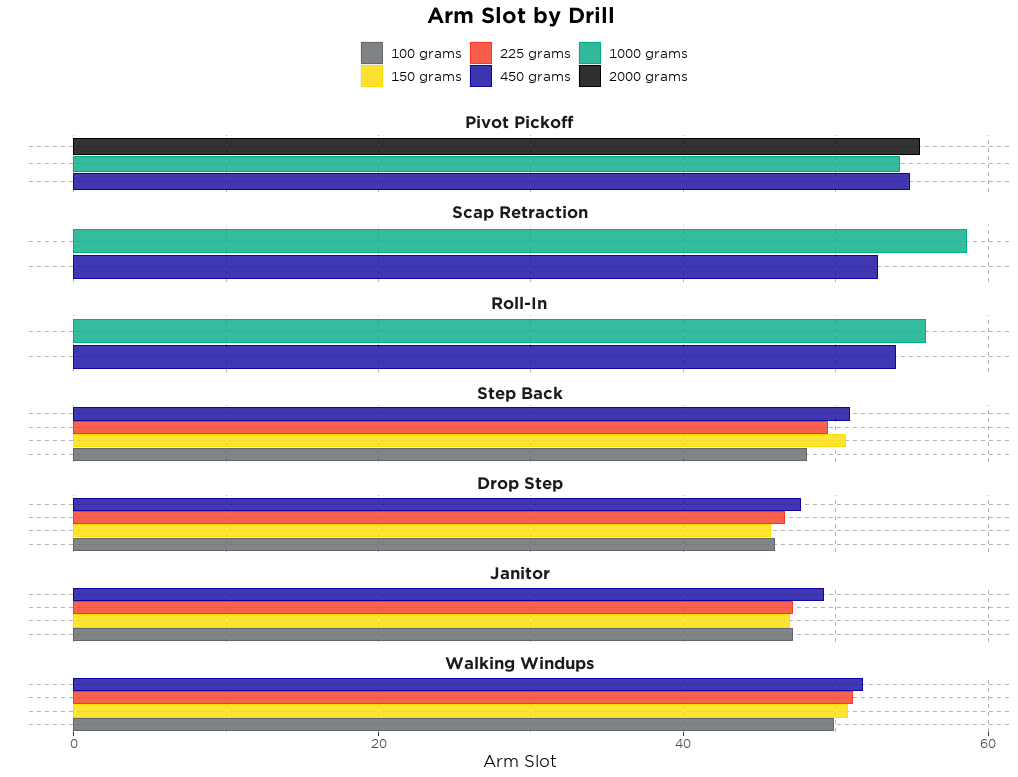
We see a general trend where PULSE arm slots are a touch higher for heavier Plyo Ball ® (specifically the blue ball) within each of the less constrained drills that use all ball weights. The magnitude of difference in arm slots is only a couple degrees, but it’s interesting to see nonetheless (fully detailed in the table below).
Conclusion
Individual tracking enabled by PULSE allows for individualized athlete workload comparisons and adjustments, but some normative values can be helpful for providing a ballpark idea of how different drills and ball weights would affect an athlete’s workload from their program. Some guys tend to blow it out or may throw different Plyo Ball ® with varying intensities—which PULSE can provide feedback on for specific tailoring. Using either generic average or player specific info, you can build out a plan to reach specific goals, and then fine-tune this plan with adjustments based on the specific athlete’s daily feedback. A couple examples of these adjustments are:
- Adding throws to hit a 1-day workload goal during a session
- Increasing/decreasing intensity to ensure that intensity matches the goal of the workout, maybe by setting goal-ranges for torque or arm speed
PULSE will help you learn about and improve your athletes’ training habits. As you get started with PULSE and collect your own data, the reference ranges shown above can get you going in the right direction.
Comment section