Calling the Right Pitch: Investigating Effective Velocity at the MLB Level
In a game transformed by the Sabermetric Revolution, where the most important components have been optimized and made more efficient, pitch sequencing has largely remained an art form resistant to the most technical analyses. Although many analysts have attempted to crack the pitch sequencing code, the expertise needed to select the right pitch at the right time has been presumed to be an innate skill possessed by those able to size up complex pitch-level details in ways that spreadsheets and models cannot.
Thus, players and coaches, without a definitive blueprint to choose one pitch over another, have historically relied on a combination of feel and several lightly tested pitch sequencing theories to differentiate good sequencing from bad.
While these sequencing theories are typically founded on sound reasoning, oftentimes they make assumptions that contradict one another, causing confusion and debate amongst players, coaches, and analysts about the optimal pitch decision within a given situation.
To minimize the subjectivity surrounding pitch sequencing, our goal over the next few months is to validate many of the underlying assumptions and theories on which modern pitch sequencing is predicated. By understanding which theories have merit and which are unsupported at higher levels of the game, we can gain a better understanding of how to optimally sequence pitches and get the most out of our athletes’ raw abilities.
Evaluating Effective Velocity
In searching for a place to begin researching the effects of pitch sequencing on performance, we decided to investigate one of the more well-established and popular theories surrounding pitch sequencing: Perry Husband’s Effective Velocity (EV) Theory.
Effective Velocity is arguably one of the most widely-believed theories on pitch sequencing and has been featured on MLB Network, SBNation, Fangraphs, and a variety of other mainstream publications in the baseball community.
At its base level, EV theory suggests that two pitches thrown with the same velocity, but different locations, will be perceived by a batter as having different speeds, depending on where a point of contact estimate with the pitch is made. For pitches located high and inside, where batters are believed to hit the ball farther out in front of home plate, reaction time is minimized. For pitches located low and away, where the ball is believed to travel deeper in its trajectory, reaction time for the batter is maximized.
Effective Velocity attempts to account for the estimated response time that hitters are afforded during a given pitch by adding or subtracting hypothetical MPHs to a pitch’s release speed based on where contact needs to be made relative to home plate.

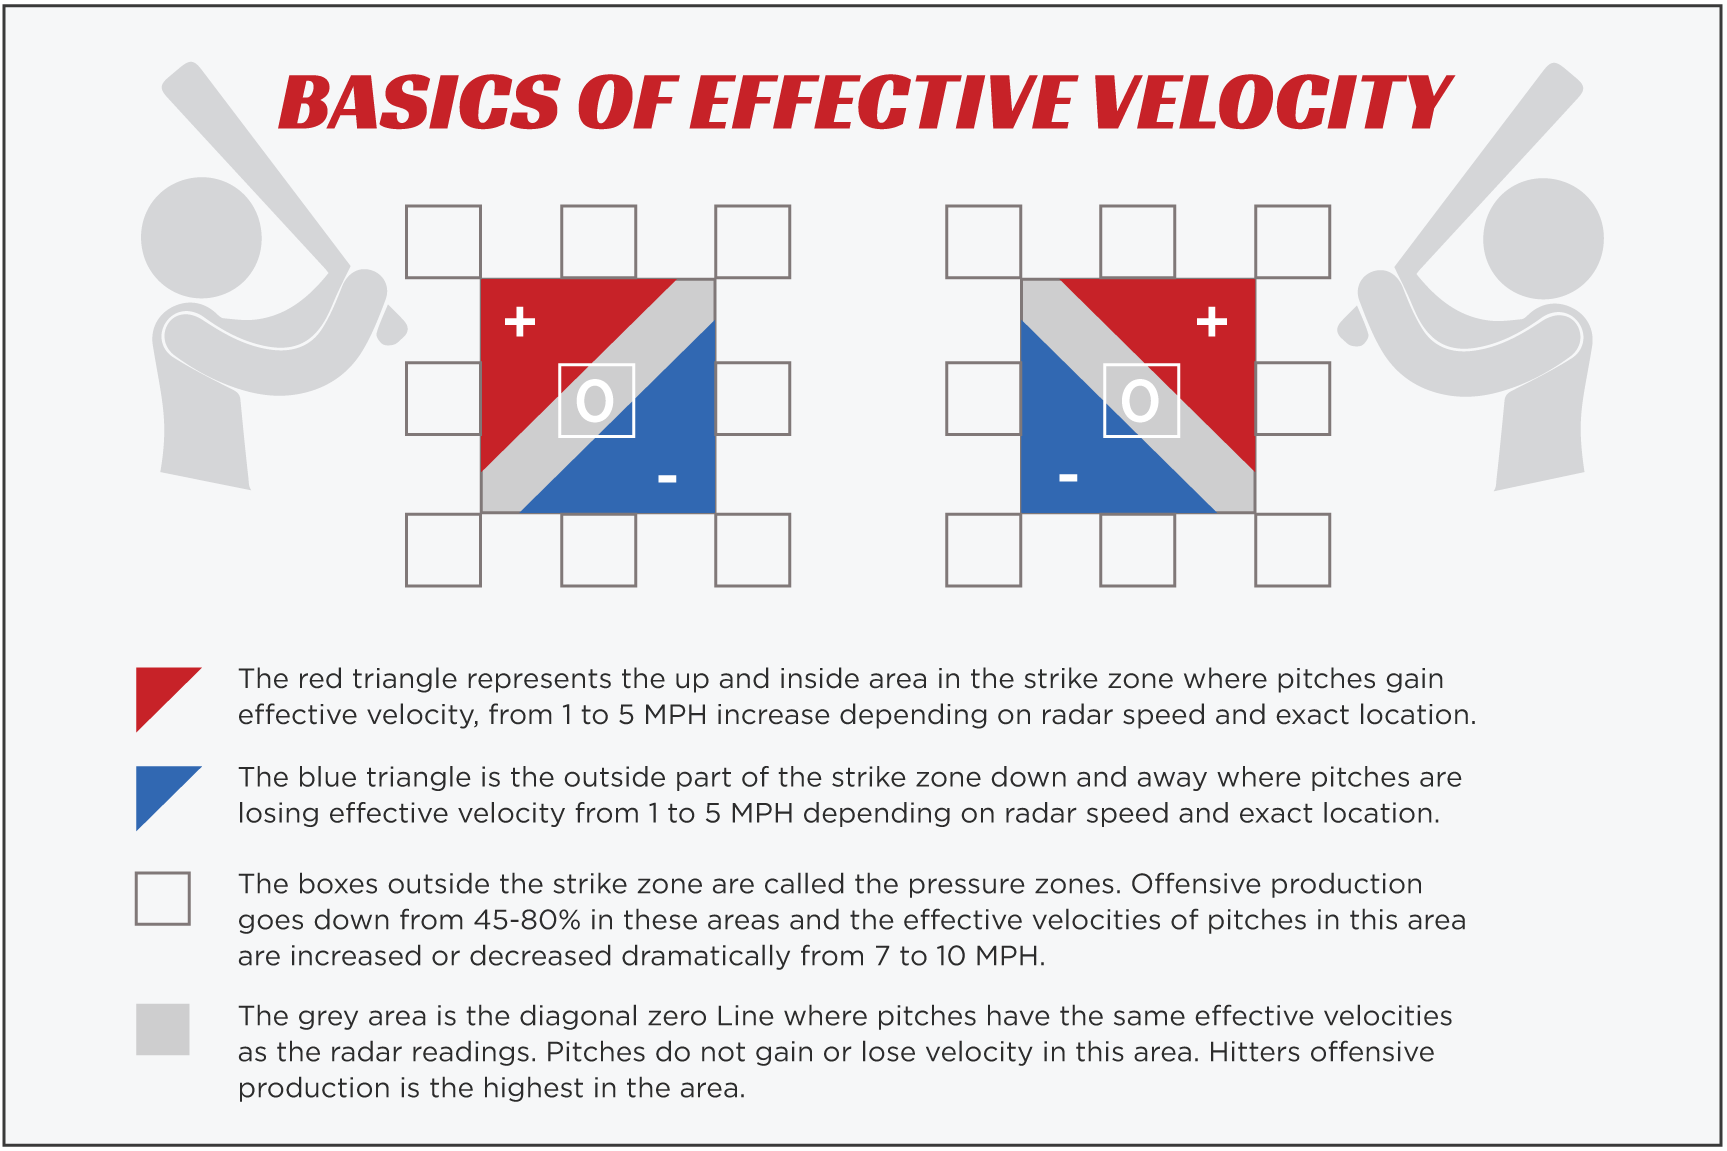
(The graphic above, taken from Perry Husband’s website, illustrates how location interacts with release speed to influence a batter’s perception of an incoming pitch. Note that Husband’s actual adjustments are supposedly more granular than what appears above, but it is unclear what his exact adjustments truly are.)
Like several other pitch sequencing theories alluded to above, EV aligns well with intuition, is rooted in quantitative analysis, and has been endorsed by prominent names within the industry. However, to date no thorough third-party testing has been completed in the public realm to validate many of the claims associated with EV theory.
In an attempt to fill this void in the literature and determine whether EV is a reasonable strategy to base pitch sequencing decisions on, this analysis uses MLB Statcast data from 2015 to 2018 to examine some of the more measurable components of EV theory listed in the table of contents below:
- Introduction
- Deriving estimates of Effective Velocity
- Testing Components of EV Theory
- Does an average MLB batter’s production peak against pitches thrown at 90 Effective Velocity miles per hour (EV MPH)?
- Does a batter perform significantly better against a pitch that is within +/- 6 EV MPH of the previous pitch?
- Is a pitcher’s performance influenced by whether he abides by EV principles?
- Is a pitch located within the upper-inside quadrant of the strike zone perceived 4-5 mph faster than a pitch down the middle, when adjusting for an estimated point of contact?
- Do more precise EV zone adjustments lend support to EV sequencing principles?
- Can Effective Velocity on fastballs significantly influence the performance or talent level of a given MLB pitcher?
- Can Perceived Velocity (which is not a part of EV theory, but in a similar manner adjusts pitch velocity based on where a pitch is released) on fastballs significantly influence the performance or talent level of a given MLB pitcher?
- Main Takeaways
We find that although EV theory is rooted in interesting theoretical concepts that have influenced the game positively, the verifiable aspects of Effective Velocity are not supported by more rigorous statistical analysis at the MLB level. As a result, we should be cautious when applying many of the fundamental concepts of EV theory if we intend to put our players in a position to succeed. The reasons for this are laid out in the statistical analysis below.
Deriving Estimates of Effective Velocity
For us to validate the claims of EV theory, we first need to obtain a set of adjustments that allow us to add or subtract the proper amount of MPHs to a pitch at a given location.
While this should have been an easy first step, the literature on EV theory lacked consensus zone adjustments that were both publicly and privately available and specific enough to apply to a pitch-level database. With no guidelines on how to construct an EV strike zone of our own, we elected to apply Xan Barksdale’s more detailed estimates of zone adjustments to our database via the EV strike zone visualized below.
(Estimates for strike zone height and width were taken from Wayne Boyle’s Strike zone, while each zone was adjusted for batter height. Further expansion to Barksdale’s zone was incorporated to account for pitches outside the strike zone, so that we could apply these adjustments to our entire MLB Statcast database.)
Testing EV Theory
Does a Hitter’s Production Peak at 90 EV MPH?
With Effective Velocity now accounted for in our database of over 2.8 million pitches, we first wanted to verify one of the most straightforward claims in EV theory: batters are able to perform at their highest levels when facing a pitch thrown at 90 EV MPH.
For those unfamiliar with this claim, EV theory states that hitters are geared to hit a 90 EV MPH pitch, as it has been observed that league wide HR percentage, batting average, and hard hit rate all peak against 90 EV MPH pitches. Furthermore, it is also posited that once a pitch is thrown at least 3 EV MPH faster or slower than 90 EV MPH, batter production drops off “pretty dramatically” from peak levels.
To investigate whether this effect is actually observed at the MLB level, we turned to our Intrinsic Run Values, which control for count, park, and defense, to run a simple regression looking at the relationship EV MPH has with overall outcomes at the plate.
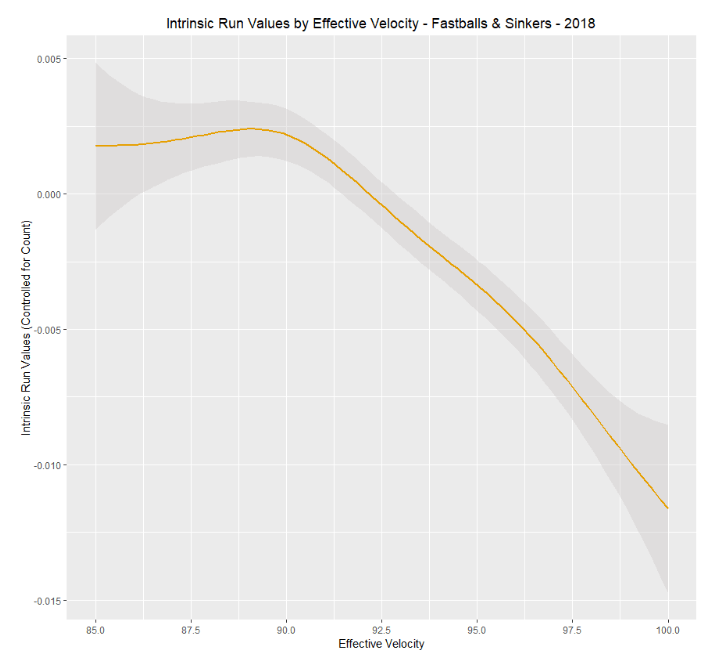
(If EV theory exactly described the pitcher/batter relationship, you would expect to see a graph that looked like an upside down U—with downward slopes on both sides of 90 EV mph. Instead, production is relatively flat across speeds from 85-90 EV mph and then dramatically slopes down.)
The results visualized above are perhaps a bit surprising given that we’d expected to see either a straight, linear relationship with Intrinsic Runs and Effective Velocity—which indicates that batter production increases as batter reaction time does—or a defined inverted U shape that peaks at 90 EV MPH—which would support the idea that batter performance peaks and drops off, as EV theory suggests.
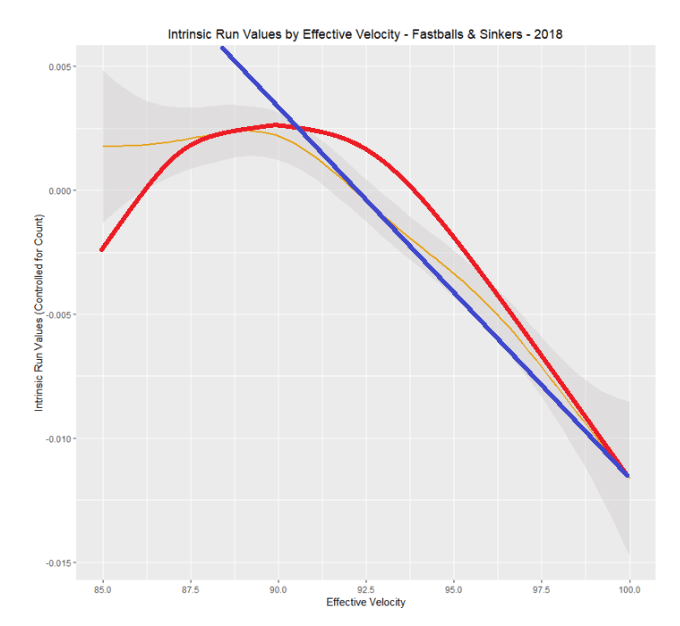
(For comparison, the red line represents the relationship between EV MPH and Intrinsic Runs had EV theory been supported, the blue line represents what we believe is the actual relationship with Intrinsic Runs Values and Effective Velocity, and the yellow line represents the actual relationship between Effective Velocity and Intrinsic Run Values.)
Without observing either expectation, we believe that our results were skewed by a fair amount of selection bias within our dataset. That is, because MLB pitchers are sent down if their performance falls below a certain level, there will inevitably be a performance floor that pitchers cannot fall below. This effect leaves only elite soft-tossers in the big leagues, whose fastballs play up despite their relatively slow velocities. In looking at the relationship between EV MPH and Intrinsic Run Values at the MLB level, our regression line, therefore, must flatten out at some value of Effective Velocity, which appears to occur at approximately 89 EV MPH.
How does this relate to EV theory’s initial claim that batter performance peaks at 90 EV MPH? Well, it is likely that if pitchers below replacement level weren’t immediately sent down, leaving only exceptional soft-tossers remaining in the big leagues, we’d continue to observe a linear relationship with Effective Velocity and Intrinsic Run Values. This means that EV theory’s first claim, which states that batting outcomes peak at 90 EV MPH, is likely not supported by our analysis. Additionally, we find that there is no evidence suggesting that batter performance drops off by a significant amount at a +/- 3 EV MPH threshold from a hypothetical performance peak. This gives us added confidence that EV theory’s first claim is not confirmed at the MLB level.
Test Summary
- EV Theory Claims that:
- Offensive production peaks against pitches thrown at 90 EV MPH
- Offensive production drops off dramatically against pitches thrown at least 3 EV MPH faster or slower than 90 EV MPH
- We compared offensive production with Effective Velocity for all fastballs thrown at the MLB level since 2015
- Peak offensive production occurred at ~89 EV MPH and stayed relatively constant at slower speeds
- We believe this was caused by selection bias in our dataset
- There were no significant changes in production within +/- 3 EV MPH of an observed production peak
- Peak offensive production occurred at ~89 EV MPH and stayed relatively constant at slower speeds
- Results: We found little evidence supporting EV Theory’s claims using 2015-2018 MLB pitch-level data
Does a Batter Perform Significantly Better Against a Pitch Within +/- 6 EV MPH of the Previous One?
It is important to consider that many aspects within the game of baseball have changed in the 15+ years since Husband first researched EV theory. Since pitchers can now throw the ball harder than ever, and batters are better equipped to handle the heat, perhaps it is not so surprising that relationships between batter production and Effective Velocity have changed significantly in more recent years.
Our next test looking to validate whether EV sequencing theory is supported at the MLB level is largely immune to the ever-changing playing environment in the big leagues, given that it only considers pitches relative to one another rather than in absolute terms, like the test above.
So, what is EV sequencing theory, and how can it be validated? As shown in the graphic below, EV sequencing theory has many layers and facets surrounding it, but at its core it suggests that hard-hit batted balls are often a function of timing, which can be significantly altered in a batter’s favor if two consecutive pitches within 6 EV MPH of one another are thrown in back-to-back succession. (That is, an 84 EV MPH changeup following an 89 EV MPH fastball.)
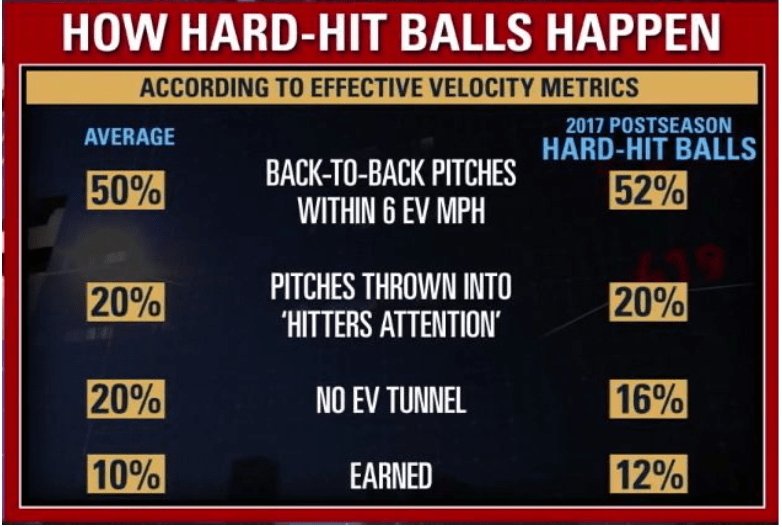
(The graphic from perryhusband.wordpress.com indicates that 52% of the hard-hit batted balls during the 2017 postseason occurred when a pitch was within +/- 6 EV MPH of the previous offering. This is relatively close to the expected rate of 50% originally derived by Husband using Inside Edge data.)
In support of this theory, research by Perry Husband has found that roughly 50% of all HRs and hard-hit batted balls at the MLB level have occurred when back-to-back pitches have been thrown within 6 EV MPH of each other, whereas only roughly 10% have occurred outside the EV window and tunnel. While this is seemingly powerful surface-level evidence suggesting that poor sequencing habits are largely to blame for bad outcomes on the mound, we argue that these numbers lack the essential context for reaching any definitive conclusions about the predictive nature of EV sequencing.
For example, although Husband suggests that 50% of all HRs occur on pitches that are within +/- 6 EV MPH of the previous offering, we still do not know what proportion of pitches included in his sample fell within this threshold. It’s possible that 75% of the pitches in Husband’s dataset were within +/- 6 EV MPH of the previous pitch, which would indicate that HR probability would decrease, rather than increase, against these highlighted pitches.
Furthermore, we also have no information as to how context was controlled for within these results. This leaves us wondering whether pitches thrown within or outside a +/- 6 EV MPH threshold occur in similar counts with equally talented pitchers throwing to equally talented batters.
As a result, we felt more testing on EV sequencing theory was necessary to quantify what the exact performance repercussions of throwing back-to-back pitches within +/- 6 EV MPH truly are.
Classifying Pitches Within or Outside +/- 6 EV MPH
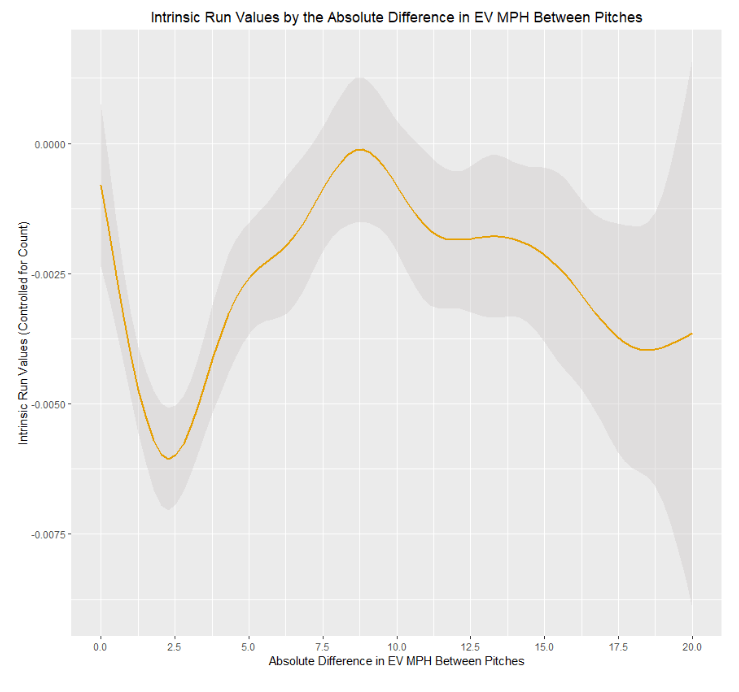
To validate EV sequencing theory using our newly created EV MPH database, we calculated the difference in EV MPH for each sequence of pitches at the MLB level since 2015 and threw out the first pitch of every plate appearance in our dataset (which will automatically have an EV Difference of 0 MPH). Left with only pitches included within a sequence, we classified every pitch as either having an EV MPH differential within or outside the +/- 6 EV MPH threshold and averaged Exit Velocity, Launch Angle, xwOBACON (xwOBA on contact), HR Rate, and Intrinsic Run Values for every pitch within each classification. The results generated are shown in the tables below.
(By bucketing pitches as being either within or outside the +/- 6 MPH EV threshold, we see that there is little evidence supporting the main tenets of EV Sequencing Theory once we control for count via Intrinsic Run Values. Note: Higher Intrinsic Run Values indicate an advantage to the batter, whereas lower run values indicate an advantage to the pitcher.)
In initial support of EV sequencing theory, we found that pitches within the +/- 6 EV MPH threshold were hit roughly ~.7 MPH harder in terms of Exit Velocity and had a 9-point advantage in xwOBACON in comparison to pitches outside of the EV MPH threshold. Considering that a batter’s timing is supposed to be optimized for pitches within this threshold, we found this to be a pretty interesting surface-level result.
However, not every column in the tables above lended support for EV sequencing theory. For example, we found little evidence that supported the claim that 50% of the league’s HRs were hit on pitches within +/- 6 EV MPH of the previous pitch, nor did we find any suggestion that pitches within the EV MPH threshold resulted in more HRs (given that the difference in HR Rate within the subsequent classifications is no more than .03%).
Furthermore, our Intrinsic Run Values, which control for count, park, and defense, actually found a reverse effect in batter performance against pitches within or outside the EV MPH threshold relative to what EV sequencing theory suggests.
Why was there a reverse effect found for Intrinsic Run Values despite an uptick in all other offensive performance metrics? As shown below, a higher proportion of pitches within the +/- 6 EV MPH threshold in our sample were thrown in hitter-friendly counts (when pitchers were doubling or tripling up on fastballs to avoid a walk), whereas a higher proportion of pitches outside the +/- 6 EV MPH threshold were thrown when pitchers had the advantage in the count. Thus, our Intrinsic Run Value metric was the only column that was not influenced by a sizeable count-effect, which is illustrated below.
Controlling for Context: Building EV MPH Regressions
With this in mind, we felt it was clear that accounting for all relevant context was necessary if we wanted to accurately determine whether an increase in EV MPH between pitches suppresses batter performance at the plate.
We ran four separate regressions that allowed us to control for batter, pitcher, count, platoon advantage, and pitch type, in addition to the factors already accounted for in our Intrinsic Run Values.
(Regressions 1 & 2 tested whether a pitcher or batter benefited from throwing two consecutive pitches at least +/- 6 EV MPH, whereas regressions 3 &4 tested whether a pitcher or batter benefited from any increase in EV MPH between two pitches. We found a significant positive relationship with the difference in EV MPH between pitches and run values in three out of the four regressions. This indicates that there is no evidence at the MLB level supporting the claim that throwing pitches within +/- 6 EV MPH are more likely to result in worse outcomes for pitchers. Click Here For Regression Outputs.)
In three out of the four regression outputs, significant relationships comparing the difference in EV MPH on back-to-back pitches and Intrinsic Run Values were observed in the opposite direction from what EV sequencing theory suggests. In other words, after controlling for all relevant context, batter results actually improved as the difference in EV MPH on back to back pitches increased. These results run counter to the main principles of EV sequencing theory, and provide strong evidence of a reverse effect relative to what EV theory suggests.
Why Do Pitches Outside +/- 6 EV MPH Induce Significantly Better Outcomes?
Without being able to definitively determine why an increase in the difference of EV MPH on back-to-back pitches induces significantly better outcomes for batters, we hypothesize that pitches with large differences in an EV MPH sequence, after controlling for pitch type, are largely a result of a pitcher missing his spot. For example, if a pitcher is continuously trying to work low and away against a batter with a nitro zone middle-in, and subsequently misses inside on the third pitch of the sequence, it is likely that both the expected run value and the delta in EV MPH on the pitch would both increase and contribute to the effect that we observed.
(Upon completing this analysis, we were made aware that Perry Husband’s initial analysis had used a threshold of +/-3 EV MPH to analyze EV sequencing theory. Given that we believe publicly available language suggests that the EV threshold stands at +/-6 EV MPH, we elected to keep our analysis unchanged. However, as one can see above, if we do drop our threshold to +/- 3 EV MPH, we still find a strong reverse effect between EV MPH differential and batter outcomes.)
We would be remiss if we did not mention that our analysis of EV sequencing theory was unable to account for EV tunnels, which identify specific instances where pitch pairings with large differences in EV MPH are not able to disrupt a batter’s timing. Since ignoring this concept (not by choice) could have significantly impacted some portions of our overall results, we note that EV tunnels were also unincorporated within the original Inside Edge analysis performed by Husband ~15 years ago. Considering that Husband was still able to extract significant findings in relation to EV sequencing theory within that study, we are confident that our overall finding—that EV sequencing theory is not supported at the MLB level—is unaffected by this limitation.
- EV Theory Claims that:
- Back to back pitches thrown within 6 EV MPH of one another provides an advantage to the batter
- We compared offensive production against pitches thrown within or outside +/- 6 EV MPH of the previous pitch
- Exit Velocity, xwOBACON, and HR Rate slightly increased on pitches thrown within 6 EV MPH of the previous pitch
- Once count and other context was accounted for, batter production increased against pitches thrown outside the 6 EV MPH threshold
- This finding held true at the +/- 3 EV MPH threshold as well
- Results: We found little evidence supporting EV sequencing theory at the MLB level since 2015
Is a Pitcher’s Performance Influenced by Whether He Abides by EV Principles?
With two attempts to validate EV theory on a per-pitch level having failed to provide much support for the basic tenets of EV, we decided that it would be best to shift our overall focus to examine the concepts of Effective Velocity on a per-season perspective.
Perhaps some of our findings in our analyses above could have been caused by poor pitch execution at one specific time, rather than a flawed sequencing strategy used over the course of an entire season. If this were true, we’d expect that pitchers who consistently use EV sequencing to gain an advantage would see a performance boost, whereas those who fall victim to poor EV sequencing over the course of a season would see a performance hit.
To test this theory, we obtained the 2018 averages of important performance metrics for every pitcher with at least 100 pitches thrown during the MLB regular season and calculated their Absolute EV MPH differential (the difference in EV MPH between back to back pitches) and EV threshold percentage (the percentage of pitches outside of +/- 6 EV MPH) for comparison. To measure how these EV metrics compared with a pitcher’s talent, we also retrieved each pitcher’s 2019 Steamer Projections of RA9 and joined these values to our dataset.
Correlating EV Metrics With Performance
After running correlation coefficients to identify any potential relationships between our seasonal EV metrics and overall performance, we again found little support for EV theory. As shown in the first matrix below, no EV metric (column items) had stronger than a .08 correlation with any performance metric (row items), with EV threshold percentage actually indicating a slight inverse relationship with Steamer Projected RA9. In other words, this meant that as a pitcher’s EV threshold percentage rose (i.e., more pitch pairs in a sequence that had greater than a 6 EV MPH absolute difference from the previous pitch over the course of the season) so too did his proxy for true talent.
(The matrices above highlight the correlation coefficients between each column item and row. Pitchers with at least 100 pitches thrown in 2018 [top], had no observed correlations between our EV metrics and relevant measures of performance, whereas pitchers with at least 1000 pitches thrown in 2018 [bottom] had slight correlations.)
While these results were somewhat expected given our prior testing, we decided to boost our pitch threshold for players in our sample up to 1,000 pitches to control for any discrepancies between starters and relievers. As shown in the correlation matrix directly above, by filtering out nearly every reliever from our dataset, we were able to observe far more agreeable relationships with Effective Velocity and performance metrics.
For example, 2019 Projected RA9 had a closer relationship with both EV sequencing metrics after scaling up to a 1,000 pitch filter, while correlations with xwOBACON and HR rate both suggested that as the absolute difference in EV MPH increases between pitches, so too does hard contact.
Given that these results run counter to our earlier findings regarding EV sequencing theory, we were a bit surprised to find slight discrepancies with our pitch-level analysis. However, once we looked back at our previous analysis more closely, we realized that these slight correlations between EV and performance metrics should have been expected all along.
(Because more talented pitchers have a tendency to end up in better counts, their Abs EV MPH differential and EV threshold percent will likely increase as a result. Thus, better pitchers will naturally have inflated EV metrics regardless of whether they abide EV principles. This effect likely explains much of the relationship between EV metrics and player talent.)
Is There a Slight Relationship With EV Metrics and Talent?
In looking at the table above, we recalled that there was a direct relationship between the count and the absolute difference in Effective Velocity that needed to be controlled for. That is, we found that the further a count was in a pitcher’s favor, the more likely his EV sequencing metrics were to rise.
Given that our seasonal analysis did not control for count, and more talented pitchers typically throw in better counts, we realized that our best pitchers in our sample had inflated EV metrics regardless of whether they abided by EV sequencing theory or not. Thus, at least some portion of the relationship between EV metrics and talent was likely explained by a count effect, rather than a pitcher’s leveraging EV principles to gain a competitive advantage.
Furthermore, when looking at the leaderboards of EV threshold percentage provided above, we also observed that a player’s EV metrics had been strongly influenced by the number of pitch types he had within his respective arsenal during the 2018 season. If EV sequencing theory had a noteworthy influence on seasonal pitching performance, we argue that we would have likely seen more defined EV sequencing profiles among leaders and laggards independent of a pitch arsenal. Additionally, if EV sequencing had any influence on true talent, we almost certainly would never observe one-pitch relievers, like Kenley Jansen and Zach Britton, being among the best in the game despite having the worst EV threshold percentages in baseball.
To test our suspicions, we filtered our database to include only pitches thrown in neutral counts and then re-calculated every player’s EV Threshold Percentage (this EV metric better accounts for players that have a slow curveball in their arsenal). With a new EV metric that better controls for count, we ran a simple regression that predicted Projected RA9 by EV Threshold Percentage and found insignificant results (R^2 value of .0279).
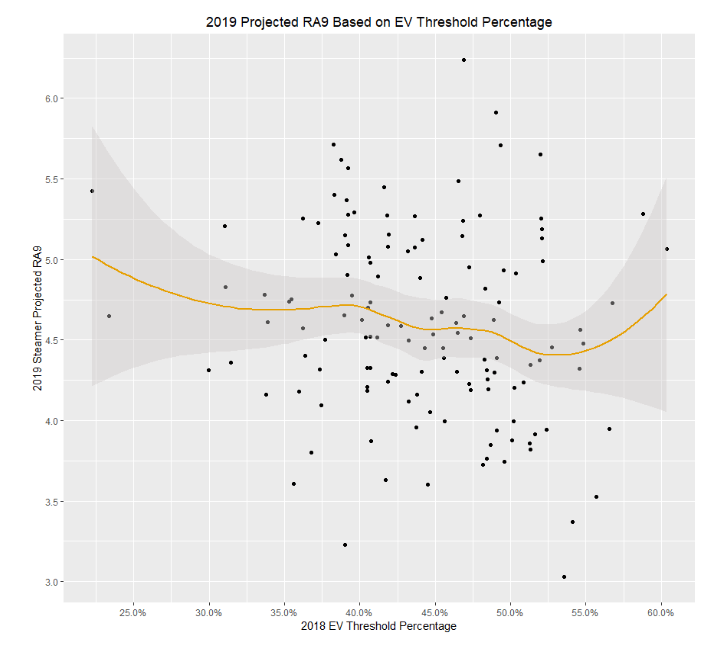
(In neutral counts [0-1, 1-1, 1-0, 2-1], there is a slight, but insignificant relationship between EV Threshold Percentage and Projected RA9. Perhaps in specific instances EV sequencing could benefit an individual pitcher, but an overall effect is not found in our sample.)
Considering that EV threshold percentage is only slightly correlated with Projected RA9 after accounting for context, we found it unlikely that EV sequencing can help a player perform significantly better over the course of the season.
Test Summary
- EV Theory Claims that:
- Using EV sequencing can help a pitcher obtain better results over the course of a season
- We calculated EV metrics on a per-season basis for every MLB pitcher during the 2018 season.
- Weak correlations were found between performance and EV metrics for pitchers with at least 100 pitches thrown
- Slight, but notable correlations between performance and EV metrics were found for pitchers with at least 1,000 pitches thrown
- This was due to a strong count and pitch-type effect influencing our results
- After controlling for context, we found that EV metrics were not significantly correlated to overall performance
- Results: It is unlikely that EV sequencing can help a player perform significantly better over the course of a season
Is a Pitch Up and In Really Perceived 4-5 MPH Faster Than a Pitch Down the Middle?
Given that we had come up a bit short in finding much evidence to support the basic tenets of EV theory, we began questioning whether our initial EV zone adjustments were to blame. Perhaps there are large discrepancies between our zone and Husband’s that were causing our results to falter, or, even more concerning, perhaps neither of our zones were quite that accurate at depicting reality and subsequently need to addressed.
To find out what a true EV zone adjustment should look like, we decided to pull HitTrax batted-ball data on all of our professional hitters during the past professional off-season. The reason for using HitTrax in this analysis is quite simple: the system is able to measure point-of-contact depth directly, allowing us to more accurately measure the relationship between where a pitch crosses home plate and how far it needs to be hit out in front.
After smoothing depth of contact by plate location for every batted ball in our data set, we were able to produce the following visualization:
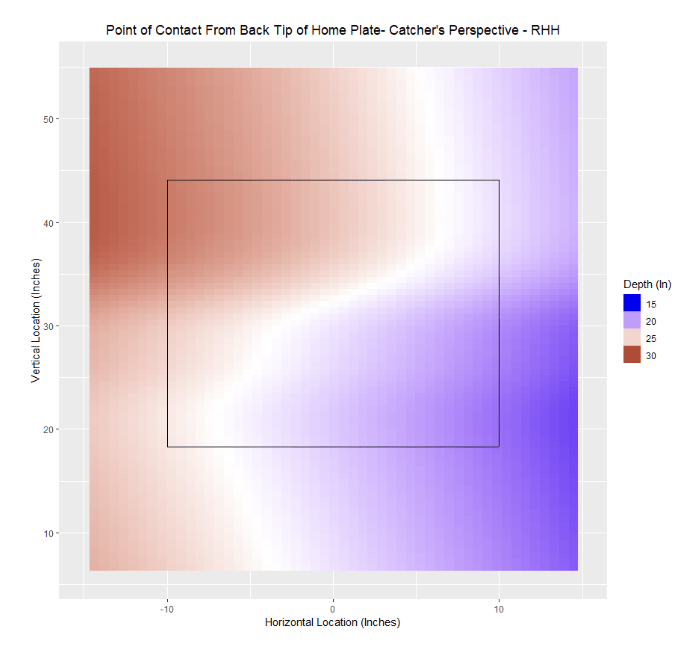
(We leveraged HitTrax data to measure the relationship between point of contact depth and pitch location. For pitches up and in, batters made contact farther out in front of the plate than average, which is shown in red. For pitches low and away, batters made contact a bit deeper than average, which is shown in blue. The white S-curve represents an average point of contact depth, equivalent to roughly 23 inches in front of the back tip of home plate. This aligns quite closely with Husband’s “Zero Line” and resembles most publicly available EV zone adjustments)
Right away, we saw immediate agreement with what EV theory and intuition suggest: pitches up and inside are hit farther out in front, pitches low and away are allowed to travel deep, and pitches that stretch diagonally across the zone from down and in to up and away are hit at average depth.
Translating Contact Depth By Location Into EV Estimates
While certainly a promising initial result, we still had more work to do in order to translate these predicted point-of-contact estimates into effective velocity adjustments.
- First, using the regression built on our HitTrax dataset, we fit each pitch in our Statcast database with a point-of-contact estimate based on the reported horizontal and vertical location of the pitch.
- Next, we derived an estimate of a 55ft release point for each pitch, calculated the amount of time it took each pitch to travel from 55ft to the estimated point of contact, and translated that figure into an mph estimate using a simple non-linear regression equation.
- With true Effective Velocity estimates in mph for almost every pitch within our dataset, we simply subtracted this value from Release Speed and derived a true EV adjustment.
Since all of our pitches in our dataset were still classified by Barksdale’s zone to accommodate our initial EV adjustments, we simply re-grouped each pitch by zone, averaged each pitch’s true EV adjustment, and compared the results using the visualizations below.
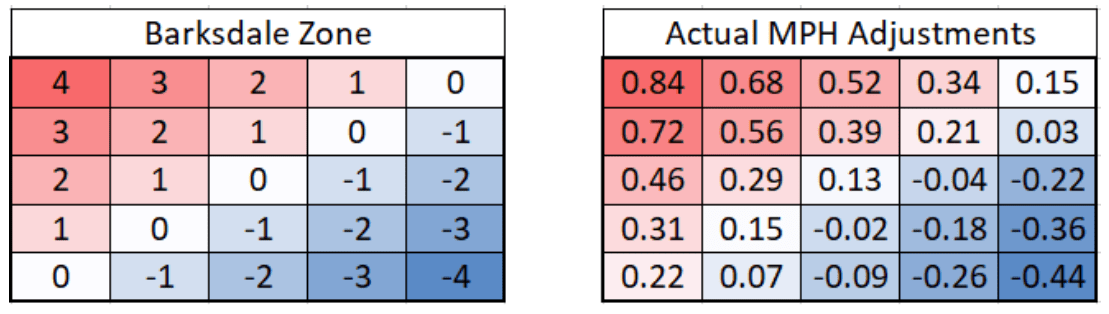
(The graphics above compare the Xan Barksdale zone [left], which was used in our initial analyses, with actual EV MPH adjustments [right], based on directly observed point-of-contact data and simple physics equations. Although EV theory correctly predicted the direction of requisite MPH adjustments needed to control for a batter’s estimated point of contact at a given location, it seems to have over-exaggerated the scale.)
Clearly, the results indicate that there is a misrepresentation with the scale at which EV zone adjustments are applied in the public domain. While Husband’s estimates suggest that there is a 8-10 EV MPH spread between pitches at the extremes of the strike zone, our research indicates that a more accurate figure is somewhere closer to 1.25 EV MPH.
Validating Estimates of Effective Velocity
To examine which EV zone adjustment was more sensible, we turned to Alan Nathan’s trajectory calculator and compared three hypothetical pitches thrown with equivalent EV MPH readings and a constant release point. More specifically, we used a 90 mph fastball thrown down the middle, an 86 mph fastball located up and in, and a 94 mph fastball located low and away.
Since EV theory suggests that all three pitches should be hit with an equivalent reaction time based on respective point of contact estimates, we should expect to see a large, but reasonable, spread of contact depth among the three pitches if traditional EV adjustments mirrored reality (as depicted in the visualization below).
Instead, we observe that batters would need to possess nearly 6 feet of plate coverage to be able to hold reaction time equal for all three pitches! More specifically, if we assume that the point of contact for a 90 mph fastball down the middle is 23 inches from the back edge of home, this would mean that an 86 mph pitch would have to be hit 68.6 inches in front of the back edge of home, on average, whereas a 94 mph would have to be hit 1.9 inches behind the back edge of home, on average. For comparison, our newer estimates assume that batters would only need roughly 11 inches of plate coverage to hit those same three pitches at a similar reaction time.
When considering the distribution of contact depth realized by our own athletes, we find little support for traditional EV reaction-time adjustments within this analysis.
Test Summary
- EV Theory Claims that:
- Pitches located in the strike zone are perceived to be up to ~4-5 mph faster or slower than a pitch down the middle dependent upon where an estimated point of contact with the pitch is located
- We used ~5,000 BIPs measured by HitTrax to fit point of contact estimates for every pitch at the MLB level since 2015
- We then calculated the reaction time afforded to each batter both with and without accounting for an estimated point of contact
- These reaction times were translated into units of miles per hour to obtain revised EV adjustments
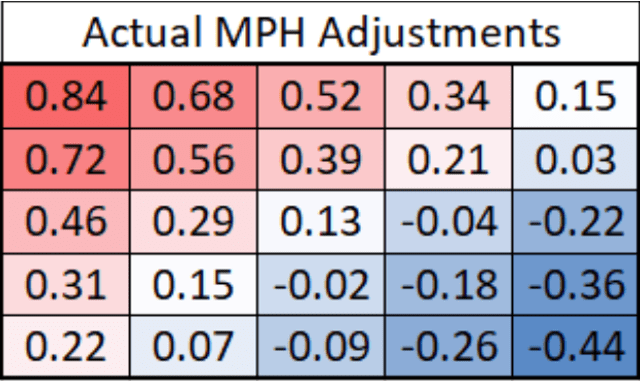
- Our Effective Velocity estimates ranged from +.84 mph to -.44 mph at the extremes of the strike zone
- These results were validated using in-gym point of contact data and Alan Nathan’s trajectory formulas
- Our Effective Velocity estimates ranged from +.84 mph to -.44 mph at the extremes of the strike zone
- Results: We find it highly unlikely that a batter perceives a ~10 mph spread in velocity due to varying contact points by locations
Does EV Sequencing Theory Benefit From Precise Zone Adjustments?
By confirming our suspicions that fallacious zone adjustments were interfering with our ability to accurately measure whether EV sequencing theory has any validity at the MLB level, we were motivated to re-run our earlier test on EV sequencing theory to see if our preliminary findings would be affected.
So, we broke out our newly created EV adjustments based on the analysis directly above, and re-classified every pitch in our data set as either being inside or outside the +/- 6 EV MPH threshold. Of course, because our new EV zone adjustments are significantly smaller in scale compared to our old adjustments, we expected to see quite a few pitches from the “outside” classification in our initial analysis make their way to the “within” classification in our new analysis, potentially influencing our prior results.
(Our updated tables comparing the average performance metrics of pitches classified as either within or outside the +/-6 EV MPH threshold show that despite using more accurate EV adjustments, we still find no evidence of EV sequencing theory using Statcast data.)
As predicted, our “within” classification bucket grew in proportion to the “outside” classification bucket by about 76,000 pitches, but given that our entire sample included over two-million pitches, this really only represented about 3-4% of all pitches in the dataset. Without much transfer of pitches between classification buckets, it was obvious that we would once again observe that pitches outside the EV MPH threshold were typically hit harder than pitches within the threshold (albeit with less authority than before), but that this relationship would reverse course once we controlled for count via our Intrinsic Run Values.
The key takeaway here is that despite significantly altering our EV zone adjustments, the proportion of pitches within each classification bucket didn’t change much. This tells us that pitch selection is likely the primary driver of EV sequencing, rather than location, and regardless of whatever zone adjustments applied to a dataset, it’s unlikely to find much support for EV sequencing theory.
Test Summary
- Do more accurate EV adjustments support EV sequencing theory?
- With our new adjustments, we compared offensive production against pitches thrown within or outside +/- 6 EV MPH of the previous pitch
- Exit Velocity and xwOBACON were found to be slightly higher for pitches thrown within +/- 6 EV MPH of the previous pitch
- When controlling for necessary context, batter production increased against pitches thrown outside of the +/- 6 EV MPH threshold
- Results: Regardless of the EV estimates used, it is unlikely that EV sequencing theory is supported at the MLB level
Can Effective Velocity on Fastballs Significantly Influence the Performance or Talent Level of a Given MLB Pitcher?
Without being able to validate tangible components of EV, we began to question whether there was really any value added by adjusting a pitch’s release speed to account for the reaction time gained or lost by a batter via a point of contact estimate. Up until this point in our analysis, no measurable component of EV theory had been supported, and at its most basic level, it was still unclear whether Effective Velocity provided any additional statistical power that Release Speed didn’t.
Thus, we felt it was necessary to run one final test to see whether pitchers can leverage Effective Velocity on their fastballs to achieve better outcomes in overall performance.
Correlating Fastball EV Metrics to Performance
Similarly to our per-player analysis above, we filtered our 2018 database by fastballs and calculated the per-player averages for a variety of relevant performance metrics. Effective Velocity (based on our Barksdale estimates), EV – Release Speed (which isolates the effect of pitch location on batter reaction time in units of mph), and Release Speed were all added into the mix to allow for us to directly compare Effective Velocity’s ability to describe performance relative to Release Speed. Once all of the metrics were compiled, we developed a correlation matrix demonstrating the relationships among all of our values.
(The matrix above is based on 2018 data for fastballs only. At first glance, EV – Release Speed, which is just a consideration for point-of-contact estimates translated into mph, correlates quite well with swinging strike % and has a slight relationship with our proxy for talent. However, when release speed is added back into the equation, we see that Effective Velocity provides no added value relative to release speed in any of our performance metrics.)
At first glance, the EV – Release speed metric seemed to do pretty well on its own in relation to overall performance. For example, the correlation between EV – Release Speed and swinging strike percentage was found to be .31, indicating that reducing batter reaction time via EV principles may have some merit in generating a whiff. Additionally, when looking at the relationship of EV – Release Speed and Projected RA9, we observed a slight, but promising, relationship between the two, indicating that perhaps leveraging EV theory on fastballs might not be such a bad idea after all.
However, a closer examination of the results above revealed that most of EV – Release Speed’s statistical power was based off of a slight correlation of .127 with Release Speed itself. When comparing Effective Velocity directly to Release Speed, we found that EV did no better in correlating with our proxy for true talent (Projected RA9). Although it may have had a slightly stronger correlation with swinging strike percentage, this likely had more to do with pitchers manipulating vertical approach angle and exploiting above-average vertical break than it did minimizing batter reaction time. As proof of this concept, once we separate pitchers into EV – Release Speed leaders and laggards (shown below), we see that most pitchers are locating their fastball primarily based on the pitch’s movement profile, rather than adding hypothetical ticks onto their fastballs.
(These leaderboards represent the pitchers who led the league in using location to either add or subtract EV MPH to their fastballs in 2018. Given that several of the leaders have above-average carry on their fastball, whereas the laggards predominately throw sinkers, it seems reasonable to suggest that most pitchers are looking to locate their fastballs in areas that suit their movement profiles, rather than to manipulate batter reaction time.)
We believe that this is enough evidence to suggest that Effective Velocity has little ability to predict or describe performance, and conclude that MLB pitchers do not use EV principles on their fastballs to gain a competitive advantage over their peers.
Test Summary
- EV Theory claims that
- Pitchers can benefit from adding velocity to their fastball by throwing to specific locations
- We calculated EV metrics on fastballs for each pitcher during the 2018 MLB season
- It was found that Effective Velocity did not describe performance more accurately than release speed
- We believe pitchers predominately throw to areas of the strike zone that complement their movement profile, rather than to add velocity to their fastball
- It was found that Effective Velocity did not describe performance more accurately than release speed
- Results: It is unlikely that pitchers benefit from throwing to a specific location to add velocity onto their FB
Can Perceived Velocity on fastballs Significantly Influence the Performance or Talent Level of a Given MLB Pitcher?
With the understanding that Effective Velocity had little association with performance outcomes at the MLB level, we hypothesized that the same should likely be true of Perceived Velocity, given that it also adjusts pitch speed in units of mph based on batter reaction time. Thus, we obtained 2018 player estimates of Perceived Velocity via Baseball Savant and joined these values with our previously created database. By subtracting Release Speed from Perceived Velocity (PV – Release Speed) and switching out our Effective Velocity metrics for our newly calculated Perceived Velocity metrics, we were able to update our correlation matrix to compare the relationship between Perceived Velocity and relevant performance metrics in the table below.
As was the case when looking at EV metrics, Perceived Velocity was found to have a slight edge over Release Speed in swinging strike percentage, but once xwOBACON and Projected RA9 were considered, Release Speed once again remained king.
These results provide more concrete evidence that manipulating batter reaction time (within the constraints of the rules of the game) to gain a competitive advantage on the mound is perhaps a more complicated task than initially believed. In considering this, it is understandable that EV theory would struggle to hold up against more rigorous analytical testing.
Test Summary
- EV Theory claims that
- Pitch velocity should be adjusted based on batter reaction time
- To validate our findings above, we substituted our Effective Velocity metrics for Perceived Velocity metrics
- It was found that Perceived Velocity did not describe performance more accurately than release speed
- We believe pitchers predominately throw to areas of the strike zone that complement their movement profile, rather than to add velocity to their fastball
- It was found that Perceived Velocity did not describe performance more accurately than release speed
- Results: It is unlikely that pitchers benefit from manipulating batter reaction time (within the rules of the game)
Main Takeaways
Why Do Perceived and Effective Velocity Have Little Impact on Pitch Outcomes?
As we wrap up our analysis on EV theory, we are left wondering why Effective and Perceived Velocity do not provide additional information related to overall performance when compared to raw Release Speed. Surely controlling for batter reaction time has to account for something, right?
In our opinion, we believe that Effective and Perceived Velocity fall short of the mark because both inherently contain unnecessary assumptions that oversimplify complex interactions with a batter’s ability to perceive an incoming pitch.
For example, if Effective and Perceived Velocity were true in absolute terms, we would have to observe the following:
- That the speed at which a pitch travels has no influence on the ability of the batter to predict a pitch’s movement profile and location. Rather, the only important variable related to pitch speed that influences a hitter’s ability to perceive an incoming pitch is the amount of time a batter has to react.
- That every batter has the same contact point profile at a given location and/or perceives above or below average extension in the same manner.
- That arbitrary measurements of distance (inches) lost or gained via a pitcher’s extension or a pitch’s point of contact estimate can be translated into advanced perceptual units.
Aside from all three of these rather large assumptions likely being false, the names of both Perceived and Effective Velocity imply that batter perception can be accurately measured without considering task demands (Gray, 2013), fatigue (Proffitt, 2006), swing mechanics, or any object in the batter’s perceptual environment (Scott & Gray, 2009), which we know can all play a significant part in how a batter observes the speed of an incoming pitch (Fajen, 2007).
Simply controlling for reaction time in units of mph gives us only a small slice of the information necessary to determine how a batter perceives the speed of an incoming pitch. We believe that the public would be much better served with an accurate reaction time estimate for each pitch, rather than a metric that attempts to translate velocity and distance into units of time. That way, other sequencing models would have the opportunity to build on this information more efficiently than EV and PV have led us to believe.
What Do These Results Mean for Pitch Sequencing Moving Forward?
In spite of the belief that EV theory can provide pitchers with an ultimate sequence for success, the analyses above find very little indication that EV theory is effective at the MLB level.
While disappointing, we find it important to acknowledge that pitch sequencing will likely always be an art-form to some extent, and that Perry Husband’s EV theory has helped pave the way for some of the more important qualitative discoveries surrounding pitch sequencing in the past decade. As a result, we do not view this analysis as a step backward in terms of what we know about pitch sequencing; instead, we view it as an important stepping stone in disseminating theory from fact and art from science.
As technology progresses and more sophisticated data sources become publicly available, there will be countless opportunities to unearth important discoveries related to pitch sequencing. However, some level of skepticism about existing and emerging theories is essential as we refine our knowledge of pitch sequencing and attempt to put our players in the best position to succeed.
Click Here to Jump Back to Text. Note: Batters and pitchers were controlled for as Random Effects. A linear mixed model was used in this analysis.
This article was written by Research Analyst Dan Aucoin
A large kudos is extended to Michael O’Connell for editing and reviewing
Comment section
Add a Comment
You must be logged in to post a comment.
Steven Wammer -
Would you be willing to share what the actual number in inches from the back of the plate the four ‘corners’ of the strike zone [up/in, up/out, down/in, down/out] were? (can estimate by the shade but would like the numbers). Thanks
Isaiah Nunez -
Would the Percentages and data used in the EV sequencing theory used by Perry Husband’s study be invalid given the cheating taken place that year by the Astros? I don’t know what teams were used to conduct that study specifically. Great stuff as always. Just curious. Thank you.
David Besky -
Isaiah, thanks for the question, it is interesting to revisit analyses considering that information. I’m not sure what numbers Perry Husband would have looked at specifically, but I suspect it would be league wide data from a similar time period to the one Dan used in his analysis here (2015-2018). This would have included data from when the Astros, and other teams potentially involved in electronic and non-electronic sign stealing. Nonetheless the inclusion of a large body of data gives us reasonable confidence that even if we were to exclude potential culprits there, we would still obtain qualitatively the same results. Other results such as looking at point of contact depth from Hittrax and calculating velocity adjustments for each location using physics that do not factor in in-game performance would remain unaffected.