An Introduction to K-Vest

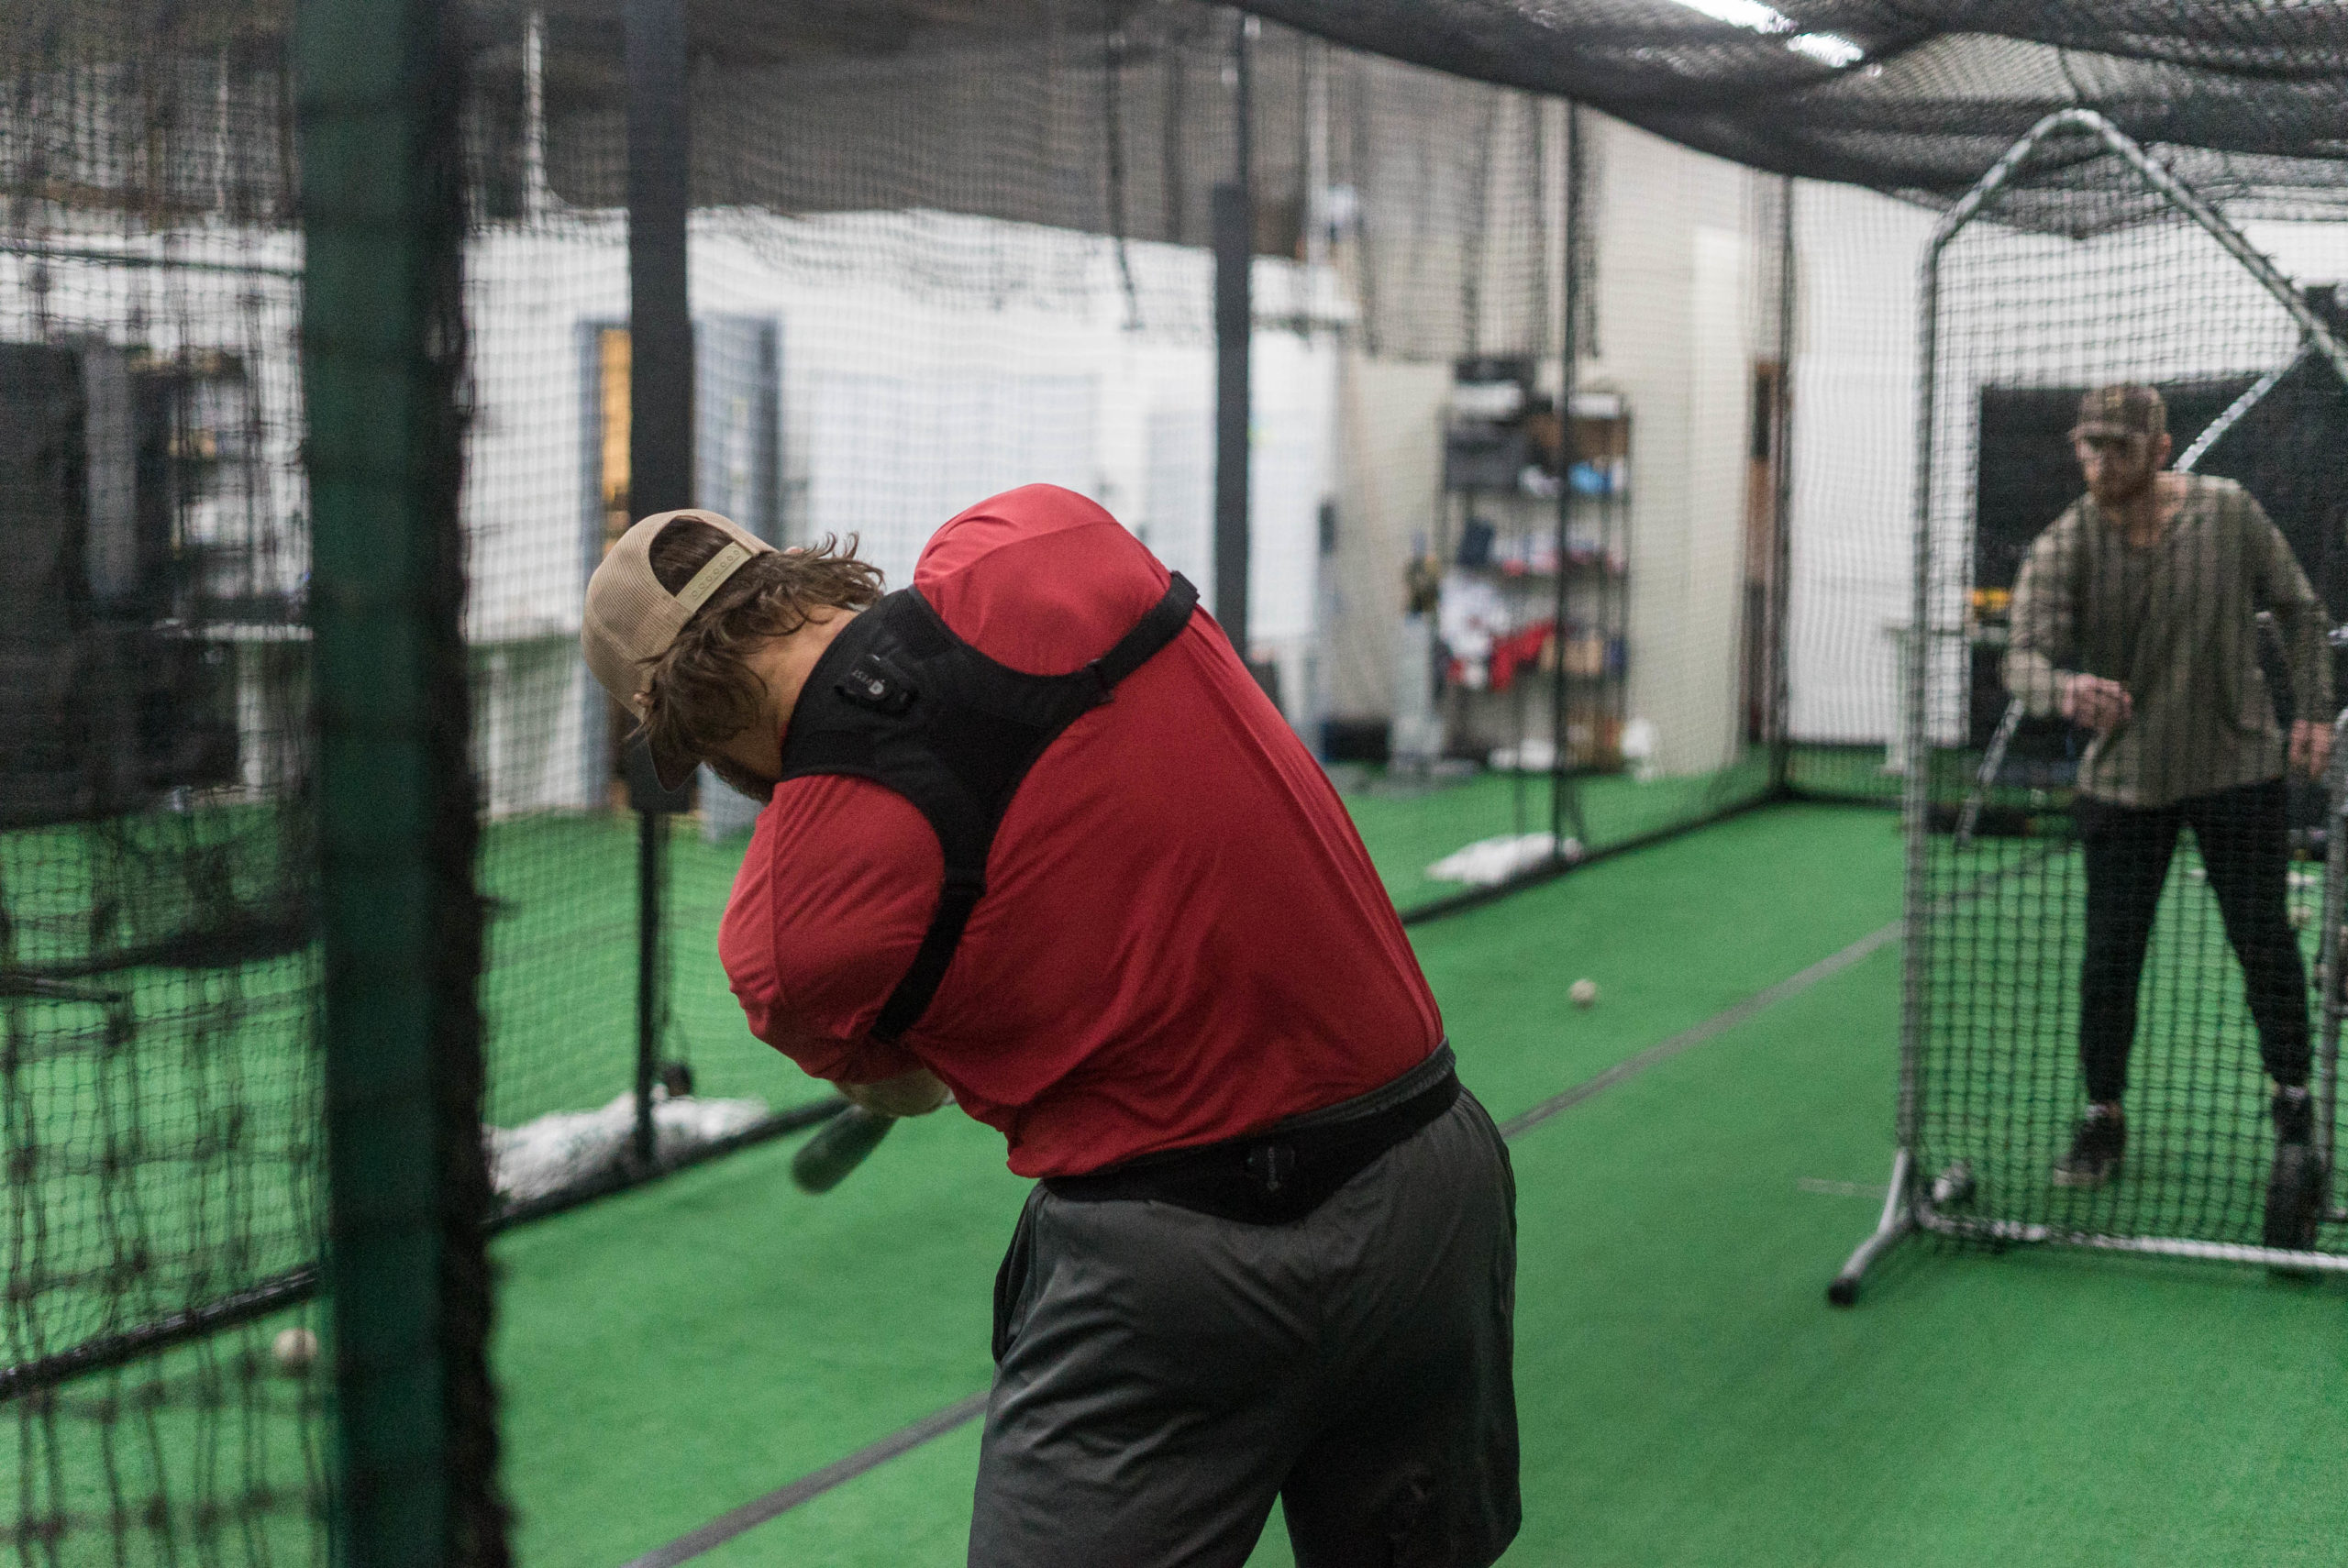
K-Vest by K-Motion was originally intended for golf instructors since it provides a quick look at a player’s biomechanics and real-time measurements. These are then used to provide a mobile, and effective, biofeedback training tool. As K-Motion became successful in the golf world, it became clear that the technology could be applied to other rotational sports, making K-Baseball the most recent program available in K-Motion’s repertoire.
With the tech revolution in full swing for player development in baseball, K-Vest has become the hot new item for training hitters. It is being implemented at all levels, from private instructors to college and MLB coaches. K-Vest is being implemented in player development by MLB teams as a measure to further eliminate the guesswork when developing elite hitters. With swing metrics and batted-ball data readily available for players (Blast Motion, Rapsodo, and HitTrax, in tech), K-Vest contributes significantly to the development picture by measuring how a player is moving.
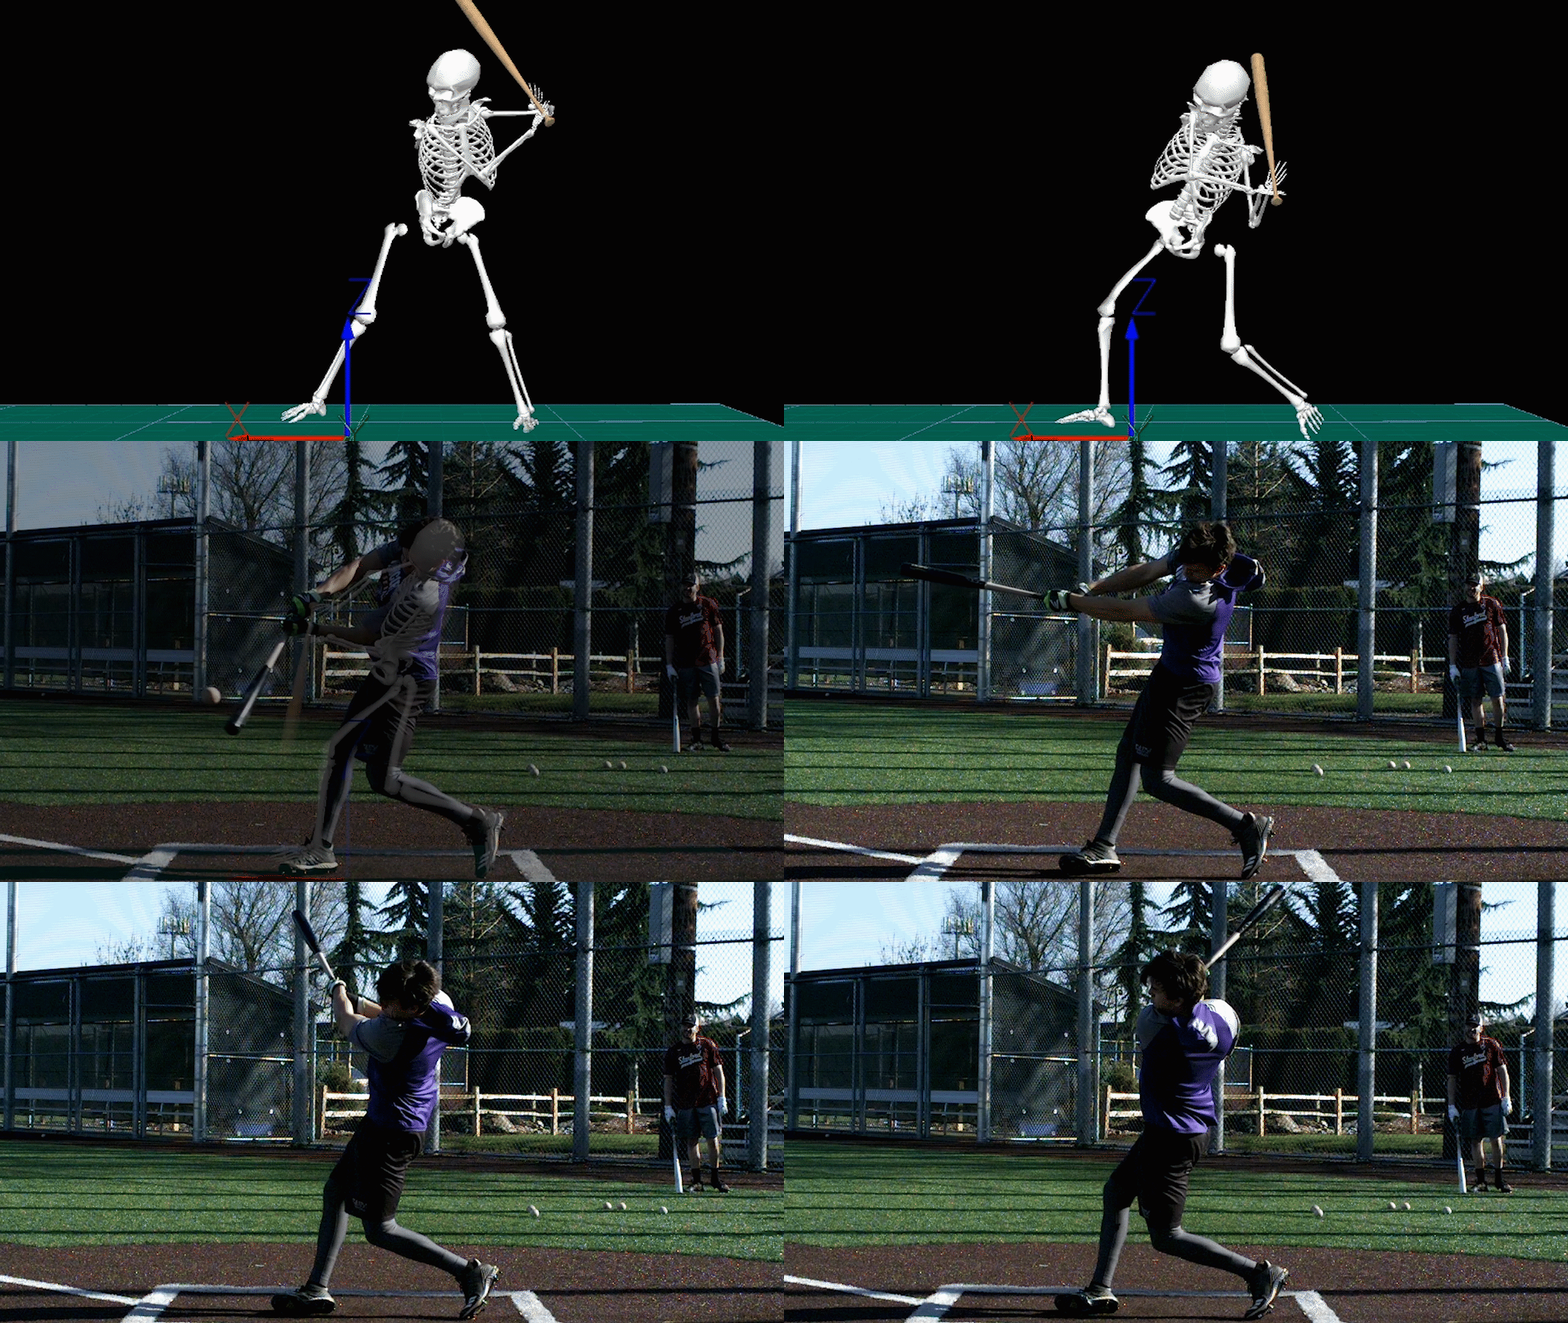
K-Vest measures the kinematic sequence of a player along with tracking body positions at various point of the swing. It highlights positions and rotational velocities at heel strike, first move, and contact. With these metrics, we are able to measure the sequence, rotational speed, and pinpoint a hitter’s body position in space.
This article covers how to use and interpret K-Vest metrics, what an efficient sequence looks like, and includes an example of how to train a hitter using K-Vest.
So, what do all of these metrics mean and what role does K-Vest play in developing the complete hitter? Let’s start with the kinematic sequence and the efficiency report generated after a swing is measured.

Foundations of Hitting
30 modules teaching you everything we know about hitting and hitting mechanics.
A Closer Look at Kinematic Sequence
The efficiency report is based on the measurements taken during a player’s swing. A graph is produced that tracks the rotational speeds of each swing segment, along with the time at which each segment reaches its peak velocity. K-Vest uses four sensors to measure the rotational velocities of the hip, torso, lead arm, and bottom hand. The sensors are placed on the tailbone, top of the thoracic spine, above the elbow on the lead arm, and back of the lead hand.

Think of the kinetic chain as simply transferring energy and speed from the ground up by accelerating and decelerating each segment of the swing, ultimately transferring energy into the barrel of the bat. K-Vest is able to track this transfer of energy by measuring the peak rotational velocities and the manner in which they accelerate and decelerate in order to propel the next segment of the chain forward.
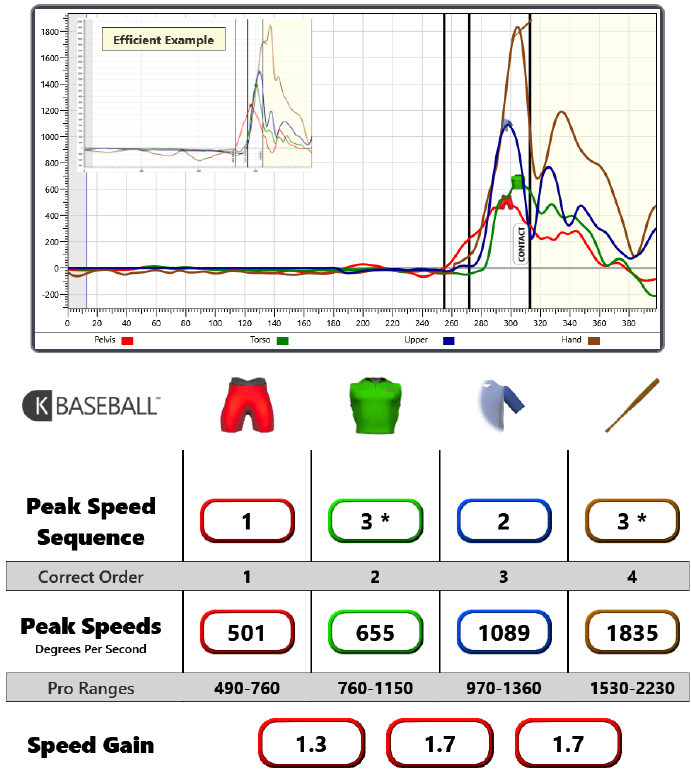
In the graph displayed on the efficiency report, we can see four different colored lines that represent the speed trajectories for each segment of the swing. The red line represents the hips; green, the torso; blue, the lead arm; and brown, the hand. (It is important to distinguish the last segment as hand speed rather than bat speed, keeping in mind that K-Vest measures kinematics rather than bat motion.)

Become the Hitter You Want To Be
Train at Driveline
Looking at the Efficiency Chart
Let’s look at what an efficient kinematic sequence looks like according to K-Vest. This sets us up to look at an example graph of a trainee, begin to make a swing diagnosis, and generate a plan for training.

The first objective when looking at an efficiency graph is to determine whether or not the swing is in the correct sequence. An efficient swing has the pelvis, torso, lead arm, and hands reaching peak rotational velocities, in that order. It is important to understand, especially when pairing to video, that it is not simply the order in which each segment moves; rather, it’s the order in which they reach their peak velocity. The pelvis will reach its peak first, as showcased by the red trajectory reaching its peak height just after first move is initiated. The torso will go next, with the green trajectory peaking closer to contact. The lead arm will peak shortly after with the blue trajectory, reaching its peak a little closer to contact. Finally, the hand will conclude the sequence, with the brown trajectory peaking at or just before contact.
Once the sequence is evaluated, the report provides the peak speeds for each segment, along with the pro ranges for speed to provide some context when looking at a hitter’s rotational velocities. The pro ranges for pelvis rotation are between 490 and 760 degrees per second; torso rotation, between 760-1150; lead arm rotation, between 970-1360; and hand rotation, between 1530-2230. The hitter’s swing should certainly fall in these ranges, ideally at the higher end of each range.
Once the hitter’s speed is evaluated and compared to pro ranges, then the manner in which each segment reaches those speeds can be analyzed.
As mentioned, the kinematic sequence involves each segment accelerating and decelerating, and, therefore, propelling the next phase of the swing into acceleration. The trajectories of each segment on the graph can provide insight into the quality of the acceleration/deceleration process. In the efficient example, each trajectory accelerates and decelerates quickly and efficiently as the trajectories rise and fall at very steep and concise angles. An inefficient graph would showcase trajectories that do not rise and fall smoothly, with curved or flat lines leading up to or after peak speed.
The last metric the efficiency graph provides is speed gain. Speed gain is simply one segment of the sequence divided by the previous segment, and it can further evaluate the quality of the hitter’s sequence. The efficiency graph will provide three numbers for speed gain (torso/pelvis, lead arm/torso, and hand/lead arm). What speed gain is able to provide is a picture of how each segment transitions speed to the next segment of the swing. The pro range for speed gain is between 1.3 and 1.6, and an efficient swing would showcase a speed gain roughly the same throughout the swing. For example, an efficient swing would read a 1.6 speed gain throughout all three transitions.
An Example of How to Train Hitters Using K-Vest
Once the metrics from the efficiency graph can be read proficiently, swing strengths and weaknesses start to stand out. Knowledge on a hitter’s rotational velocities and swing sequence can be the missing link for a coach who is armed with other data, video, or from simply the eye test of watching a hitter take consistent at-bats.
For example, if you are wondering why a strong and physically capable hitter has a low average exit velocity or why a hitter struggles to pull the ball in the air, an out-of-sequence segment or low rotational speed could clear things up and provide a solution.
Understanding the kinematic sequence and how to read a K-Vest efficiency graph will provide the missing link when it comes to movement and is especially effective with combined with other tools such as bat sensors and video.
Let’s walk through an example of how to train a hitter by implementing a K-Vest efficiency graph.

This particular hitter looks out of sequence; the lead arm out paces the torso and reaches peak rotational velocity second, rather than third. There are many potential reasons for the lead arm reaching peak velocity second, but it seems that low torso speed could be the source of the problem.
The torso speed in this particular graph registers 655 degrees per second, which is more than a hundred degrees per second away from the low end of the pro averages. The hip speed is in range but at the very low end, and the graph shows very little separation between torso peak speed and hip peak speed. This should be a red flag as something that a coach needs address.
This is where other tools such as batted ball data, mobility screens, and blast data can be matched with the K-Vest to pinpoint issues in the swing. For example, this particular hitter struggles with depth in the swing and driving the ball through the middle of the field, according to Hit Trax and Blast Motion. This data leads to the conclusion that the lack of disassociation inhibits swing depth and to a push and late flip of the barrel, which results in great speed from arm to hand but a very small window in order to hit the ball hard. (This is a simple example, but this type of situation is where coaching skill comes into play. By this I mean there are many ways to interpret data, but understanding how to pair the data to the player is up to the coach!)
There are many ways to attack these issues: constraint drills done in the cage, strength training, med ball throws, and mobility drills, to name a few. This player in particular would receive a menu of movement prep drills, including various med ball throws meant to improve sequencing, band swings, and constraint drills done in the cage to increase speed and improve hip/shoulder separation. My TPI and OnBaseU are a tremendous resource when it comes to increasing hip/shoulder separation and disassociation. They provide an extensive library of drills for mobility, disassociation and other swing traits.
Conclusion
The K-Vest is a game changer when it comes to hitting development. It is one of the most actionable tools for measuring and describing movement in the swing. Acquiring the skill of interpreting the metrics and graphs that K-Vest has to offer can often become the missing link when developing a hitter or identifying movement strengths and deficiencies. Now, there is a lot of unknown when it comes to K-Vest, but with further data collection, there are some exciting possibilities when it comes to development and finding out what makes the complete hitter.
Train at Driveline
Interested in training with us? Both in-gym and remote options are available!
- Athlete Questionnaire: Fill out with this link
- Email: [email protected]
- Phone: 425-523-4030
This article was written by Driveline Hitting Trainer Max Dutto
Comment section
Add a Comment
You must be logged in to post a comment.
Ricky Norton -
Awesome!
Callix -
Well written article and absolutely agree k-motion over time will be a game changer in understanding player deficiencies and how to create an accurate solution to the problem. I absolutely love utilizing it with rapsodo and video. Will start using a blast as well. We just need additional data from k-motion.