Priming a Hitter’s Brain: EEG Case Study Part 2
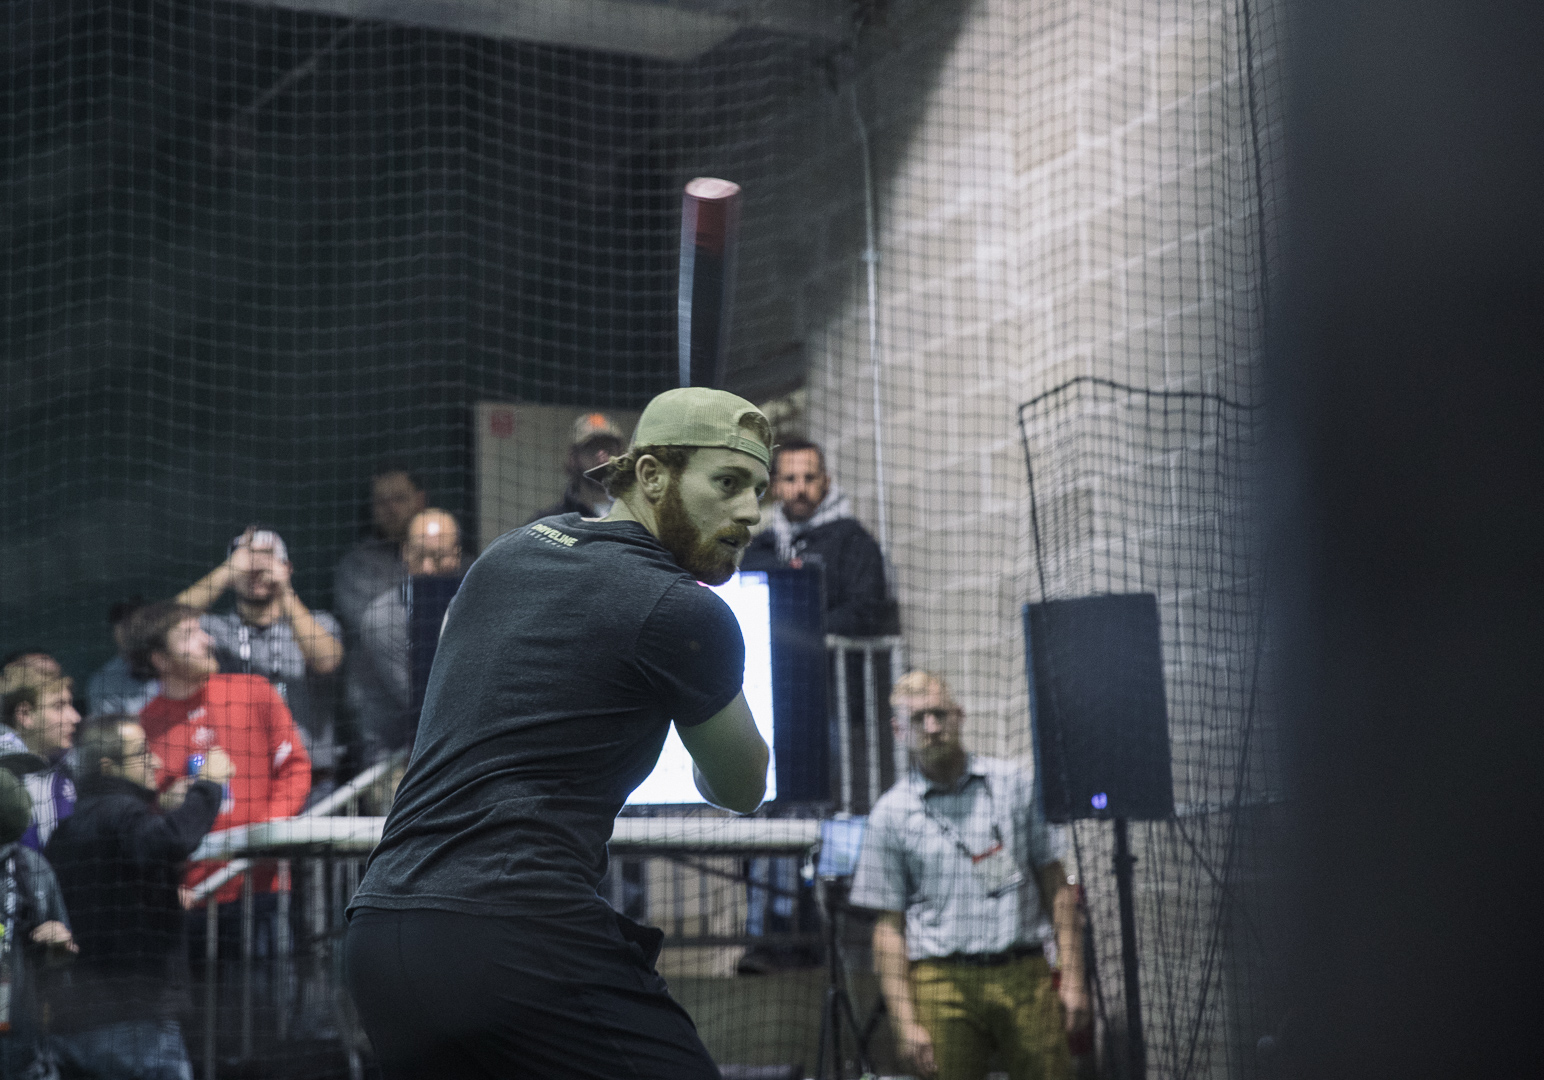
As more metrics become readily available for use in sport performance, we’ve seen baseball go through changes on and off the field, both strategically and developmentally. In Driveline’s never ending quest to optimize player development, one metric that we’ve started to investigate is brain activity measured through an electroencephalogram (EEG) device. While there are still some challenges with measuring neural biomarkers in movement science, measuring brain activity in sports is gaining traction as wearable EEG devices have become more practical for sports research. An article was recently published in Frontiers in Psychology stating the importance of understanding brain activity during sport performance:
Brain dynamics are at the basis of top performance accomplishment in sports – (Cheron et al., 2016)
Breaking down and understanding brain oscillations as biomarkers of performance in baseball has the potential to open another door for player development, adding an extra tool to the metrics and data already being used to validate and optimize player performance.
Quick EEG Review
EEG devices measure electrical activity at the level of the brain. They are able to detect large neuron firings within the cortex at lower frequencies. In sports research, we are mostly concerned with brain activity in the beta wave frequency (12.5-30 Hz). This wave frequency is a good indicator of alertness and conscious processing. It can also be used to indicate inefficient brain activity, as we saw in our previous post where novices actually had more beta wave brain activity in comparison to the experts who had more efficient brain activity. For the sake of this project, we intended to look at brain activity in the same range. For a more in-depth review, check out last year’s EEG Case Study.
Rationale
Noise
Neural noise refers to the random electrical fluctuations within neuronal networks. It has a significant effect on movement and sensorimotor control. When we collect data, whether from motion capture, EMG, EEG, or any other device, there is a “useful signal” related directly to what we are measuring. This is the signal that we care about, but that signal isn’t always clear. Often, that signal is muddied or blurred by noise, a random/sporadic or useless signal that needs to be removed/ignored in order to understand the signal that we actually care about. Think of noise as static interference that occurs on TVs. This “noise” distorts images and makes it hard for us to see what’s actually on the TV.
In his recent book, The Performance Cortex, Zach Schonbrun discusses neuroscience topics related to athletic performance and development (Schonbrun, 2018). He illustrates the concept of neural noise at length in one chapter, including a quote from early research done by Wolpert and Harris that summarizes the theory of noise interference and movement:
Movements can be described as trajectories that minimize post-movement variance in the presence of signal-dependent noise. – Harris & Wolpert, 1998
As discussed by Schonbrun, noise is present throughout all stages of the sensorimotor control loop, from sensory input to motor signal output. Through practice and familiarity of task, we are able to prepare for and adapt to this noise, improving our performance at the task. By applying this model of neuronal noise to athletes, it would make sense that athletes who elicit less noise during brain activity are more efficient with their allocation of brain resources and can perform at their most optimal level.
The Flash-Lag Effect
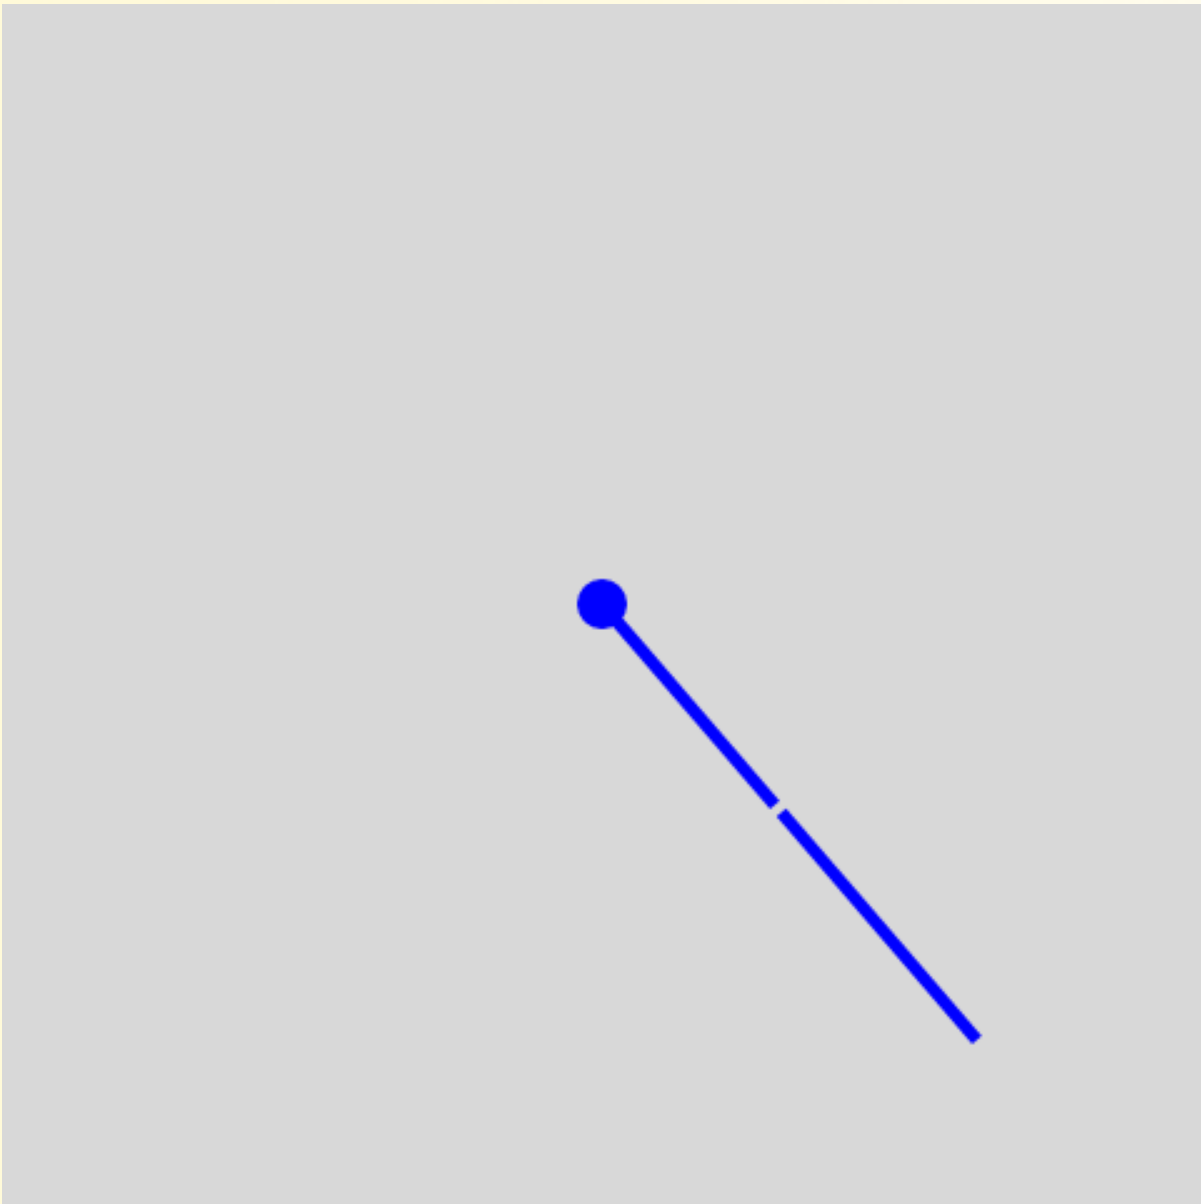
Flash-Lag Effect From Michael’s Visual Phenomena & Optical Illusions (Bach, n.d.)
This gif is a visual representation of the flash-lag effect taken from Michael’s Visual Phenomena & Optical Illusions. As you watch the image, you’ll observe two things:
- Where the two lines nearly meet, the flashing line appears to lag a little behind the other line.
- The flashing line seems to have a different angle where they meet; there’s a kink.
In reality, the two lines align perfectly:
How is this possible? The answer is that your brain actually lives in the past because of the lag processing time of visual signals.
If this is the first time you’ve heard of that concept, it might be difficult to wrap your head around, but it’s actually quite simple! Basically, it’s impossible for your view of the world to be recreated in the brain instantaneously. It takes time for those images to be processed and recreated.
Light signals pass through the eyes and are focused onto photoreceptors that then convert the information into electrical signals, which can be interpreted by the brain. This transfer and process of information is where the delay occurs. There is a significant delay in the arrival of those photoreceptor signals into visual cortical areas (Nijhawan, 2002). Our brains attempt to counteract this delay and reconstruct events into a cohesive picture of the world through planning mechanisms. These mechanisms take into account processing delays that need to occur and, thus, recreate an internal model where moving objects are “perceived” a bit ahead of their assumed trajectory. The brain then plans movements and motor outputs based around this “prediction” of the world.
While the Flash-Lag effect is interesting, it is rarely studied because most daily activities occur at low speeds, where the brains prediction of the world is closely aligned with reality. However, the process of tracking a baseball pitch on the way to the plate occurs in half a second, at such a high speed that the flash-lag effect is applicable. As you track a baseball coming out of the pitcher’s hand, the prediction of what you “see” is actually just the brain’s best approximation, and not what your eye actually sees. Recreating this prediction of the world, specifically the baseballs location as it crosses the plate, requires an allocation of brain resources.
Theoretically, as you track more pitches, you’ll become more proficient at accomplishing this task. As discussed earlier, efficient brain activity can help optimize athletic performance. So, how can we use this phenomena and the concept of neural noise to prepare a hitter for success the moment they step into the box and track their first live pitch of the day? The answer may be priming and how we approach pre-game batting practice. A baseball thrown at 50 mph from 40 feet away is going to elicit a very different flash-lag effect in a hitter’s brain compared to high-speed machine BP; the latter is going be a lot closer to what a hitter sees in games.
The Emotiv EPOC+ Case Study Part 2: Comparing the effects of different practice techniques on brain activity during live pitch tracking
Currently, there is limited research on EEG data and pitch tracking. There has been some work on EEG activity while tracking virtual pitches on a screen (Muraskin, Sherwin, & Sajda, 2015). Because of this, the goal of this case study was to collect EEG data on a hitter tracking pitches while in the batter’s box to begin generating EEG biomarkers of performance within hitting. We don’t really know what a good or bad EEG signal looks like while a hitter tracks pitches coming into the zone, so we can’t really compare signal between different hitters just yet. However, we can look at the amount of noise present in their signal as an indicator of efficiency and performance. We also wanted to investigate whether the signal characteristics changed following different prep work before tracking live pitches:
- No practice or prep (Control)
- Tee work
- Soft toss
- Normal batting practice
- High speed batting practice
We hypothesized that high speed BP would be the most beneficial for an athlete based on the flash-lag effect and the principle of specificity, high-speed BP being the most similar to an in-game pitch thrown in terms of ball sped and flight patterns. We also hypothesized that the brain activity for the first live pitch of the day in the no-practice condition would be the most inefficient (noisy). We used the EmotivePro software in combination with the Emotiv EPOC+ to collect EEG data. These EEG captures were all recorded from the same hitter and taken on separate days to avoid any carryover effect between conditions.
Qualitative Analysis of EEG Data:
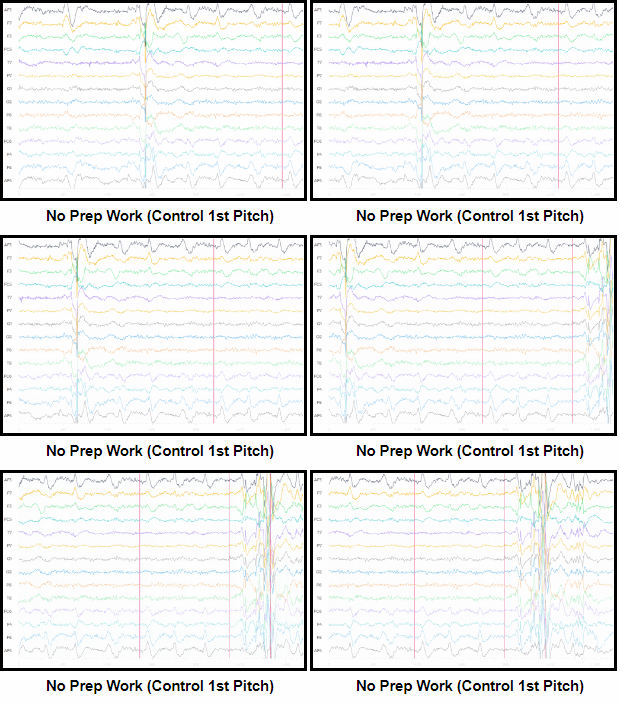
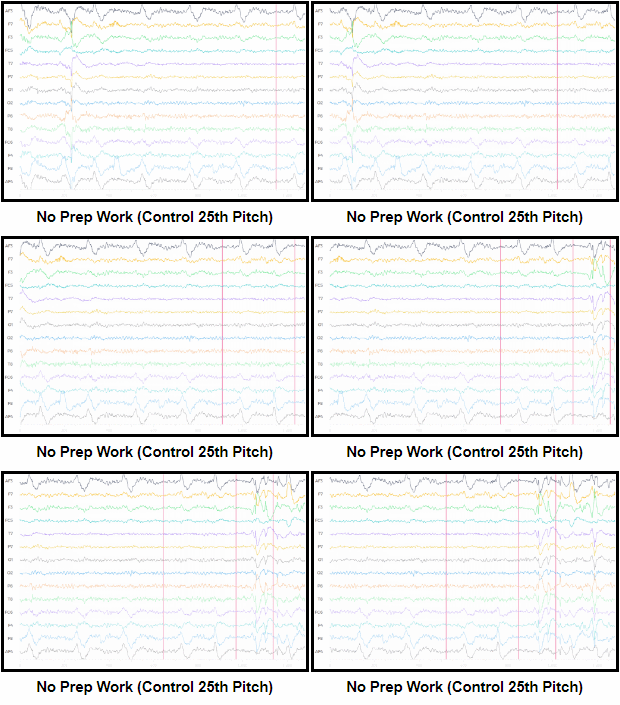
First, we had the hitter step into the box with no prep work or practice swings to get a baseline of what EEG activity looked like for our control condition. We also had him continue to stand in for 25 pitches and recorded EEG activity on the last few pitches of the bullpen:
The images above display the EEG signal across all 14 electrodes (a high-pass frequency filter was applied to help reduce the interference of movement artifacts). We used EmotivPro’s marker feature to label separate time points during pitch tracking for analysis later; these are indicated by the 3 vertical red lines:
1st line: the pitcher comes set
2nd line: the pitcher begins leg lift
3rd line: the ball hits the catcher’s glove.
The area of interest for pitch tracking lies in the latter half of space between the 2nd and 3rd vertical lines:
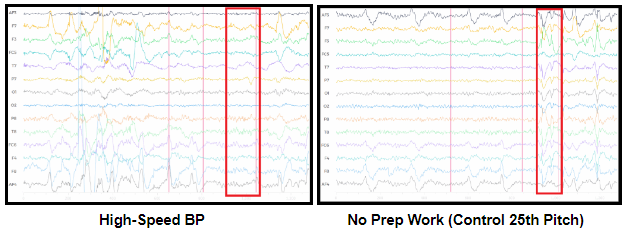
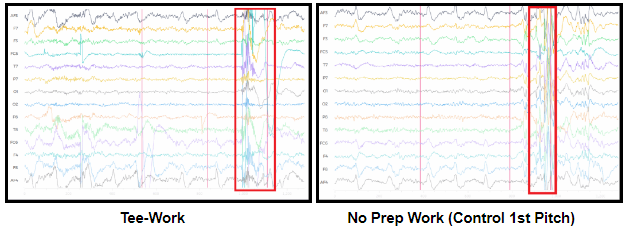
As you can tell, there is a lot of neural noise present while tracking that first pitch of the day. Notice how jagged and sporadic the signal appears in the first pitch of the day compared to the 25th, indicating a significant reduction in noise. This opens the possibility that the more live pitches a hitter has seen on the day, the more prepared he will be to hit. From here, we can now compare EEG activity in pitch tracking following different prep work to these controls to identify differences:
First, pitch tracking following Tee Work: 4-5 rounds hitting off the tee.
Still a lot of noise present during pitch tracking.
Second, pitch tracking following Soft Toss: 4-5 rounds of soft toss.
Again, lots of noise present during pitch tracking.
Third, pitch tracking following Normal Batting Practice: 4-5 rounds of standard batting practice.
Large amount of noise still present.
Fourth, pitch tracking following High-Speed Machine BP: 4-5 rounds hitting off the pitching machine set up on the mound at high speed ( >90 mph)
It isn’t until we get to the high-speed machine BP condition that we see a signal with significantly less noise in comparison to the other conditions. The noise level in this condition actually appears to be lower than when the hitter had tracked 25 live pitches:
Alternatively, the signal recorded following tee work, soft toss, and batting practice appears to be more similar in comparison to the signal recorded during the no-prep work (control) condition:
Quantitative Band Power Analysis
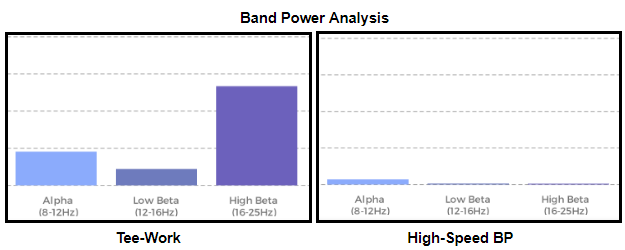
While these gifs and pictures provide some insight into what’s going on during pitch tracking in a hitters brain, the comparisons made above are primarily qualitative in nature. Quantitative analysis of EEG signal is fairly complex and requires further filtering and processing. While we are currently working towards being able to run in-depth quantitative analysis to produce objective data from the EEG recordings in the future, for now, we can use EmotivPro’s band power analysis to compare amplitudes of signal within frequency bands of interest. In our case, those frequency bands will be under the beta wave range:
Both of these band power analyses were performed during the pitch-tracking region of the recording. You can see in the tee-work condition that there was significantly higher amplitudes in the beta frequency range in comparison to the high-speed BP condition, where there was barely any amplitude of beta wave activity, indicating a more efficient allocation of resources and brain activity during pitch tracking after high-speed batting practice.
Discussion and Implications
This idea isn’t really that novel when we think about how pitchers use off-speed pitches to throw off a hitter’s timing. The idea behind a change-up is in its name, to change speeds. This change of speed is supposed to make it harder for the hitter to catch up to the fastball. If that’s the case, in a standard pregame batting practice where the hitter sees low velocity, we’re hitting off pitches that are significantly slower than change-ups, and they are rarely seeing anything that is similar to a game speed fastball. How can we expect a hitter’s timing, and in this case their brain activity, to be prepared and ready for a 95 mph fastball when they step into the box for the first time if they haven’t seen anything like that all day?
Does this research suggest that hitters should exclusively be using high-speed machine batting practice as their primary form of practice and training? Not at all. When training athletes, we look at the big picture and try to create significant adaptations in the long-run that are sustainable. We create individualized training programs tailored towards an athlete’s specific needs based on their assessments, with an understanding of constraint-based approaches to optimize their athletic development. This means that some athletes may not even be in a position where hitting off a high-speed pitching machine is beneficial to their long-term development at the moment. Constraint drills still have a lot of value in remapping athlete’s movement patterns and tendencies.
However, is it possible that high-speed machine BP could be used as an alternative to standard pre-game BP in order to elicit acute adaptations in a hitter’s brain? It’s quite possible, and the data above appears to suggest just that. This case study is by no means the be all and end all of brain activity research in baseball, but it’s a good start in a new frontier of baseball research and player development that’s wide open.
This article was written by Research Associate Anthony Brady
References
Bach, M. (n.d.). Flash-Lag Effect. Retrieved September 6, 2018, from https://www.michaelbach.de/ot/mot-flashLag/index.html
Cheron, G., Petit, G., Cheron, J., Leroy, A., Cebolla, A., Cevallos, C., … Dan, B. (2016). Brain Oscillations in Sport: Toward EEG Biomarkers of Performance. Frontiers in Psychology, 7, 246.
Harris, C. M., & Wolpert, D. M. (1998). Signal-dependent noise determines motor planning. Nature, 394(6695), 780–784.
Muraskin, J., Sherwin, J., & Sajda, P. (2015). Knowing when not to swing: EEG evidence that enhanced perception-action coupling underlies baseball batter expertise. NeuroImage, 123, 1–10.
Nijhawan, R. (2002). Neural delays, visual motion and the flash-lag effect. Trends in Cognitive Sciences, 6(9), 387.
Schonbrun, Z. (2018). The Performance Cortex: How Neuroscience is Redefining Athletic Genius. Birlinn Ltd.


Comment section