Data Collection at the Small College Level

This article was written by former Driveline trainer and current Lake Erie Head Coach Cam Castro. Cam details how to track different pitching metrics at small college level to help pitchers develop. (Twitter: @Castro_Turf)
When I worked at Driveline, I was spoiled. Trackman, Rapsodo, Motus, biomechanics lab, Hittrax, I could go on and on, but everywhere you turned there was an opportunity to collect information and learn from it. When I moved back into the college-baseball circuit, I knew I had to find ways to implement data collection with what was going to be a smaller budget.
What We Do at Lake Erie
We’ve all seen what a mound velo or weighted-ball pulldown tracking sheet looks like, but what you do with those numbers is more interesting. One of the first things we did last year was start comparing mound-velocity data to strike percentages in a given outing or bullpen session. Below are data sets for two of our athletes:
In addition to this data, comparing mound velocities over time is just as valuable.
This data is based on max fastball velocities over the course of the 2017 season and an accurate depiction of velocity growth. It is not linear. It’s difficult, and full of far more time of frustration that elation.
Collecting numbers like this becomes easy for baseball coaches on a budget; it just requires emphasis, effort, keeping a laptop handy—or manually pouring through charts from your intrasquad—and plugging in all the numbers the next day.
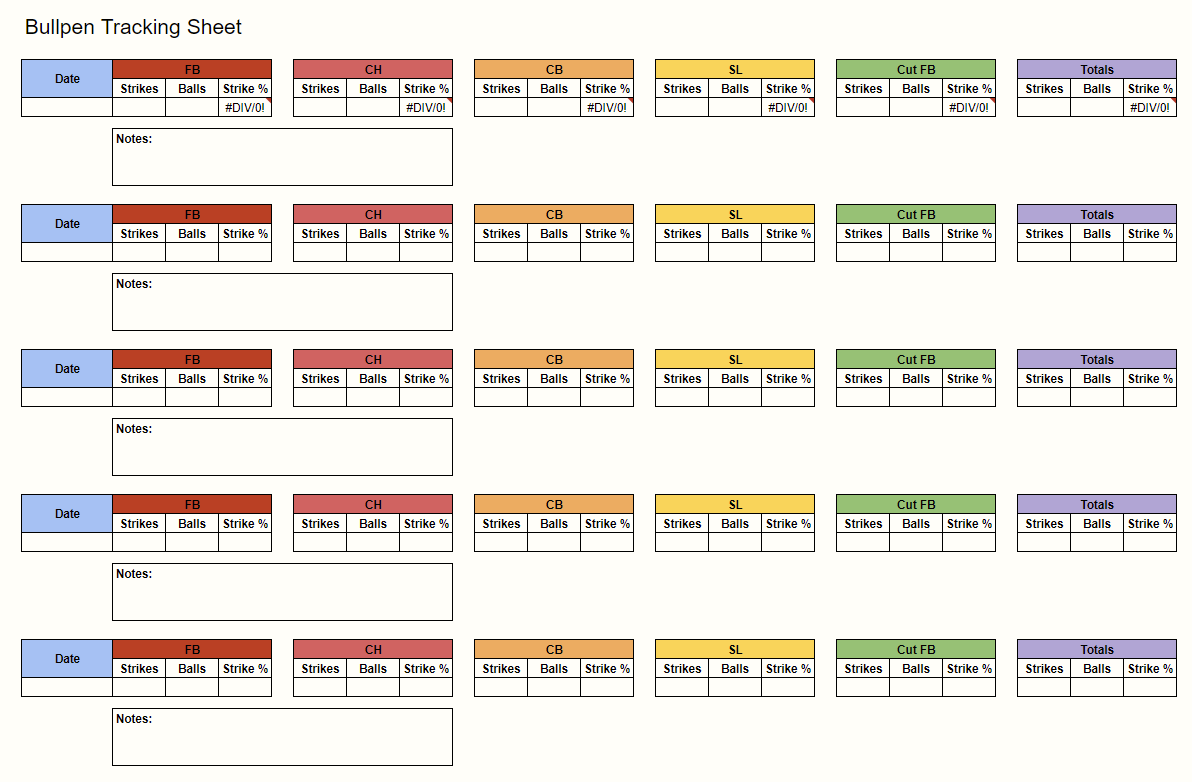
This year, we’ve altered our balls and strikes data collection to more accurately reflect a “per pitch comparison.”

These numbers show the beginning phases of helping refine a pitcher’s repertoire in order to understand what his most successful pitch is in terms of strike percentage. Then, being able to take it one step forward with whiff percentage (total pitches swung at and missed / total pitches swung at) can really help a college pitcher know how and when to use his stuff.
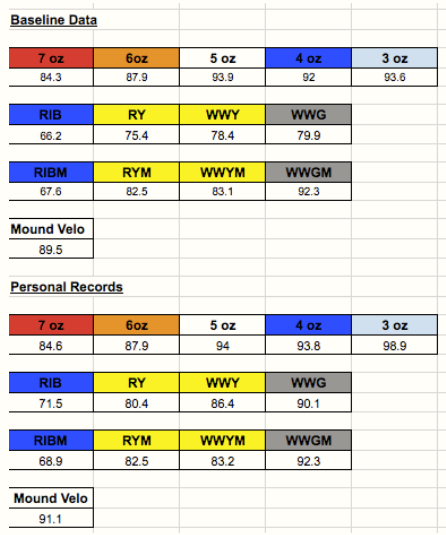
Another must for the college coach on a budget is to learn how to use Google Sheets. I can’t stress this enough; among other things, learning this will let you build out a profile page for each athlete and track baseline numbers against personal records.

Learn how to backfill data and get each profile to essentially upload itself after plugging in the raw numbers.
Tracking things like baseline-throwing data, average velocities, personal records, strike percentages, and whiff percentages is definitely user friendly. As a coach, you just have to be willing to log the time to get it done. If you do, your athletes will benefit most, but it also gives you even more information to make decisions on matchups, rotations, calling pitches, etc.
For us at Lake Erie, each coach on the staff plays a role in data collection. But our pitching coach and former Driveline employee, Stephen Hart, has gone above and beyond in his first year with the program in leading the front on collecting and analyzing the information we are getting from our athletes’ results. Having people on staff who are passionate, understanding, and encouraging of what we are trying to establish on the collection front is essential for me as a head coach.
Logging and tracking numbers using Google Sheets has helped us build out a greater picture of what each athlete goes through in his programming and how to make adjustments thereafter. From movement screenings to weight training and velocity and command data, these have proved to be the easiest numbers to attain and track over time. What’s more, this is very doable for any small-budget college coaches looking to make more educated decisions on their personnel and training programs.
We Can Always Do More
When I got the job here at Lake Erie, one extremely important thing to me was providing our athletes with the best amenities possible. If that meant having to fundraise a bit to do it, then that’s what we would do. My goal is to provide our players with access to equipment and data that they didn’t previously have and continue adding to that toolbox. For us, that has taken shape in in the form of Motus sensors and Rapsodo data.
We’ve been fortunate enough to outfit every one of our pitchers in their own Motus sensor and start collecting data on stress levels, arm speed, as well as a handful of other metrics. I originally set out to use this not only to monitor daily workloads and workload over time, but also to monitor stress levels on high-output days.
Once we obtain stress level data for each athlete in various throwing loads, we can start to tailor programming to that specific athlete’s needs. Basically we are trying to assess what type of high-output or velocity work best fits each athlete. We then conjunctively monitor recovery workloads to make sure stress levels aren’t creeping too high on hybrid days to get a more accurate look at volume.
Below is a look at average Motus data from one of our athletes during the fall season. We’ve broken down the data by Gamedays (Mound Velo), Hybrids and Recovery work.
As we move into the offseason, the goal is to continue to compare his Hybrid and Recovery data to his high output or “velo days” but expanding collection to Pulldowns, Plyo Ball ® Velos and Plyo Ball ® Mound Velo’s as well. We’re aiming to determine what each athlete needs more of and what he needs less of over the course of the winter months.
Our newest addition this fall was the use of Rapsodo’s pitch-tracking system. Up to this point, we’ve mainly used it as another tool for data collection—getting information on spin rates and spin axis of each athlete’s pitches.
An area of interest for us is taking this information, and comparing it to whiff percentages for our players. While there is information available on big league pitchers and their high spin rates correlating to percentage of pitches swung at and missed, does that same correlation trickle down to the college level, where pitchers are throwing with below average MLB velocity but potentially above average Units? We will see!
Why We Do It
At the end of the day, everything we do from a data-collection standpoint is shaped around being able to provide our athletes with the most information possible. This allows us as a coaching staff to make the most informed decisions in games and in training.
Our goal is to objectively look at each athlete, his development, his readiness, and his repertoire in order to produce the most all-encompassing and individualized development plan possible at the small college level.
Comment section