Blog
velocity development
In the past, we have discussed some of the KPIs and metrics the Driveline hitting department uses to both quantify ...read more
7 Likes | 0 Comments
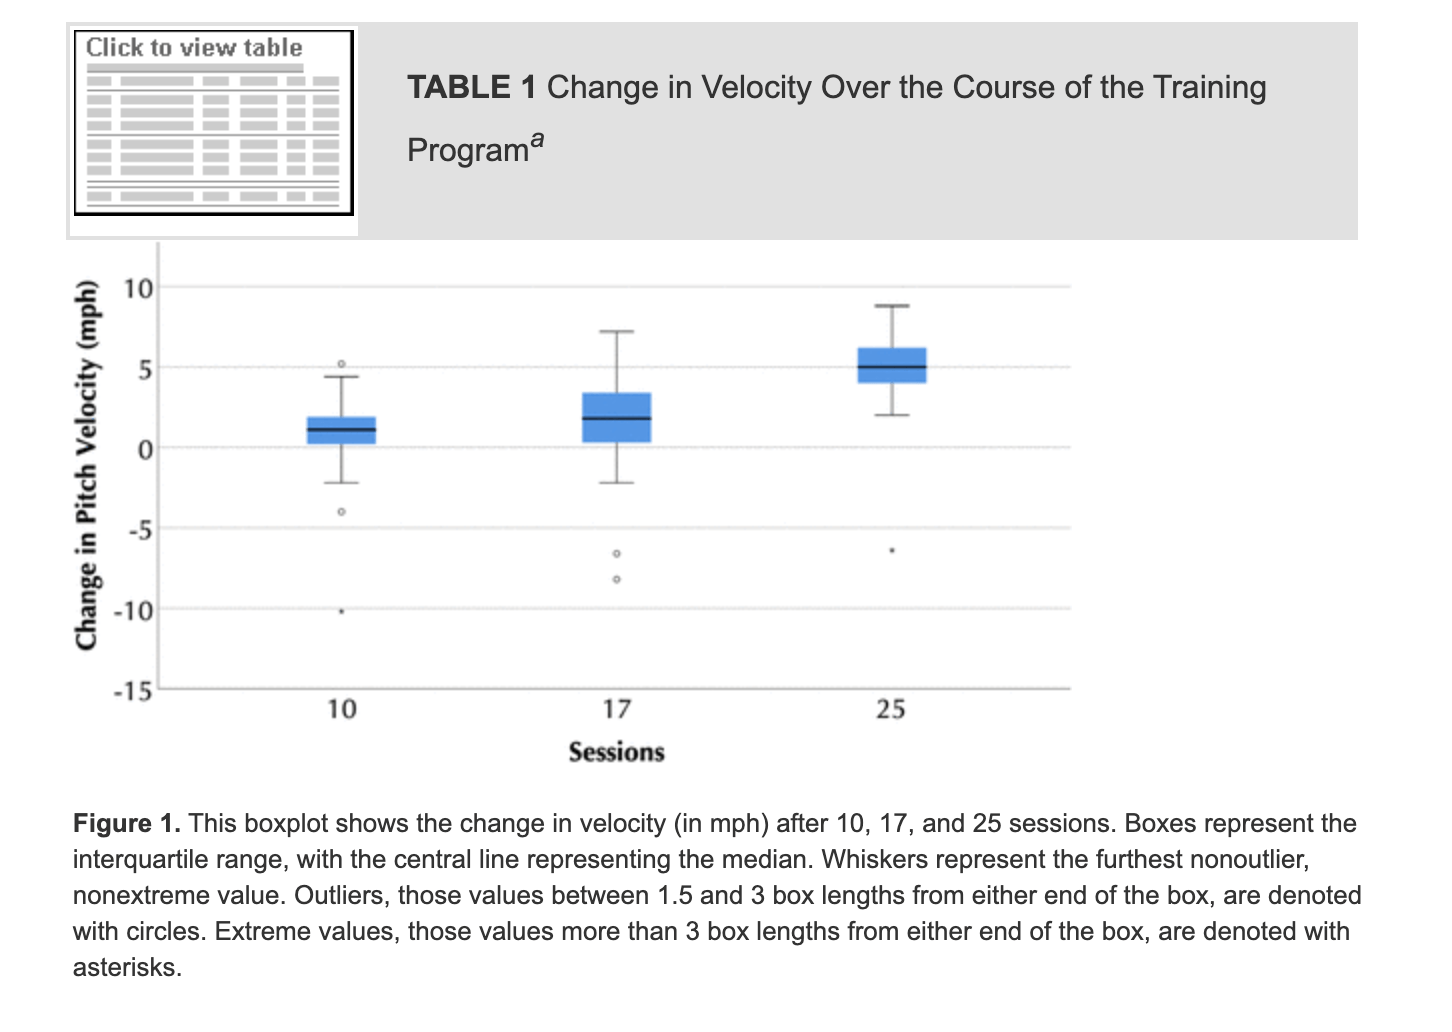
Context Recently, an article published in the Orthopaedic Journal of Sports Medicine used a novel study design and experiment to ...read more
0 Likes | 0 Comments
Though controversial pulldowns are a staple of our off-season program, we see them as vital pieces to train athletes to ...read more
3 Likes | 1 Comment

This articles was written by former Driveline trainer and now Head Coach at Lake Erie College, Cam Castro, detailing how ...read more
0 Likes | 1 Comment
Individiualization. It’s the solution to everything in coaching. Trainees want to be treated as individuals with specific needs and get personal ...read more
0 Likes | 0 Comments
“It doesn’t matter how you get there, as long as you’re putting in the effort.” The Road Less Traveled Can ...read more
0 Likes | 2 Comments

One of the bigger staples of our velocity development program are maximum intent throws to a net using weighted baseballs. ...read more
0 Likes | 5 Comments
I’m going to try to make these posts a little more frequently since the 2013-2014 offseason is here, which means ...read more
0 Likes | 0 Comments

If you missed the Velocity Development Open House for the 2013-2014 off-season, never fear, you can listen to a partial ...read more
0 Likes | 0 Comments
We’ve had a ton of success with our MaxVelo program, which just continues to be improved and improved upon (and ...read more
5 Likes | 20 Comments