How to Scout Off a Stat Sheet

As a small or lower-level school pitcher or pitching coach, one thing that can be frustrating is the lack of resources available to create an effective game plan from game to game and hitter to hitter. You’d have basic reports from a coach that say things that can be discerned from general knowledge:
- “Lead-off guy is a base stealer so be quick to the plate if he gets on.”
- “Three-hole hitter is their dude so pitch around him and be careful.”
- “Six-to-nine guys are scrubs, so let’s attack them early in the count with the fastball.”
Thanks for the heads-up, coach.
So how do we take a deeper dive into preparing a game plan based on the team and the guy we have on the bump? It’s a pretty safe bet that if you are a college or high school coach, you do not have access to Trackman, HitTrax, Rapsodo, etc. for opposing teams, and unless you can travel and watch your opponents play, you don’t have the means to see them in action before first pitch. This leaves us with working off of word of mouth from other coaches (not entirely reliable for a multiple of reasons) and the stat sheet from the opposing team’s website. Since the stat sheet is only objective data we have access to, how can we use those numbers to provide our pitchers with a plan that isn’t filled with bias?

Annie Duke says in her book Thinking in Bets (which I highly recommend) that “Improving decision quality is about increasing our chances of good outcomes, not guaranteeing them.” She then goes on:
“Thinking in bets starts with recognizing that there are exactly two things that determine how our lives turn out: the quality of our decisions and luck. Learning to recognize the difference between the two is what thinking in bets is all about.”
This is the essential part of this process: understanding that what we are trying to do is get as much information as possible in order to make a decision that gives us the best odds of the outcome we desire. You can follow a scouting report from the best MLB R&D department and still give up a home run even if you followed it to a tee. There is always a certain amount of luck and skill involved with every decision, and it’s imperative to judge the quality of the decision not based on the outcome but rather on the odds used to make that decision.
When looking to scout off of the stat sheet, we are in the business of making a decision without having all of the information available to us. Understanding how to make the data we have actionable can give us a better look at how to approach each hitter. The first step to formulating the game plan is to understand what the strengths of each pitcher on your staff are. Trying to conform your pitchers to fit a game plan that plays against their assets is not the most advantageous strategy. For example, let’s say you have a pitcher who has a fastball that spins at an above-average level and has a true top-down curveball with a substantial amount of negative vertical break. Having him pound the bottom of the zone with a heater because a team grounds out at an above-average clip isn’t your best bet—even though intuitively it might seem that way.
If you don’t have access to a Rapsodo, you can still understand an athlete’s arsenal by knowing his average velocity and having a general idea of the shape of his off-speed offerings. Also, do not overlook what pitches the athlete likes to throw. Knowing what an athlete is comfortable with and what he has had success with in the past won’t solve everything but should not be completely disregarded either.
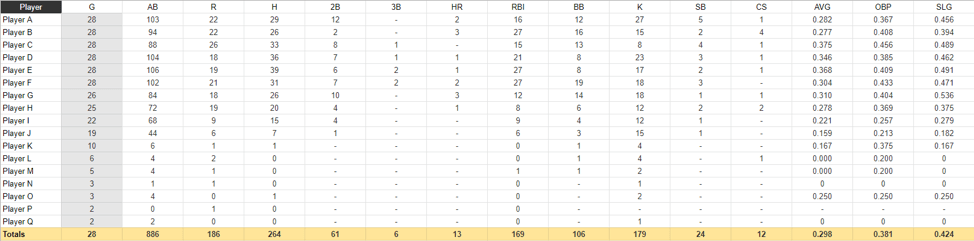
Below is a typical stat sheet found on most teams’ websites:
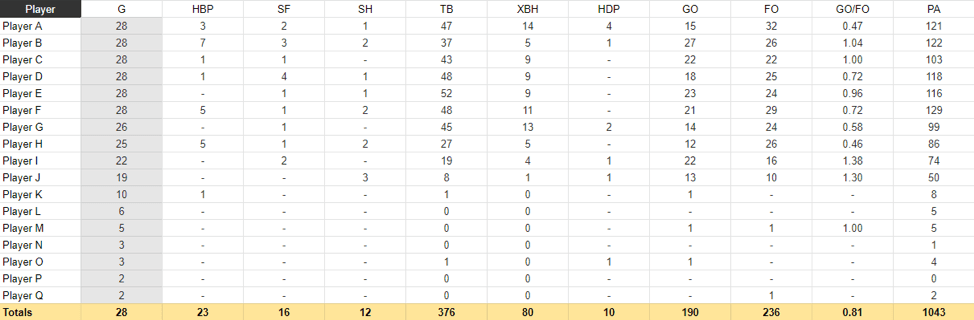
Luckily, this particular conference keeps extended hitting stats as well, so we have this data available:
There are a couple aspects to note as we stiff through the stat sheet. There are typically two samples of information that coaches can choose to look at: season-to-date statistics and in-conference statistics.
Season-to-date statistics include out-of-conference production, which can occur against teams that are either better or worse relative to your conference opponents. Thus, by analyzing out-of-conference stats, we risk potentially being misled by the production of a player who may have only faced better or worse competition before conference play. Also, because cold-weather teams typically play a higher propensity of road games during out-of-conference play, season-to-date stat lines could be skewed depending on where an opposing team is from.
In contrast, looking only at in-conference statistics limits our sample size of plate appearances available for analysis. This is troublesome because there is only so much we can take away from less than a full season’s worth of plate appearances, because stats have yet to become reliable enough to draw many conclusions from them.
To address these issues, we recommend looking at both in-conference and out-of-conference plate appearances, because five in-conference plate appearances tell us more information about a player than five out-of-conference plate appearances do. However, this does not necessarily mean that five out-of-conference plate appearances (or even historical statistics) do not tell us any useful information about a player at all.
However, for simplicity sake, in-conference stats are used below. We also only look at hitters with a large-enough sample size (in this case 40+ PA, so Player A through Player J) so the rest of the team (Player K through Player Q) don’t alter numbers of the hitters you will face in the game. After you have this information, identify areas that you can leverage with each hitter. This starts by trying to find outliers in a hitter’s stats. These can start to paint a picture of the tendencies of opposing hitters. To find outliers, compare these stats against conference averages. (See below.)
K per PA- .16 Std. Dev.- .08
BB per PA- .08 Std. Dev.- .04
GO per PA- .22 Std. Dev.- .06
FO per PA- .22 Std. Dev.- .06
It took a couple hours to create the spreadsheet and run the numbers to get these averages and standard deviations. Knowing how to use Excel or Google Sheets can be great and valuable tool for coaches. For instance, Udemy has some great courses that can help you brush up on your knowledge and teach you a thing or two you didn’t know!
Once some averages are established, we can find what a hitter does well or poorly to exploit in our plan of attack. A previous blog post we are heavily referencing going forward is Choosing the Correct Pitch Sequence: Data-Driven Decisions. (If you haven’t read this article, I recommend it before going forward.)
Below is a chart pulled from Harry Pavlidis’s Updated Benchmarks for Pitch Types:
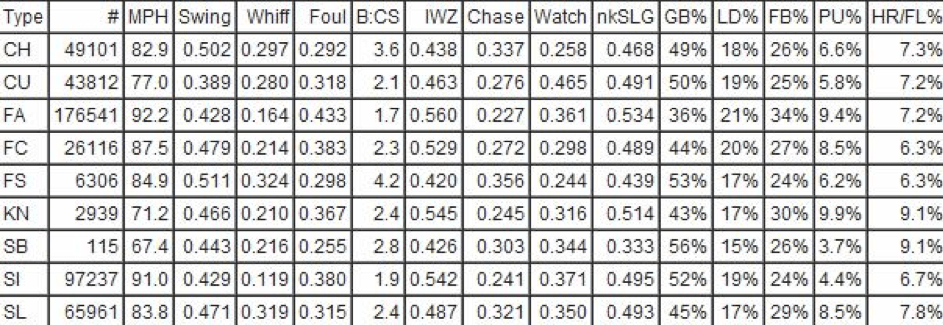
Using the data gathered from the stat sheets with this chart, we can create a somewhat individualized plan for attacking each hitter. Now, let’s take a look some examples of how we can use these numbers to our advantage.
First, Player J. We can see that Player J’s total number of Ks does not stand out among his peers. However, if you compare that against the number of PAs, he strikes out almost two standards deviations above the conference average. With the walks being slightly average and the GOs and FOs normal, we can reasonably discern that this hitter swings the bat more often than taking. This likely means that he has a propensity to whiff. With walks around league average, it’s likely that he would swing through pitches and work counts deep to accidentally draw walk. So, that being said, throwing a fastball early in the count will set his expectations for velocity, and then have your pitcher throw his best off-speed pitch. A slider would be great, due to the high whiff percentage, and since we can assume this hitter will swing, the risk of also not being able to locate this pitch is minimized.
![]()
Next, Player F. He is on the opposite end of this spectrum. The true outlier here is that he walks nearly two standard deviations above the league average. He also grounds out at a lower clip than most hitters. He also leads the team in RBIs and is close in XBHs. He is either extremely lucky or does a good job of getting barrels when he decides to swing. Let’s assume it’s the latter. Throwing a curveball early here could be great because against a good hitter this can disrupt his timing for the rest of the at-bat. Doubling up on this could be a viable option, if you’re looking to avoid serving up a heater early in the count—especially with its substantially higher watch rate over other pitches. After this, depending on the handedness of the pitcher, we can look at going for a slider or a changeup to polish him off and save the fastball for later in the count.
![]()
Now, Player H. He is pretty straight across the board for BB and K but favors one batted-ball outcome significantly. He flies out about one and a half standard deviations above league average and grounds out at about the same rate on the opposite end of the spectrum. With the information provided, only 5 XBHs in 86 PA and the chance of a HR being below 6%, the idea of trying to induce a fly ball is attractive, depending on the situation. Setting up a fastball with an off-speed offering could be an effective way to get this done, due to the FO and PU rate of this pitch.
![]()
For hitters who are fairly average across the board (Player E, for example) sticking to your pitcher’s strengths is likely your best option. Allow him to do what he does best, and as more information become available (approach, previous at-bats), you can then tailor the attack accordingly.
This information can also be valuable from a game-management standpoint. For example, there is runner on third, with one out, and Player H is up to bat. The pitcher on the mound throws his fastball with high spin and has a below average GB rate. A fly ball is the most likely outcome. Let’s also say that Player B is on-deck. He grounds out and flies out at a very similar clip but does not slug a high percentage, which lessens the fear of an extra base hit. You also have a pitcher in the pen who has an above average changeup with an exceptional GB% against same-handed hitters (and as luck would have it, he and Player B are both left-handed). If we are playing the odds, pitching around Player H to try to induce weak contact or a K is smart play. The risk of walking him is minimized, because we can bring in our lefty to face Player B to maximize the chance of rolling up a double play. Now, obviously most situations will not work out this well, but knowing more about the opposing team will lead to higher quality decisions where the odds tilt in our favor.
Clearly this should not be the only approach of how to attack hitters since there are many other factors to consider—pitchers ability, pitch flight data, hitter’s swing metrics, and batted-ball data—but it is a practical way to make more informed decisions on the bump when all of the data isn’t available.
Written by Throwing Trainer Alex Valasek and Sabermetrics Analyst Dan Aucoin
Comment section