Kershaw, Sliders, Statcast: An Analysis of the Slickball Theory
Among talks of collusion, an ineffective player union and a growing discrepancy between contenders and non-contenders, this is as opportune time as any to relive the brow-beaten subject of the slickball theory. In case you missed the 2017 World Series, this has been touched upon here and here and a number of other places Google could tell you about.
However, if you have read one or two or all three hundred of those articles, you may share my feelings of being a little unfulfilled or still unsure of where and what exactly did change with slider-dependent pitchers and pitches. There certainly does seem to be quite a lot of smoke, but is it one main large fire or a series of metaphor-inducing sources of flames?
Here I aim, rather than to just re-open the conversation, to redirect it from a few new angles, both in terms of mechanical changes and binned results. As such, I will briefly glance over the league wide trends and then look in more detail at the tendencies and results of a well-known slider-heavy pitcher who had multiple World Series starts and goes by the name of Clayton Kershaw.
Here are some specifics we’ll cover below, so this is a last chance for a few of you number-averse readers to bail:
- The spin rate/direction by seasonal split, with an especial focus on the sliders
- Binned locational differences of pitches, based on pitch type and seasonal split
- Horizontal and vertical location differences, further subset for left handed and right handed hitters
- Discretized outcome differences across pitch type and seasonal splits
- Discretized exit velocity differences on batted balls across pitch type and seasonal splits
- Usage differences of pitch types across the time periods
- Usage differences of pitch types when late in game (5th inning and on)
- Pitch selection usage when men are on base, with a bar graph based on the furthest runner being on 1st, 2nd, and 3rd
Let’s commence with our race to one conclusion that’s worth a thousand graphics. (That’s the idiom, right?)
Analyzing Spin Rate and Direction
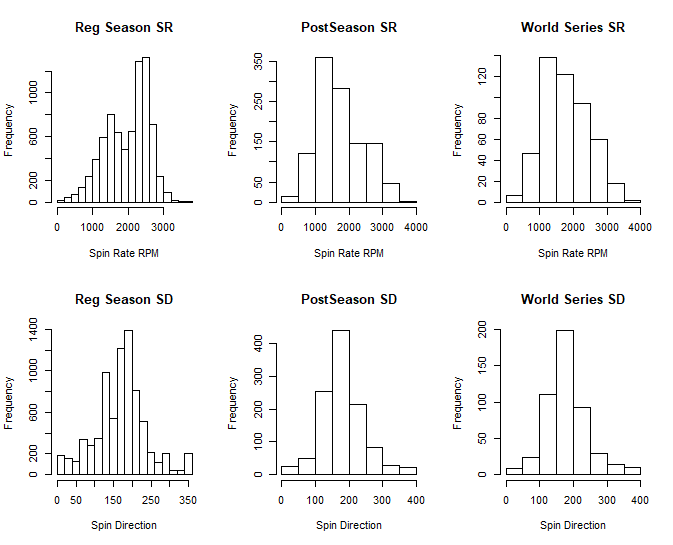
Looking at the Statcast data scraped off Gameday directories, we’re pooling the spin rate and spin direction for all pitches thrown in 2017, split up by the regular season, post season (inclusive), and world series (exclusive). For the sake of cogency, we’re going to be using and re-using a lot of abbreviations: I apologize in advance for any confusion about using SD to indicate spin direction when it might pop out as the more naturally at ease abbreviation for standard deviation.
We probably don’t need to spend too much time convincing anyone that the distribution seems markedly different in the postseason and world series vs the regular season.
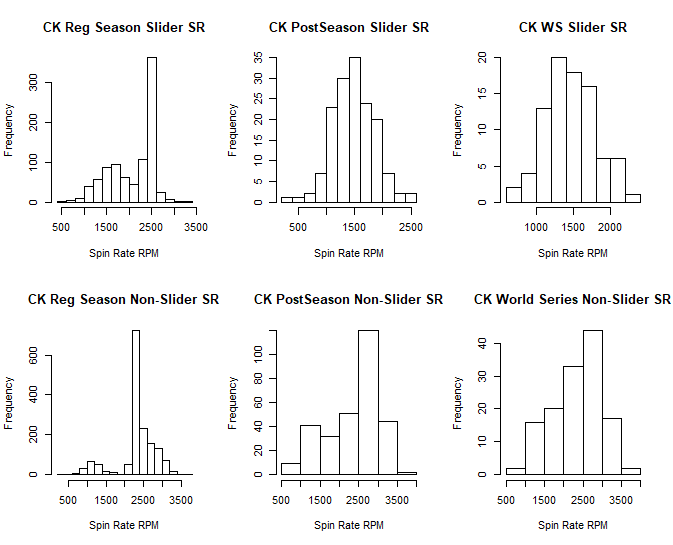
Now, a slider would often be the pitch most affected by potential “slickness”. So, repeating the seasonal splits, we stayed with the spin rate (a more statistically stable rate to look at rather than spin direction) and split up the graphs between sliders and non-sliders.
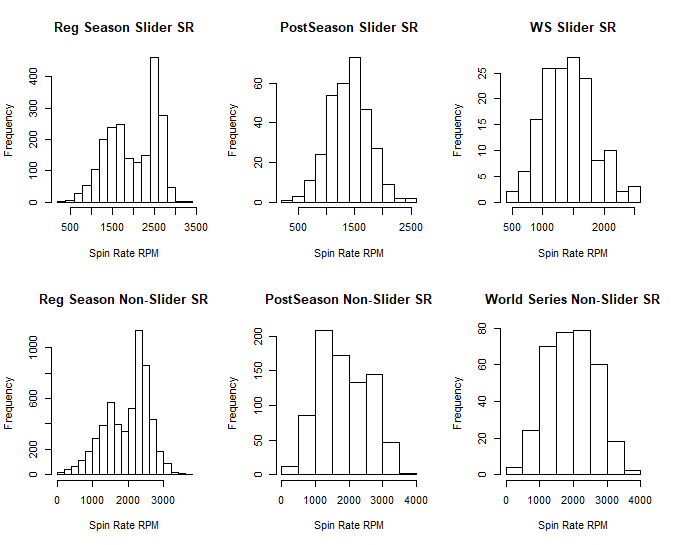
Again jarring contrasts, and jarring contrasts in the slider categories where there seems to be a very significant shift in the mean: these R plots even auto-generate different shifting scales for the RPM.
Here’s a numerical sampling of the results.
| Metric | Mean | SD |
| Spin Rate RS | 1989.218 | 604.563 |
| Spin Rate PS | 1725.752 | 679.718 |
| Spin Rate WS | 1778.519 | 668.531 |
| Spin Rate RS (SL) | 1988.945 | 574.264 |
| Spin Rate PS (SL) | 1401.731 | 357.303 |
| Spin Rate WS (SL) | 1417.806 | 409.897 |
| Spin Rate RS (non-SL) | 1989.319 | 615.397 |
| Spin Rate PS (non-SL) | 1851.737 | 731.829 |
| Spin Rate WS (non-SL) | 1941.109 | 698.709 |
A very casual overview: the spreads seem to get tighter with the Slider pitches specifically in the postseason; a Fisherian perspective on these numbers seems to paint a very staunchly significant difference. If you’re not a disciple of frequentist statistics, then a complementary Bayesian perspective would also be damning – dependent, of course, on your sensible choice of prior distributions.
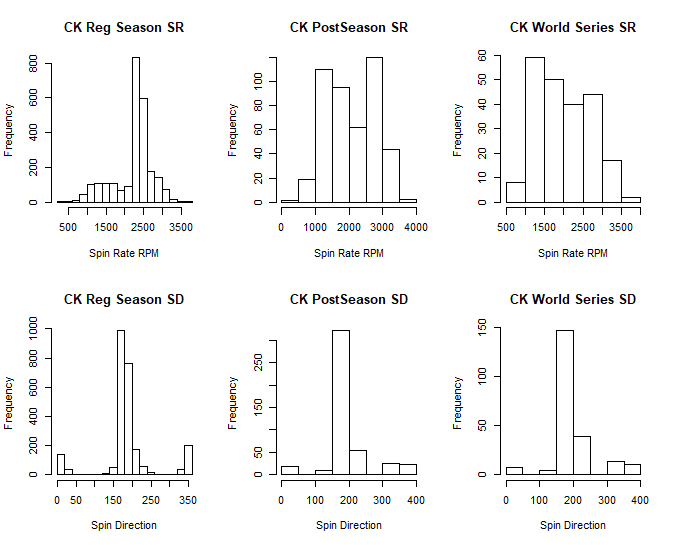
Now, a quick look at all the visualizations we’ve seen, but this time for our slider-loving friend, Kershaw.
[tabby title=”Spin Direction / Spin Rate”]
[tabby title=”Slider Spin Rate vs. Non-Slider Spin Rate”]
[tabbyending]
Let’s take this moment to introduce a new quirk in the mix.
Potential Statcast / Trackman Errors
As has been heavily discussed by sabermetricians and keen observers of baseball statistics everywhere, MLB has introduced the Statcast TrackMan radar over the previous Pitchf/x cameras as the leading provider of measurements in the last few years, and 2017 specifically marked the year Statcast became the official leading face of metrics: MLBAM officially switched to TrackMan. While Pitchf/x’s cameras begin tracking pitches about five feet away and rely on a set of 20 images, TrackMan is in a perpetual journey of thousands of snapshots of the pitch, bringing, in theory, greater precision and ability to the table.
Due to Statcast’s fairly new status and limited public access, there have been known errors among initial Statcast tracking, most notably errors in vertical and horizontal pitch movement although the errors were acknowledged as an improving work-in-progress due to Statcast’s learning potential and the continued commitment of the Statcast developers. In fact, a (very) recent study by Gerald Schifman commits just this fact to light: errors for Trakman readings have certainly decreased on metrics like horizontal/vertical location and movement, although they are not quite unilaterally better across the board than the older Pitchf/x data.
In addition, a huge difference is especially notable when it comes to Pitchf/x vs Statcast in the premise of this article: The already-much-bandied-about Pitchf/x spin rate.
The TrackMan system has the ability to measure the “observed” [0] spin rate, which can be seen as a summation of the pitch’s “useful” spin (where the spin axis is perpendicular to the direction of the pitch) and its gyro spin (or where the spin axis is aligned with the direction), where Pitchf/x only notes down the former number, which it calculates based on the trajectory of the pitch. This will result in Statcast’s spin rate potentially being a much different number.
Differences in Statcast Data?
However, the spin rates we presented above from the MLB Gameday’s raw TrackMan data are different not just from Pitchf/x data but also from one of the leading faces of Statcast data, Baseball Savant.
Baseball Savant, the most prominent result following a search for “statcast data”, is self-marketed as “a site dedicated to…Statcast metrics.” Yet, after using their Search function to output Kershaw’s 2017 data, we find a few stark differences. In fact, here are the same seasonal splits of the breakdowns for spin rate by Savant for Kershaw.
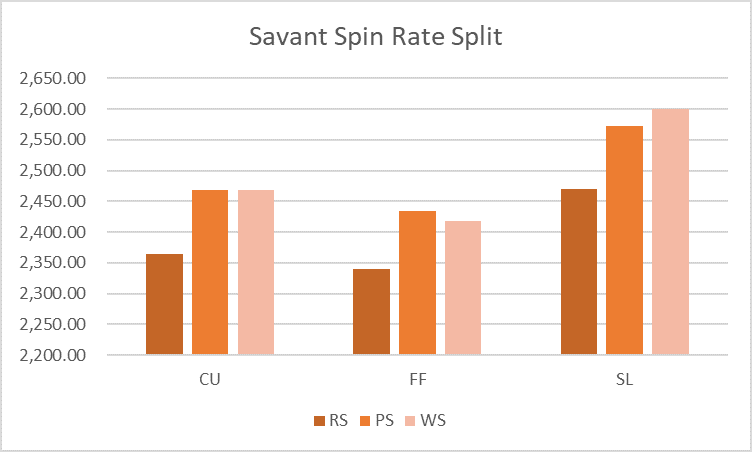
Does this invalidate the TrackMan conclusions we’d previously drawn? Not necessarily; looking at the raw, unaltered data places everything on the same scale after all. But this raises a bigger question: why are two different interfaces, both based on Statcast’s TrackMan as a data source, spitting out different numbers? And just how different are they across the board?
It’s been covered before how Statcast is undergoing constant changes to better its data output and measurements. It’s, predictably, a little more closeted about what exactly these changes are. Requests from Driveline Baseball’s R&D Director on this subject went unanswered.
(Historical requests for where this data lives have also been ignored by MLBAM’s representatives.)
Reviewing Kershaw’s “Statcast” Data
That being said, given that the greater wealth of data we have comes from the raw MLB Gameday interface, it seems highly pertinent to suppress newly festering qualms about which data source to play with in exploring how the nature of Kershaw’s pitches changed across the season. Especially relevant is seeing where and how the two different tracking systems differ, when it comes to movement and location.
Looking at the roughly 3000 pitches Kershaw threw in the regular season and postseason combined, a simple match performed on the unique date/time-indexed stamp of when the tracking system first detected the pitch in the air, managed to match over half of Kershaw’s unique pitches across both sources. This is no mean accomplishment, as MLB Gameday and Baseball Savant defer even in the exact number of total pitches Kershaw threw over said season (3025 from Gameday versus 2931 from Savant).
(Although looking at easily verifiable examples, it seems Savant does a much better job of tracking these pitches, with its convenient ability to backtrack and correct.)
Given the 1500+ individual pitches that we can match, I decided to take this opportunity as a chance to measure the similarity of the descriptive matching data fields in both Gameday and Savant, something that I have had trouble finding verifiable results for online.
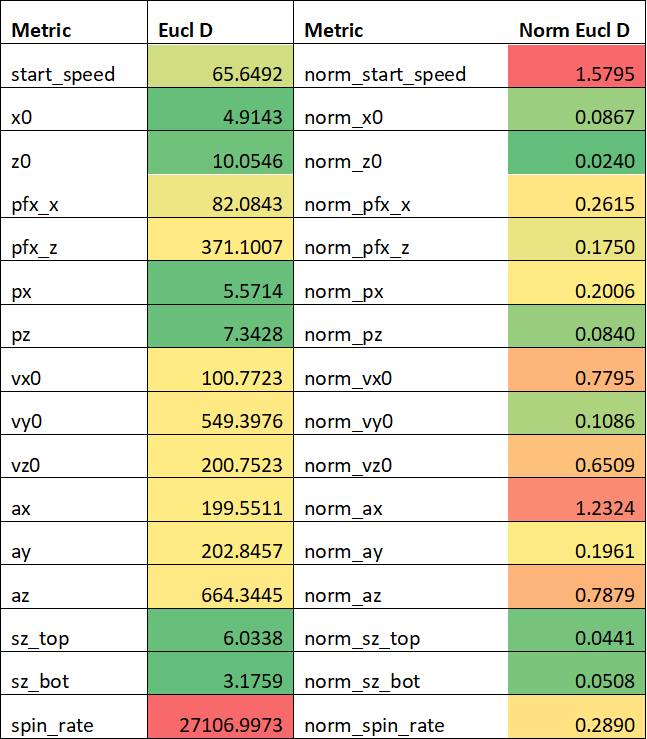
We looked at the following metrics that are present in both tracking systems and help describe individual pitches: start speed, x0 and z0 (the horizontal and vertical location of the pitch at the initial release point, respectively), pfx_x and pfx_z (the horizontal and vertical movement of the pitch between the release point and home plate), px and pz (the horizontal and vertical location of the pitch when it crosses home plate), vx0 and vy0 and vz0 (the velocity of the pitch in three dimensions at the release points, ax0, ay0 and az0 (the acceleration), sz_top and sz_bottom (the top and bottom of the strike zone), and the spin rate.
We also looked at two differences of similarity measure: the commonly used Euclidean distance and normalized Euclidean distance, the latter to account for the different magnitude of certain metrics (i.e. speed vs a pitch movement metric).
Here are the results.
As expected, spin rate is colossally different. Most of the other metrics don’t seem too incredibly different (keeping in mind that we have an 1500+ sample size that boosts up the non-normalized metric). The velocity and acceleration metrics we don’t touch upon in this piece, and the horizontal and vertical movement we’ll also stay away from as those seem to speak to some potential measuring differences.
In addition, among these 1500+ pitches, 78 pitches were classified differently between Gameday Statcast and Savant Statcast. Further breaking it down below, we see that 59 of these pitches were classified as Sliders in Gameday (column labels) while falling into either four seam fastballs (48) or change ups (10) for Savant (row labels).
| Pitch Type | CU | FF | SL | Grand Total |
| CH | 10 | 10 | ||
| CU | 3 | 3 | ||
| FF | 6 | 48 | 54 | |
| FT | 5 | 1 | 6 | |
| SL | 3 | 2 | 5 | |
| Grand Total | 9 | 10 | 59 | 78 |
Is there anything unique about these pitches that the two systems seem to be disagreeing on? Looking at the 58 pitches we mentioned before (all sliders in Gameday and FF’s or CH’s in Savant), we surveyed the descriptive statistics of a few aforementioned metrics.
It appears that, at least in these cases Gameday is deploying a more sensible pitch type selection based on location and movement. We will pursue Gameday’s metrics for those pertinent analyses, although again the differences across the whole sample size are not large.
Slider Location Analysis
First then, we look at where the pitches actually ended up. The level of hitting in the postseason is better by any sort of common sense or statistical rationale, but was it a result of the hitters hitting the same pitch in the same spot? Or did the pitches, specifically the slider, look different?
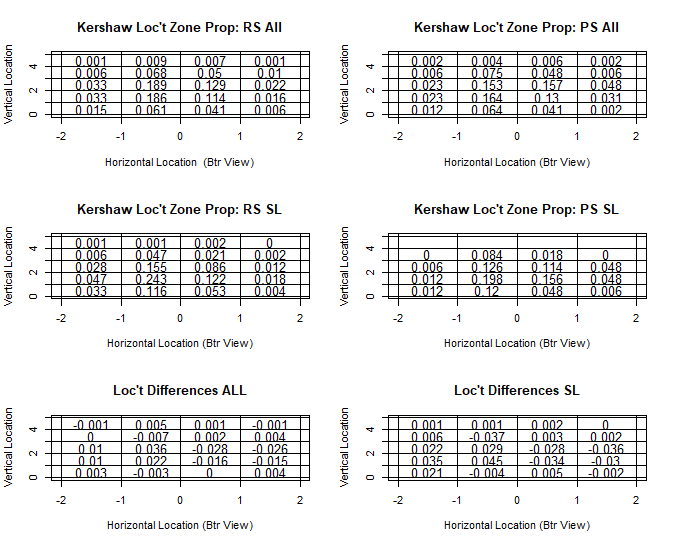
The above tables are segmented by the Gameday value of px and py, which indicate the horizontal and vertical location of the pitches respectively. We tossed out any obviously wild pitches or pitches well outside the strike zone: we filtered out pitches more than 2 feet inside/outside from the center of the plate, below 0 feet (i.e. bouncing), or above 5 feet. The first set of plots compare the locational difference for all pitches between the regular season and postseason; then sliders specifically, then a set of the differences (regular season minus postseason) for both all pitches, and sliders.
It appears at a glance that pitches might have shifted over from between 0 and 2 to 0 and -2 px, or from outside to inside. Let’s hold on a moment though and break it down for the type of batter Kershaw is facing.
More particularly, looking at Kershaw’s splits against LHB vs RHB we see a few stunning differences in px indices, particularly against RHB where he appears to start throwing to the other side of the plate. Here are the means for these px indices for all pitches, and then controlled for sliders specifically:
| Px_Split (Mean) | RS | PS | WS |
| LHB (All) | -1.479 | -1.927 | -0.946 |
| RHB (All) | -1.464 | 1.165 | 0.412 |
| LHB (SL) | -1.872 | -0.414 | -0.768 |
| RHB (SL) | -1.497 | 0.677 | 0.761 |
So it appears that pitches, and sliders in particular, are ending up in different locations, yes. Now let’s see if this has any impact on the actual result of the pitch.
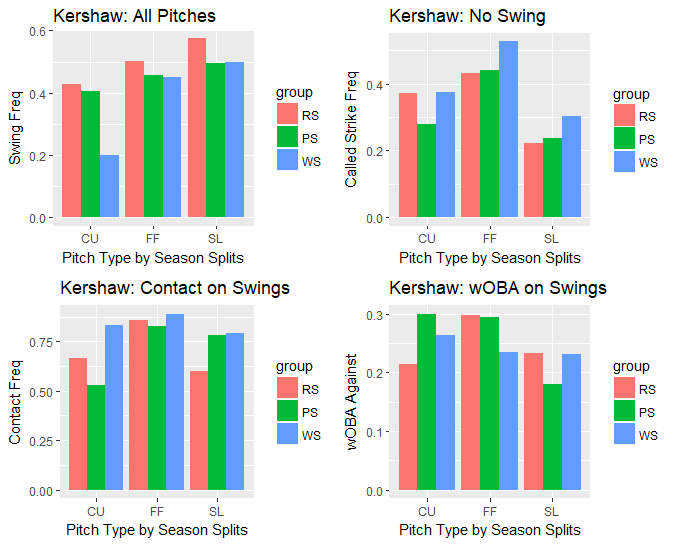
Swinging at Kershaw’s Stuff
We looked at changes in pitch event outcomes based on pitch type across our by-now-familiar three-way seasonal split. We looked at differences through four different lens: the frequency of batter swings across all events, the frequency of recorded strikes across all no-swing events, the frequency of contact among all swing events, and the wOBA generated by the opposing batter across all swing events. The number of changeups and two seam fastballs that Kershaw threw was quite small (as you’ll see depicted lower down in another graphic) so we focused on his three main offering of curveballs, four-seam fastballs and sliders.
Keeping in mind that the World Series sample size is smaller than the Postseason and much smaller than the regular season, a few observations:
It looks like Kershaw had the biggest discrepancy in batter performance with his curveball and slider.
For both sliders and curveballs, he got fewer batters to swing at his offerings in the postseason and these batters generated a much higher frequency of contact when they did swing (for the exclusive postseason splits on curveballs, CU actually generated less contact). While Kershaw was more efficient at getting called strikes for his regular season curveball, he actually was more successful getting called strikes in the postseason with his slider. However the typical slider, and especially Kershaw’s, isn’t intended as a pitch to freeze hitters—hence the low rates of called strikes across all splits. In fact, the increasing ratio of called strikes might speak even more to the changing location of the slider.
Interestingly, the wOBA on slider-generated swings decreased in the postseason, while it increased for his curveballs and four-seamers. However, when accounting for all swings, Kershaw still recorded a lower wOBA in the regular season.
His fastball seemed to induce a similar amount of swings across the season splits (slightly more in the regular season) and a similar amount of contact, with the lowest wOBA against in the postseason.
Now, bringing in some Statcast batted ball data from Savant, we can look at just how hard his main three offerings were hit after the calendar flipped to October.
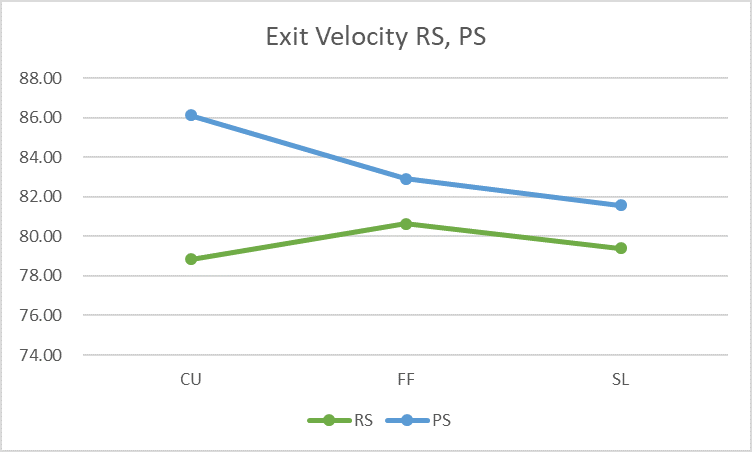
So, a few mixed signals in there but it does seem like there are differences, with perhaps the most dichotomous split existing with fewer induced swings on sliders and much more contact and harder contact when the slider is swung at, in the postseason. (It’s also important to note that a true rigorous analysis of the wOBA figure would require hitting park factor adjustments, correction for the superior level of hitting faced in the postseason, etc.)
Now if we do believe the nature of Kershaw’s pitches (specifically his slider) is changing, let’s look to see if Kershaw himself changed his pitch type based on certain situations, perhaps out of a conscious (or subconscious!) desire to adjust for these differences.
In the next plots we see first a comparison changes in pitch usage across the regular season vs postseason (for both of our Statcast-based data sources), and then, consequent changes in said pitch usage based on in-game situational circumstances.
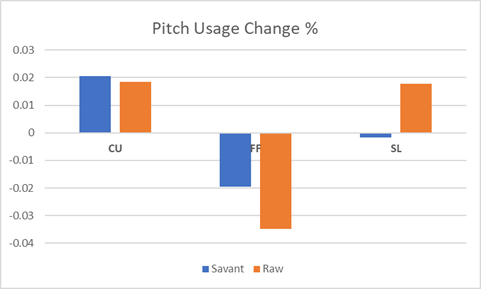
The pitch usage change here comes as a percentage of times it was used in the regular season minus the percentage of times it was used in the postseason. The two systems seem stumped when it comes to how often exactly slider usage changed for, although as we covered above, perhaps Savant’s slider classification isn’t always the most accurate and we should trust the raw TrackMan data’s proposition that slider usage declined in the postseason. Everyone, however, seems to agree that curve usage has gone down, with Kershaw relying more and more on his fourseamer.
Now, diving a little deeper, we look to see if these changes have led to Kershaw being more or less likely to use certain pitches in different dynamics. We looked at these pitches under two different lens: a) early versus late in the game (where we encoded “late” as the 6th inning and later on) and b) the bases being empty versus the lead runner being on first, second, or third base. The pitch type classification used here was, as previously unless otherwise noted, pulled from MLB’s Gameday.
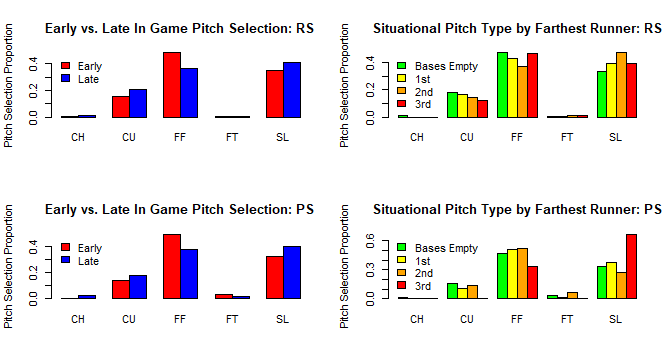
The early/late split seems to have been non-impactful in pitch usage but the second split speaks to a more unfortunate combination: Kershaw seems to have used more (or less! If you believe Savant) sliders in the postseason, but definitely had to resort to them more than ever with men on third base, just as his slider’s spin rate (maybe) and effectiveness (definitely) plummeted.
Hmmm.
A lot has been said about the slickball theory and a lot has been said about the changes ushered in by Statcast, but that is because there is a lot to say about both. Here’s to hoping we’ve confused the few that had a resolute, firm grasp of what was going on. Cheers, l’m excited for the new season as well.
[0]: Trackman can directly observe spin rate, but not spin direction; it must infer it based on movement and spin magnitude.
Comment section