Statistical Parametric Mapping: Tall Versus Short Throwers
A few months ago, we introduced the idea of Statistical Parametric Mapping for our full signal biomechanical data export.
Now, outside of a few tweets here and there, intended to both inform and establish a claim on the extremely niche frontier of applied full signal SPM in the world of sports science, we have been relatively quiet about further SPM findings.
However, we have continued to run many SPM analyses internally, across several factors and controls, to broaden our understanding of the biomechanics behind pitching mechanics.
Many of these comparisons have been inspired by trainer curiosity and intuition—the case with almost all our best internal studies and analyses. They primarily deal with paired comparisons of assessment versus retest biomechanical data (retest data typically being taken around six weeks after the initial assessment).
We’ve also split our population sample not just by velocity, but also by other anatomical measures like height. All data was captured in our gold-standard motion capture lab. The sample sizes of these SPM t-tests vary by control (all were rerun at the end of the v4 pipeline lifeline)—noted in each of the appropriate sections.
SPM Refresher
Now, let’s do a quick debrief of SPM, covered in our first blog and other sources here and here. To jog your memory:
SPMs are used for treating continuous functions of time and/or space, like biomechanical full signals. Essentially, statistical tests are performed on every signal point, and a full SPM is constructed out of these continuous statistical processes. Then p-values are generated via the Random Field Theory (which helps address the multiple comparisons problem by estimating the smoothness of the statistical map, which is then used to give the expected “Euler characteristic” at different thresholds), and peaks and clusters in the data are assessed as statistically significant or not. Since not everyone’s full signal data is captured in exact increments from point A to point B, typically we perform analyses around certain timing indicators (noted below in more detail cerca ‘FP’ or ‘Foot Plant’ and ‘BR’ or ‘Ball Release’) and the frames around them, to allow more robust comparisons.
Our first SPM blog addresses more specific applied connections between certain biomechanical values and their corresponding influence during a pitcher’s motion.
A few shorthand definitions and notes are here:
- FP: A time marker indicating when the pitcher has reached foot plant of his/her lead leg
- BR: A time marker indicating when the pitcher has released the ball during the pitching motion
- Hard v Soft Throwers: Denotes those who have thrown at or above an average of 88 mph and at or below 78 mph, respectively, in their motion capture sessions
- Tall v Short Throwers: Denotes those who stand at or above 76 inches (~our population mean + 1 Standard Deviation) and at or below 72 inches (~population mean – 1 SD), respectively
Tall Versus Short Throwers
In this piece specifically, we looked at tall and short throwers and broke them down over three different controls:
- Comparing Tall v Short Throwers amongst a similar velo population (Hard Throwers, or 88+ mph throwers)
- Comparing Hard v Soft Throwers amongst only the Tall Throwers
- Comparing Hard v Soft Throwers amongst only the Short Throwers
- For reference, tall throwers were defined as subjects who were 76 inches or taller, and shorter throwers were 72 inches or shorter. Hard throwers threw 88 mph or harder, while soft throwers threw 78 mph or slower
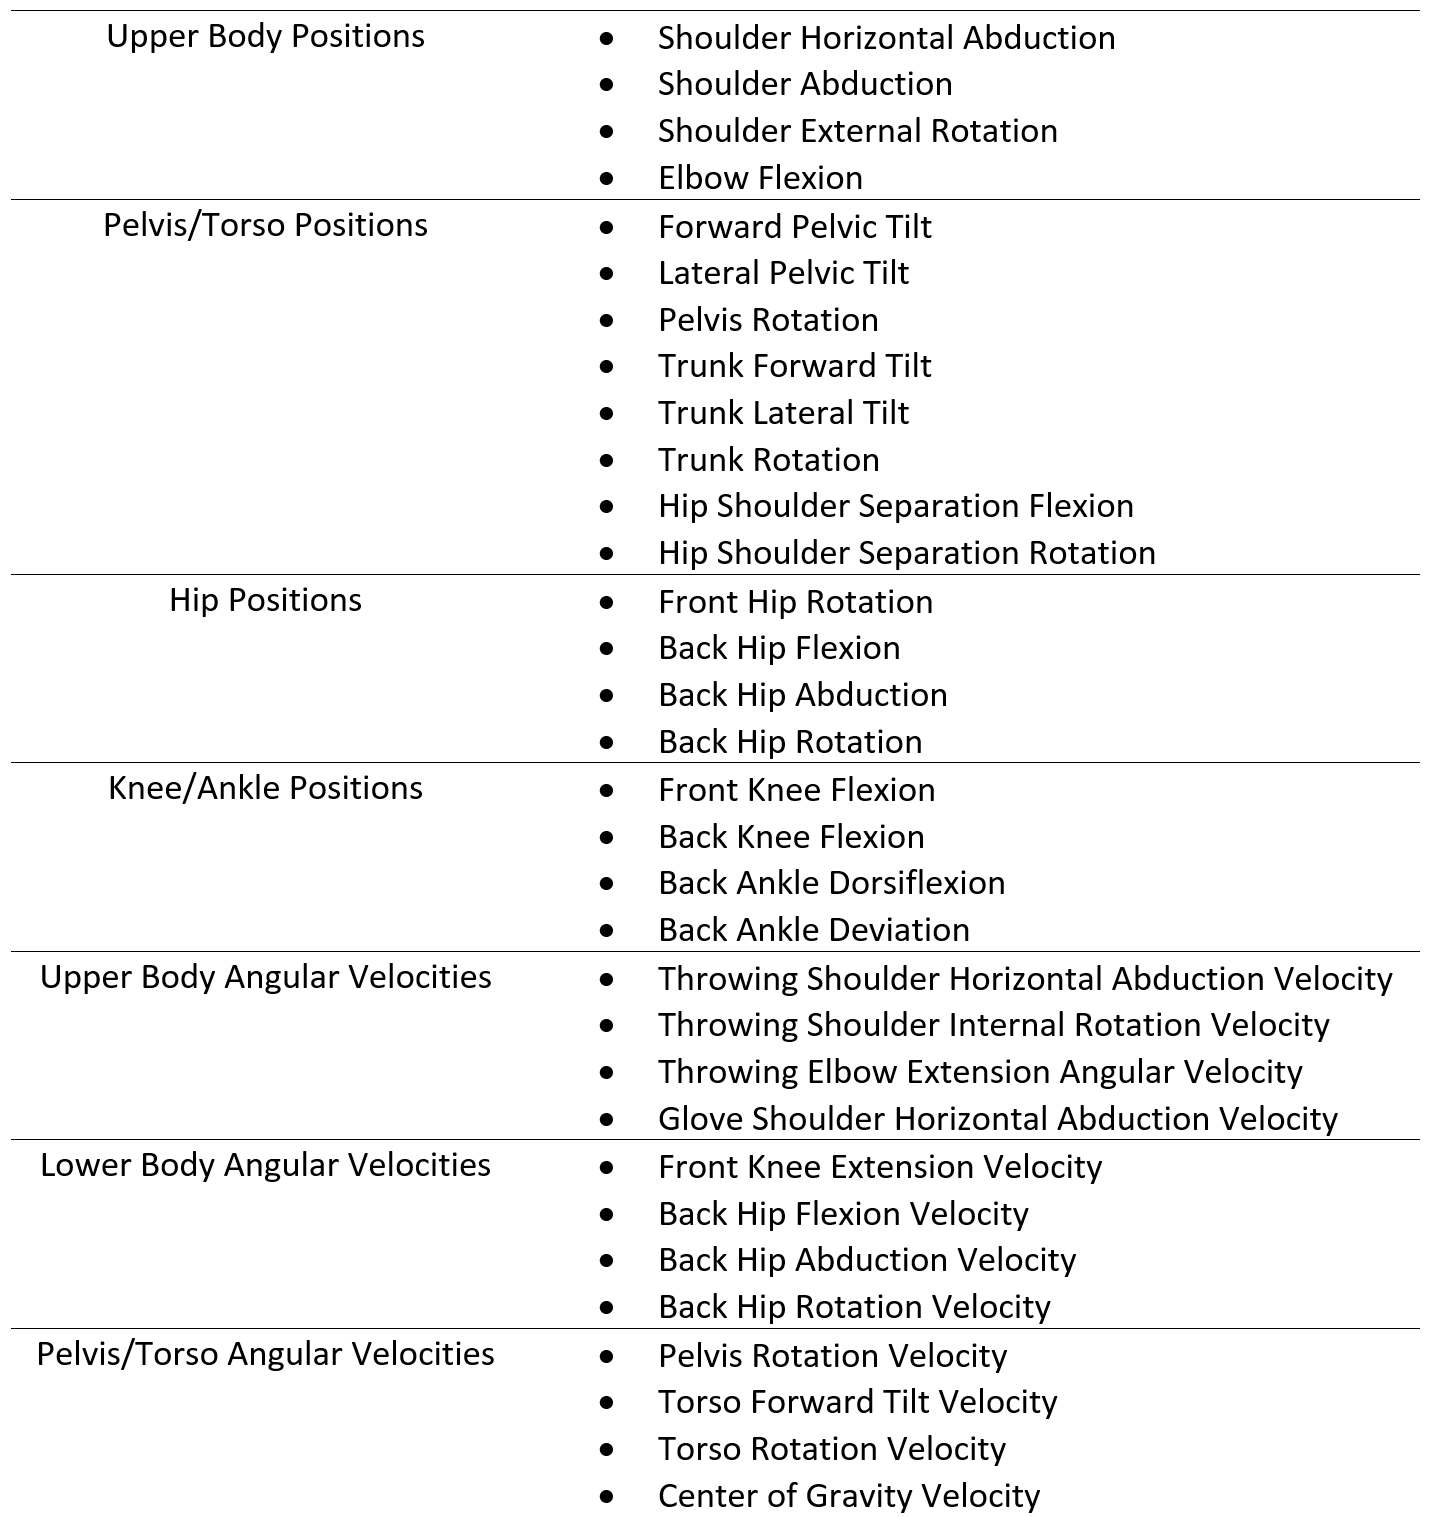
For these comparisons, we also looked at a few clumped groups of biomechanical metrics, having identified these as metrics of interest in two sample T-test SPM analyses. As most of these clumped groups included anywhere from 3 to 8 different metrics, we applied an informal multiple comparisons adjustment and lowered the alpha level to 0.01.
The groups of biomechanical metrics we compared are:
Comparing ‘Tall’ v ‘Short’ among Hard Throwers
Among the hard throwers, we have 17 tall throwers and 23 short throwers. The short throwers were 70.8 ± 1.4 inches tall while the tall throwers stood 76.6 ± 0.7 inches.
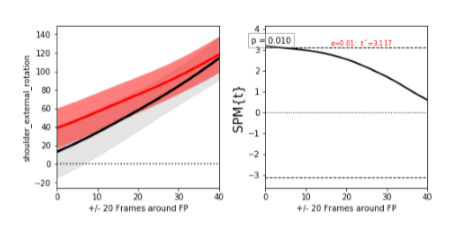
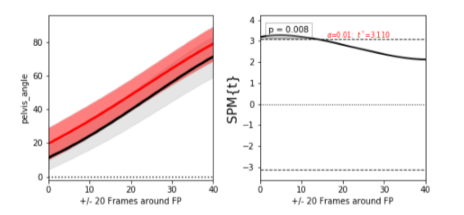
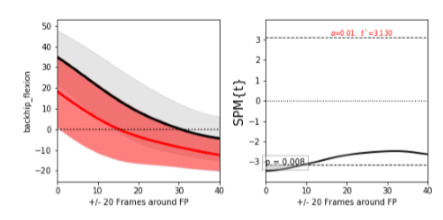
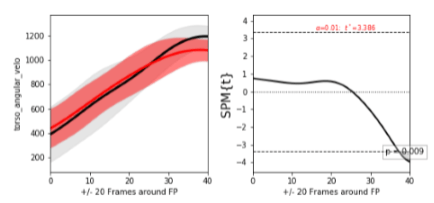
After running SPM analyses across our metrics of interests, these results were statistically significant (tall group=red line, short group=black line):
Tall Throwers had significantly greater shoulder external rotation around 15 to 20 frames before FP.
Tall Throwers had a significantly greater pelvis angle around 10 to 20 frames before FP.
Short Throwers had a significantly greater back hip flexion around 10 to 20 frames before FP.
Short Throwers had a significantly greater torso rotation angular velocity around 15 to 20 frames after FP.
Tall Throwers had a significantly greater COG velo around 15-20 frames before and after FP.
‘Hard’ vs. ‘Soft’ among Tall Throwers (Pitch Velocity)
Among the tall throwers, we have 17 hard throwers and 6 soft throwers. The soft throwers sat 73.4 ± 4.2 mph, while the hard throwers were 90.5 ± 1.6 mph.
We found no statistically significant results here (likely in part because of the smaller samples on both ends of the cutoffs).
‘Hard’ vs. ‘Soft’ among Short Throwers (Pitch Velocity)
Among the short throwers, we have 25 hard throwers and 52 soft throwers. The soft throwers sat 69.3 ± 12.8 mph, while the hard throwers were 90.7 ± 1.8 mph.
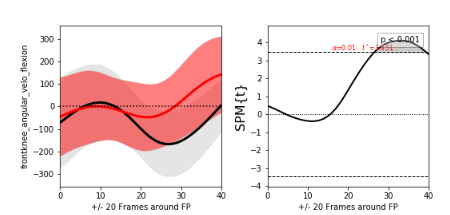
These are the statistically significant comparisons centered around Foot Plant we found across this split (hard throwers=red line, soft throwers=black line):

Harder Throwers had a significantly greater front knee flexion angular velo around 0 to 20 frames after FP.
Interpreting these Red and Black Lines
Those familiar with biomechanical signals probably get excited seeing the full signal plots above, but the rest who still have no idea how a few curvy lines have anything to do with the pitching delivery likely need a bit more explanation.
Tall hard-throwing athletes (6’4” and taller, 88+ velocity) in our dataset compared to shorter hard-throwing athletes (6’ and under, 88+ velocity) exhibited:
- More throwing shoulder external rotation leading up to foot plant
- They began rotating their shoulder into layback earlier but did not exhibit more layback (167.3 ± 11.1 and 168.7 ± 9.9 maximum external rotation for tall and short, respectively). This suggests that the difference is due to timing, maybe caused by the longer levers (arm length) requiring longer to move the arm into layback.
- More rotated pelvis (open, towards the plate) around foot plant
- Their pelvis was also at a more open position at ball release, which would explain the more open pelvis around foot plant since they have more rotation to complete by the end of the pitching cycle.
- Less back hip flexion (more extended back hip) around foot plant
- They essentially get into back hip extension later than the shorter hard-throwing athlete.
- Slower torso rotation after foot plant
- Both tall and short groups were rotating their torsos at the same speed for most of the analysis window, but taller athletes reached a slower peak torso rotation, which happened around 15-25 frames after foot plant.
- Higher COG velocity (moving linearly faster toward the plate) around foot plant
- The difference was only significant a bit before foot plant and a bit after, but the taller athletes were moving toward the plate faster on average throughout the whole analysis window.
Now, when splitting along the shorter athletes only group, harder throwers (88+ mph) compared to softer (78- mph) throwers exhibited:
- Faster front knee extension (straightened their lead leg faster) after foot plant
- Harder throwers straightened their front leg faster than the slower throwing groups, which is one of our lead leg block measures. This finding backs up our past research where we have consistently seen that harder throwers have better lead leg blocks.
With higher peak torso rotational velocity, less back hip extension, and slower body movement toward the plate, shorter athletes may need to rotate faster and rely more on their lead leg block to achieve similar performance as their taller counterparts. This likely has to do with some of the more fundamental laws of physics that pertain to lever length and body mass. Taller athletes will often have more mass to move, and consequently, more kinetic energy per unit of rotational velocity. Further, rotational kinetic energy is something that we have seen to be related to performance. They also have longer body segments, allowing them to create the same amount of linear velocity with slower rotational velocities.
There are limitations associated with this analysis:
- This dataset is relatively limited in sample size, despite producing significant statistical results. With around 20 athletes in either of the height groups, we would be hard-pressed to generalize these results to the total population of hard-throwing tall or short pitchers with a high degree of confidence.
- We also only looked at 40 out of 300 frames, so there may be more significant differences that we did not identify outside of the present analysis window.
Limitations aside, tall versus short throwers and any other generalized throwing classifications are an attempt at profiling athletes better to prescribe more effective training and performance advice. It is unlikely any one of them is the end-all assessment insight. That doesn’t mean, however, that we should not try to share only what elite throwers do better than non-elite throwers, but also identify what different subsets of elite or near-elite throwers do uniquely to achieve high pitch velocities. With that, we can start piecing together the pitching puzzle (I swear that alliteration came naturally).
The flexibility of full signal allows us to recognize patterns and differences when comparing biomechanical full signals more comprehensively. We see this as an exciting opportunity to play around with dividing across different group distinctions—in this case, athlete height, as initially requested by past Driveline pitching trainer Daniel Moskos (now Pitching Coach for the New York Yankees Single-A affiliate team).
We hope you strap in and join us for the next SPM blog, this time with likely more data in our new pipeline, and about 2% more knowledge of SPM in our back pockets.
For similar investigations and discussion, tune in to the Driveline R&D podcast weekly, where we talk about research and development projects small and large.
By Alex Caravan (@Alex_Caravan) and Kyle Lindley (@kylelindley_)
Comment section
Add a Comment
You must be logged in to post a comment.

Dave -
Love the research you guys publish. Where can I find basic diagrams demonstrating the biomechanical metrics from the first table? For someone not well-versed, it would be great to have a resource that shows exactly what all the various abductions/adductions, flexions and internal and external rotations refer to. Something like an expansion of the 3 diagrams from https://www.drivelinebaseball.com/2020/07/caught-looking-articles-of-the-week-july-30/ would be really helpful. Thanks
David Besky -
Dave – thanks for the kind words and question. Unfortunately we do not have a comprehensive easy to reference guide that details all those metrics, though if you Google “anatomical terms of motion” there are a number of resources (videos and articles) that detail what the various movements look like for different joints to help make sense of the terms.