In Search of A Smarter Pitch Count

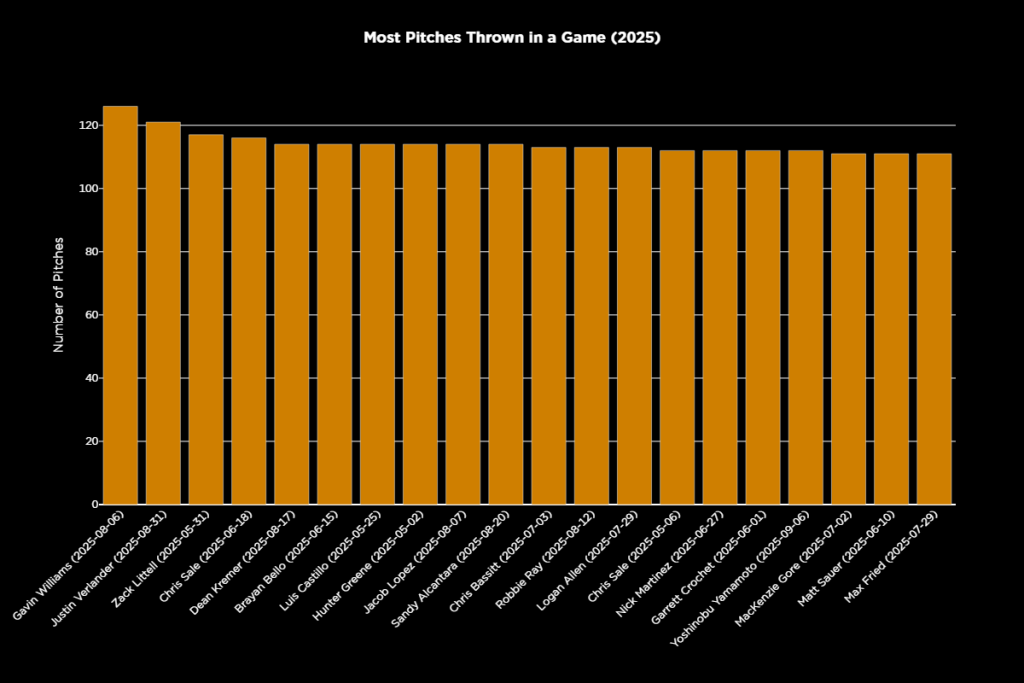
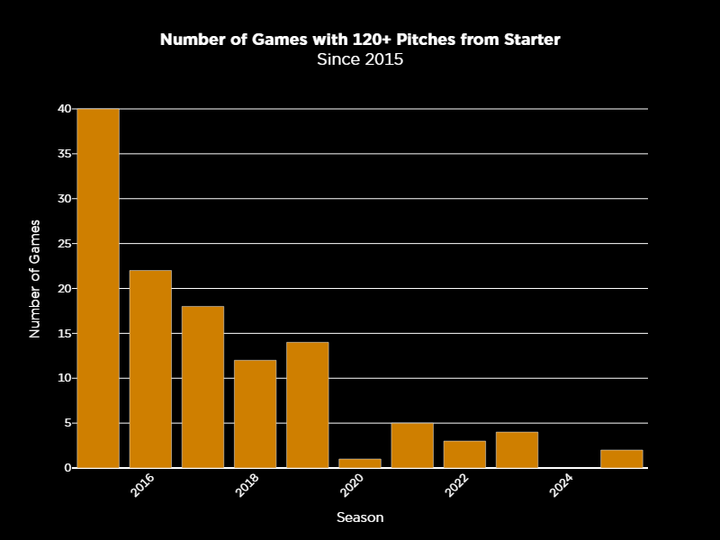
There have been only two instances of a major league pitcher reaching 120 pitches in a game since the start of last season.
Forty-two-year-old Justin Verlander authored one such outing. He reached the mark on Aug. 31 of this season, striking out 10 over five scoreless innings versus the Orioles. The effort required 121 pitches.
The other outing was Gavin Williams’ Aug. 6 start versus the Mets at Citi Field. He threw 126 pitches over 8 2/3 innings.
That’s it. That’s the list.
Guardians manager Stephen Vogt allowed Williams to pitch into the ninth inning on Aug. 6 in New York, as he had yet to allow a hit. It’s become so rare for a pitcher to work so deeply into a game, especially a younger arm like Williams, that it can take a pursuit of history – of a no-hitter –to throw modern conventional pitch-count practices to the wind. (And even then, we have seen many occasions where pitchers are pulled without giving up a hit).
With one out in the ninth, Williams allowed a solo home run to Juan Soto. Williams did not finish the game.
Prior to August, the last arm to reach 120 pitches was Seth Lugo on Sept. 26 of 2023.

Ten years ago, there were 40 such outings. In 2005, there were 135, and in 1988, the first year of pitch-level data recorded at Baseball-Reference.com, there were 598 starts of 120-plus pitches. That was 14% of all starts.
We know that teams have become reluctant to push pitchers. The fear of injury looms over every club. There is also no doubting that the third-time-through-the-order penalty is a mathematical reality governing many teams’ decisions. (Now, whether it should be used as a blanket approach with every starter, and every start, is another question.)
Pitchers are also throwing fewer innings in the minor leagues. Propsects are not as accustomed or prepared to work deeper in games. There are more max-effort hurlers, too. It all conspires against substantial workloads.

But regarding pitch counts, and workloads in general, it feels like much of baseball is guessing.
A 100-pitch limit seems like a round number pulled out of the air designed to provide decision makers with cover.
Pitch counts are imperfect. They are not adjusted for the stress of an outing, the weather conditions of the day, the pitcher’s stuff during a given start, or the workload between and before appearances. But too often pitch counts are the only quantifiable number the pro game is using to measure workload.
Too often the pro game doesn’t know what pitchers can and should handle in terms of throws.
This is where Driveline’s wearable PULSE technology can provide so much valuable insight.
The wearable tech informs whether a pitcher is throwing too much, too little, throwing too hard or not throwing hard enough. It directly measures force on the arm.
PULSE metrics like chronic workload, acute-chronic workload ratio (ACWR) and Fatigue Units “create a better representation of the fatigue that a pitcher accrues compared to inning or pitch counts.”

There are already real-world success stories.
While working with the Reds a few years back, Driveline founder Kyle Boddy and Bryan Conger learned from PULSE data that Reds’ pitchers were gassed from their pregame routines. It was having a negative impact on their performance. They adjusted pre-game throwing regimens to include more rest.
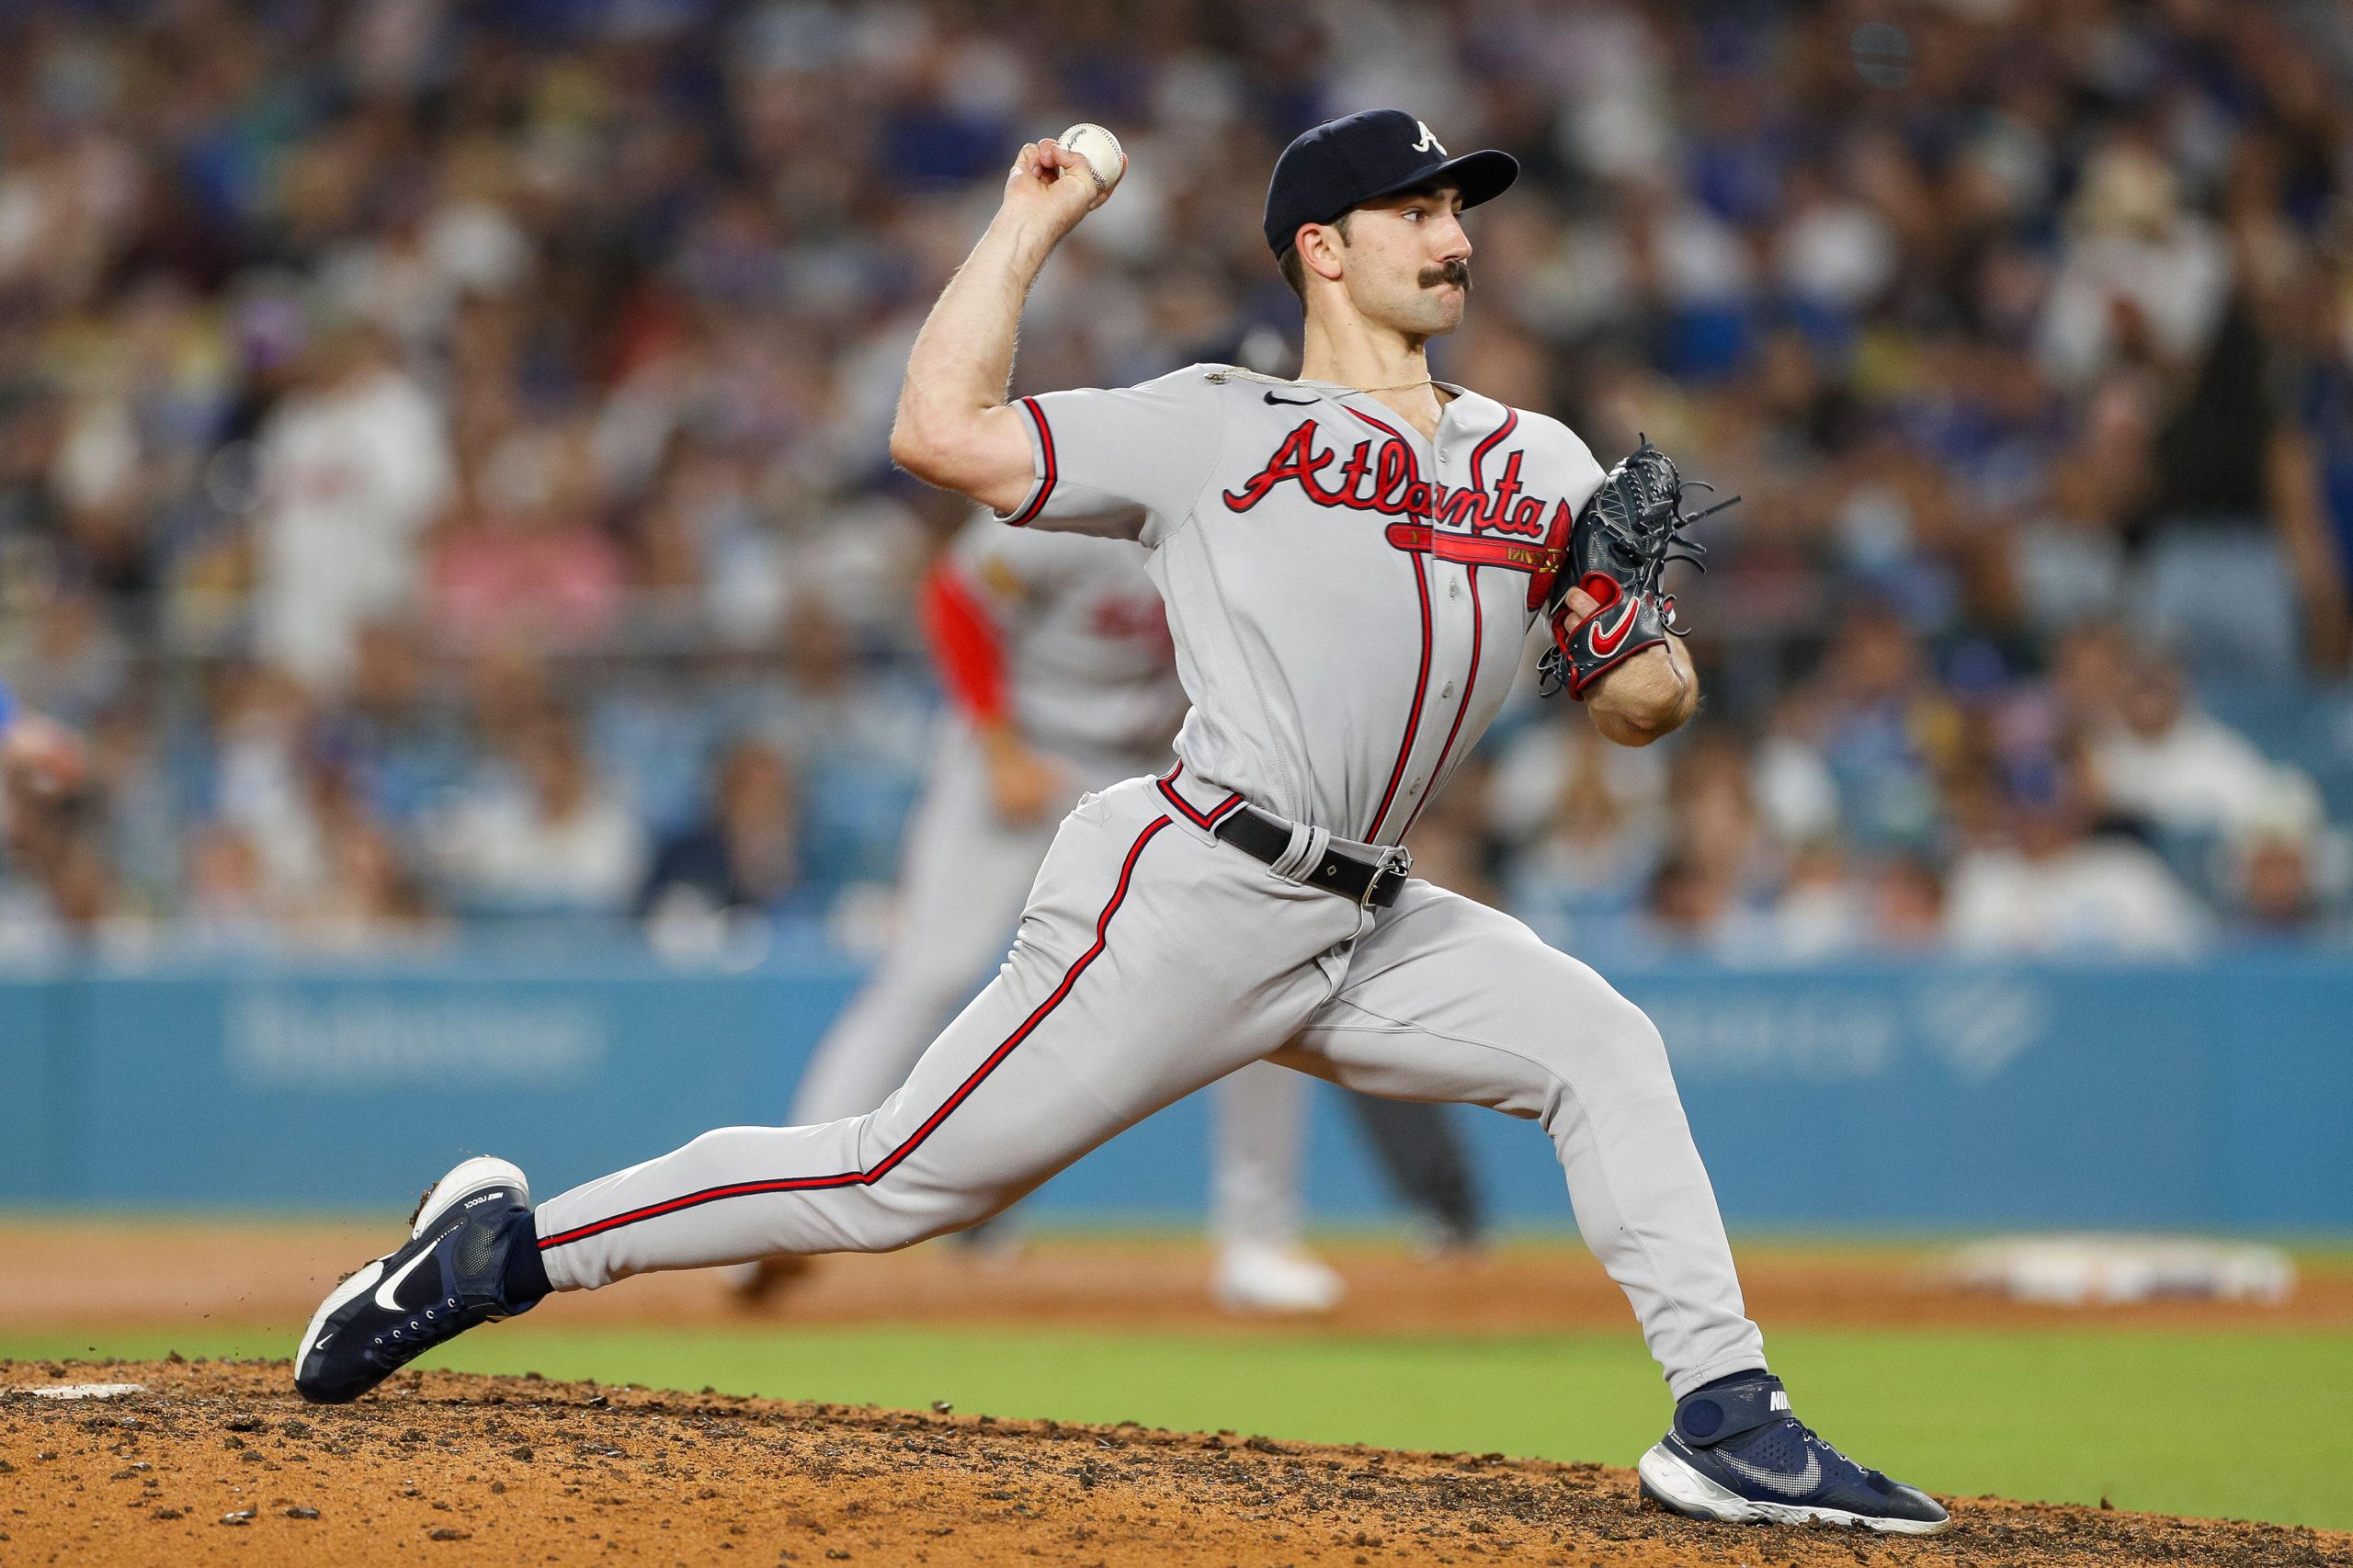
Braves starting pitcher Spencer Strider told me in the spring he is using PULSE to record every throw he makes between outings.
Strider – in his first year back from a second elbow surgery – believes more data is needed to better prevent injury and optimize performance.
“We should be putting that on everybody,” Strider said. “Let’s figure out how many throws you are making. How much stress are you putting on your arm between starts? Let’s start to find everybody’s optimal workload base.”
But for too many pitchers, we just don’t know. Many are guessing.
It doesn’t have to be this way.
The defeatist nature surrounding the discussion of pitchers and injury rates and workloads irks Strider.
For the Braves’ star, the industry is not even close to understanding the issue because it lacks the information, the data, to leverage for answers.
“Another aspect of the injury conversation that the industry is not thinking about is when guys are moving well, when we have someone who has demonstrated elite health and the ability to recover, we need to understand as best we can what their workload is like, what their movement pattern is like,” Strider said.
Josh Hejka is a Driveline researcher and professional pitcher. He said in-game pitch counts and innings are the only quantifiable data some organizations are collecting at all.
With the Phillies and Mets during the last two seasons, Hejka wore PULSE and collected as much data as he could. He wanted to understand more about his workload and how to best train to handle the demands of being a relief pitcher.
He wishes more pitchers – ideally, every pitcher – wore the device.
“It’s a little frustrating because when a pitcher gets hurt there’s a lot of speculation regarding the cause of the injury. Is it mechanics or X or Y or Z? But for most guys we don’t even know what their throwing workload looked like over the last two or three months,” Hejka said. “We only know their in-game throwing. We don’t know what they were doing when they weren’t on the mound.
“How do we accurately make a judgment as to the root cause of their injuries? And how do we prevent the injuries of others if we don’t even have a baseline level of information about what they’re doing?”
Beyond elevated injury rates, since 2005, starting pitchers have combined for a 102.6 ERA-, compared to a 102.5 ERA- mark from 1988-2004. This year? A 101 ERA-. Relative performance remains unchanged even in the age of pitch limits.
And fewer innings from starters means teams are getting to the soft underbelly of their staffs – middle relievers – more often.
Just as data from the radar guns and spin-tracking tech fueled the velocity and pitch design boom, the industry needs a data avalanche on the workload side to better understand how to optimize performance and keep players healthy.
The pro game is more sensitive to workload and pitch counts than ever before yet by some measures MLB clubs have never placed pitchers under more stress.
Since 1988, the greatest percentage of 80-plus-pitch starts that have lasted four innings or fewer – what we assume are generally higher-stress outings – have all come within the last nine years.
The 2018 season marked the first time in recorded history that such starts comprised 6% of all 80-pitch outings. The rate grew to a record 9.1% in 2023. The percentage is again elevated at 7.9% this season.
For comparison, the percentage rested between 2-3% in the late 1980s and early 1990s.
The game has changed, of course. There are more pitchers per plate appearance. There are more strikeouts, more foul balls.

But for all the concern about injury prevention, there is seemingly not much attention paid to what are likely higher-stress outings.
Was Williams’ start of 126 pitches spread across nearly nine innings any more stressful than these starts of 80-plus pitches over four or fewer innings?
Williams averaged 14.5 pitchers per inning in that start. The MLB average this season is 16.5.
In other words, he was about 13% more efficient than the league average versus the Mets, and much more efficient than his typical outing. Williams is averaging 17.8 pitches per inning.
Moreover, he had eight between-inning rests during the 2-hour, and 15-minute game.
Hejka has studied how fatigue, including his own, is affected by longer innings.
“Using PULSE we can quantify something called Fatigue Units. The general idea is that every time you make a throw, you accumulate a little bit of fatigue,” Hejka said. “It usually takes a minute or two to fully recover from a high effort throw, but if you’re making a throw every 15 seconds, only some of that fatigue dissipates before the next throw accumulates more.
“As an inning goes on, you basically never have enough rest time to fully recover from all the throws you’re making. You keep digging yourself deeper into a pit of fatigue.”
"Recovery days are the tax you pay for a high-intensity day." -@ceetwo35 (paraphrased).
Pushing too hard on your light days is a recipe for chronic fatigue, decreased performance, and increased injury risk.
Here's a quick guide on how to better approach these days: pic.twitter.com/AYsCnh40TK
— Josh Hejka (@hedgertronic) April 5, 2025
Those 80-pitch, less-than-five inning outings are placing pitchers deeper into that pit of fatigue.
I asked Williams last month about that outing and his recovery afterward.
In his following start, he allowed four runs over three innings, but he noted he also had two extra days of rest between the Aug. 6 and Aug. 13 starts. He said he felt unaffected by the previous workload.
“I had an extra massage so that helped,” Williams said. “Kept the same shoulder routine, forearm routine. It was all the same.”
Williams hasn’t worn any wearable tech since he was in A ball with the Guardians. He explained he largely bases his between-starts work based on feel. What he does do is curtail his throwing volume between starts once he gets in season, moving from 30-pitch bullpens in the spring to 15-pitch bullpens in the summer.
Over the last year, I surveyed other pitchers about how they respond to volume spread over longer or shorter periods within a game,
Said Cincinnati Reds pitcher Zack Littell: “I definitely don’t respond as well to 100 over four as opposed to 100 over seven.”
Littell said pitching quick, clean innings is like driving on an open highway. There is less physical and mental stress.
But high-stress innings? They hit different.
“It’s like driving in traffic,” Littell said. “You have to be aware of what’s around you. What guys don’t you want to get beat by? Is there a guy on first? Would you rather pitch around this guy? Or try to get a double play? I am going to try and punch out, say, Shohei Ohtani, because I don’t want to allow anything in play?”
Royals starter Seth Lugo was the last pitcher, prior to Williams and Verlander to exceed 120 pitches in an outing back on Sept. 26, 2023.
“Twenty years ago, everyone was throwing 135 pitches. That we cannot do it now? Well, we are not weaker,” Lugo said. “Yes, the roster size has changed over the years, and we are getting to relievers sooner. That’s definitely changed. But I am not the biggest fan of pitch counts.”
Part of today’s reduced workloads are tied to the third-time-through-the-order penalty. Even elite starters with deep enough arsenals to navigate the lineup three times are rarely permitted by their clubs to pitch deep into games. But perhaps they should be. It could be a great advantage.

Lugo has pitched in various roles in his career. He believes there are different styles of pitching that should be placed in different workload buckets.
“A guy who is out there throwing as hard as he can every pitch, throwing max effort, yeah, they are going to fatigue faster,” he said. “But think of guys that have been around for longer. More old school. You are going to save your best bullets for when you are in a jam … If I am throwing 89-91 (mph) all game, I am not really getting tired. I am playing catch.
“So, I never liked the idea that we picked 100 (pitches) because it’s three digits, and that’s when you should be tired, or come out of a game. It’s ridiculous. Just because it’s a round numerical value? We apply that to our bodies? It’s pretty insane to me.”
But whether coming off higher-stress or lower-stress outings, most pitchers do not alter their between-start routines. One reason? Few are measuring something like Fatigue Units.
While most throwing programs count total throws, Driveline has argued it is the quantifiable stress of throws that matter, not raw counts, and that building up greater chronic workloads – which is the throwing habits over a long period of time – is important in allowing pitchers to handle the demands of a full season.
PULSE measures that ability to properly build and manage a chronic workload.
Tampa Bay pitcher Ryan Pepiot faces a new challenge this year: he’s occasionally pitching in afternoon games in the heat and humidity summer-time Florida as the Rays are housed in a temporary minor league home in Tampa.
He’s lost between 8-10 pounds during such outings, he said. He says the strength and conditioning staff does an excellent job of recharging him. Still, he’s fatigued differently from such a start, but the game is not well equipped to measure it. Like so many pitchers, he’s not using wearables to monitor his between-start throwing workload.
While the data-driven Rays rarely allow their starters to face the lineup a third time, Rays pitching coach Kyle Snyder doubts the industry’s approach to limiting work is promoting better arm health.
“For me, it’s done nothing for us, the 100-pitch counts, limiting that. Injuries have done nothing but skyrocket,” Snyder said. “There’s still more that we don’t know than we do know.”
We need more data, to lead to more answers.
What is also striking is how little individualization there is regarding pro workloads.
We know that MLB starters are less frequently reaching 100 pitches. There were only 635 outings of at least 100 pitches last year, just the second time in the pitch-level data era that pitchers combined to fail to reach 700 in a season. This season is in line for another significant decline, a pace for 579 outings. That is down from a record number of 2,414 set in 2014.
But one threshold all starting pitchers generally still meet in a game is 80 pitches.
MLB pitchers are on pace for 3,806 outings of at least 80 pitches, about 90% of all starts, which isn’t that far off from the 1998 mark – 4,057 games – the first year of 30 teams in MLB.
Almost every arm is essentially allotted the same range of pitches in a given start, 80 to 100, regardless of skill, mechanical efficiency, or physical traits.
Driveline trainer Brett Cook said there can be great differences in how different pitchers can get to similar mph readings.
“Something we found to be interesting is just the relationship between arm speed and velocity,” Cook said. “I’ve had pitchers whose arm speed on PULSE will get up to 1200 or 1300 rpms, but they have only an upper-80s fastball. Then I’ve seen other pitchers whose arm speed is at 950-1000 rpms, but they have a mid-90s fastball.
“I think the question right then and there can become ‘Is the pitcher with the mid 90s fastball that much more efficient with their mechanics that they don’t have to use their arm fast, or they are not using their arm as much and truly not placing as much stress per mph on their arm? And if so, potentially, it gives a little more leeway to have more individualized workload prescriptions for their program.”
Right now, the programming, the workloads, are often one-size-fits all in much of professional baseball.
At Driveline, the focus is on individualized training. Solutions and progress begin there.
“We need to transition more to a world where we are giving athletes with PULSE, with radar gun feedback as well, very precise metrics to hit within a session,” Cook said. “That’s how strength and conditioning has been for years. You place weight on a bar, and you track how much you (lift). You might try and add five pounds to the bar week over week.”
There’s a lot to learn, and PULSE can help.
The industry can benefit from smarter pitch counts, and more individualized throwing regimens. That quest begins data collection and learning from it. It begins with PULSE.
Comment section