Using MLB Bat Tracking Data to Better Understand Swings
Introduction
A few months ago bat tracking metrics were released on BaseballSavant.mlb.com. With these metrics being publicly available, individual swings can be analyzed at a level never seen before. We previously covered the implications on YouTube.
The insights we’ve garnered as a community from only the release of bat speed and swing length on each swing are pretty remarkable. Off of these two metrics, we’ve seen a suite of stats introduced from MLB like squared up rate, fast swing rate, blasts, and swords. It’s worth noting that squared up rate is incredibly similar to the smash factor metric we have been using to quantify bat to ball skills for years. More on smash factor here: https://www.drivelinebaseball.com/2021/02/smash-factor-a-data-driven-approach-to-assessing-the-hit-tool/?srsltid=AfmBOor-S27juvYQUFTd1yeyt5bL1pF5Op6A-IZcpvbuB7yQ5_6AIkvw
Beyond the raw metrics and corresponding statistics released on Baseball Savant, we’ve seen some incredibly cool analysis from people all around the industry. With analysis ranging from utilizing bat speed as a “swing confidence” metric to analyzing approaches based on bat speed distributions, we’re still only scratching the surface in understanding batter-pitcher matchups. As more metrics, like attack angle, are released this analysis will only go further.
Digging Deeper
The metric that really stumped me on release was swing length. At Driveline we utilize Blast regularly to aid us in analyzing the swing. The length of the swing from start to impact was never something that we measured and analyzed in-depth. Fortunately, with access to The Launchpad we were able to retroactively create the metric and see how it related to the Blast metrics we commonly use. Particularly, rotational acceleration and time to contact were of interest. Primarily due to the fact that they can be easily calculated based on kinematic physics equations, as people like Kyle Bland have previously done. Hypothetically, the two can be determined from the following equations:

Treating distance as swing length and final velocity as bat speed, we can do some algebra to end up with these final equations:

Perfect! We have some Blast metrics, right? Well, not exactly. We make some major assumptions about the swing that aren’t necessarily true. The first being that velocity and acceleration occur on the same plane. We know that this isn’t the case in practice, as the bat rotates around the top of the handle for the beginning of the swing and closer to the hands for the latter half of the swing. The second main assumption being that acceleration is constant. Taking a peak behind the curtain via Tom Tango’s blog, we can see that this is not the case.
With these assumptions recognized, we can still validate how well they hold up using our in-gym data.
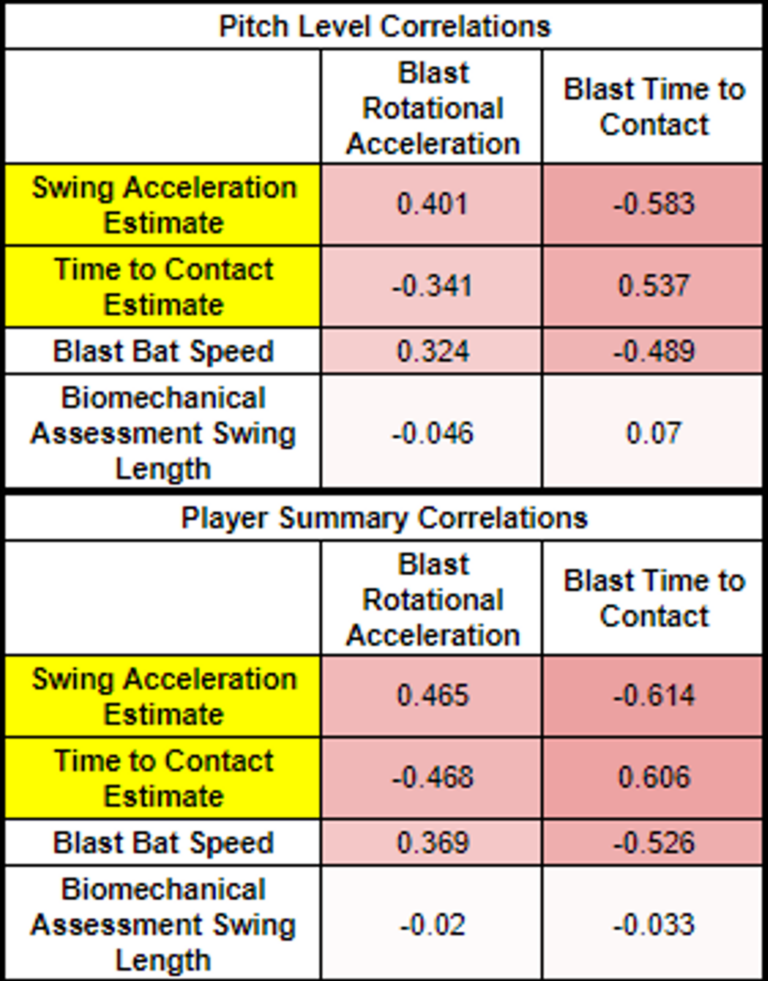
The kinematic calculations aren’t perfect, returning moderate correlations between the Blast metrics. There are a few notable takeaways:
- Each Blast metric is better described when rolled up at the player level
- Each new metric describes the corresponding Blast metric better than just using bat speed or swing length
- The two new metrics themselves are highly correlated
Now applying these calculations to MLB data, we see much more significant relationships when rolling up at the hitter level.
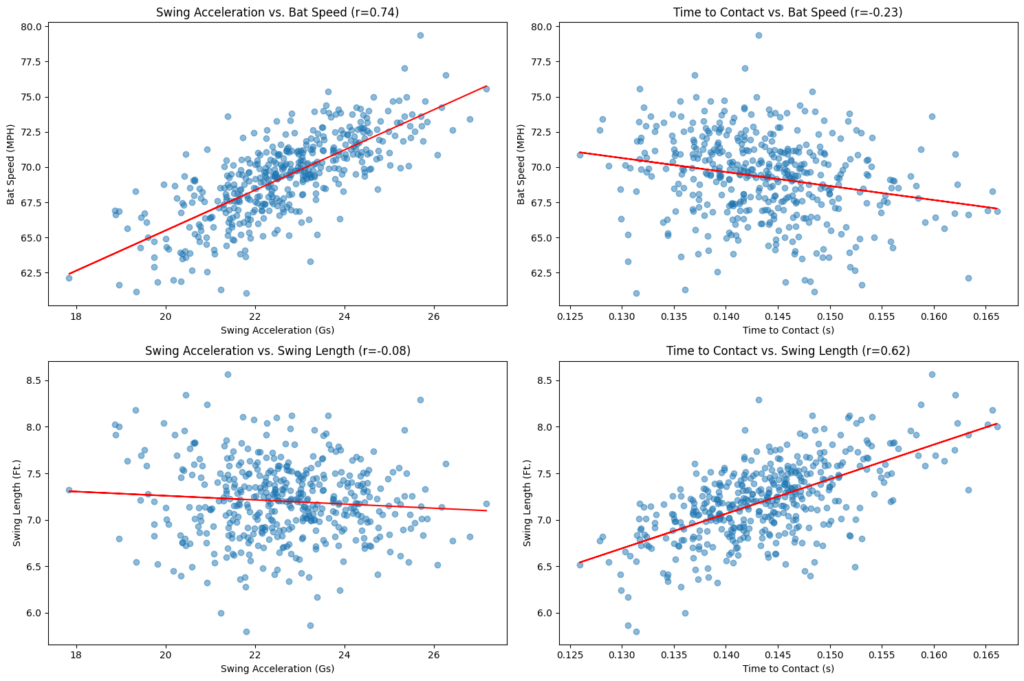
This is a combination of MLB having a wealth of data (440 hitters with at least 25 swings), compared to our relatively limited in-gym dataset (48 hitters with at least 7 swings) along with slightly different measurements of bat speed and swing lengths. We are measuring the same thing, but in different ways, which undoubtably influences the differences. As expected, based on the equations, the top swing accelerations and time to contact values come from generating high bat speed relative to swing length.


Categorizing Hitters
With some new metrics we can attempt to describe different swings and see which types of swing characteristics lead to different outcomes. To do this, we can use K-Means Clustering with varying levels of inputs, see how hitters can be grouped, and how results differ by group.
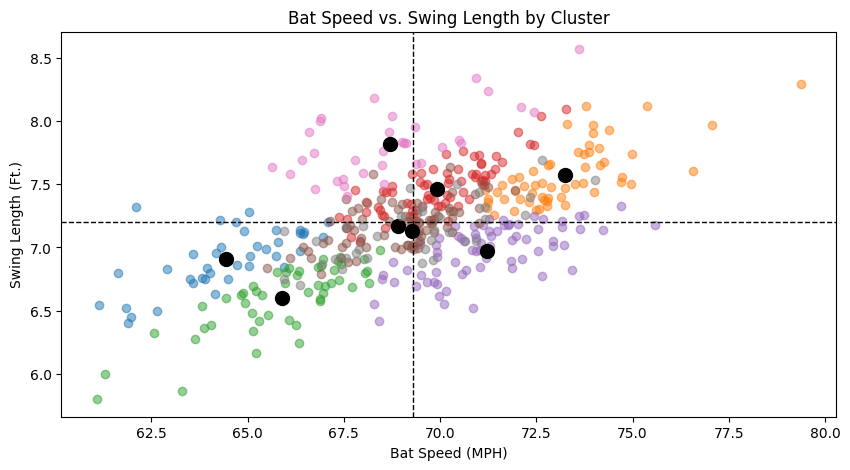
Round 1: Bat Speed and Swing Length
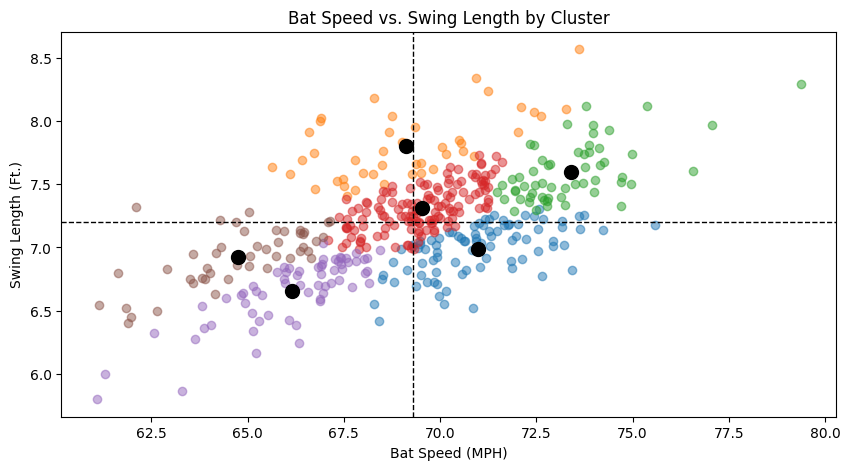
To start, we can use just the raw metrics provided by Statcast in bat speed and swing length and create 4 clusters. Note that the bat speed measurements do not factor out the bottom 10% of swings so values will be slightly lower than displayed on Baseball Savant.

What results is relatively intuitive, with the groupings essentially being:
- Orange: fast and long
- Green: slow and short
- Blue: average and short
- Red: average and long
We can see how each group produces, along with some other descriptive metrics to gauge how they get that production with the following table (ordered by wOBA).

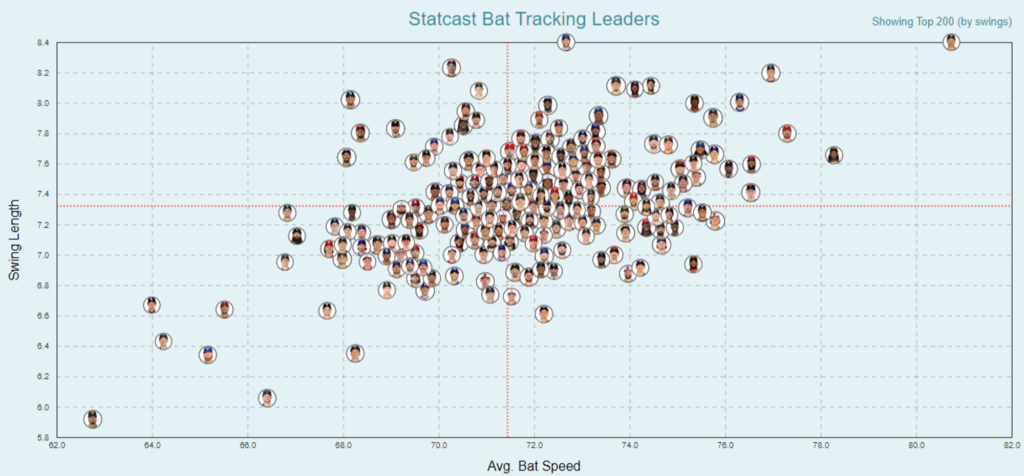
There’s not too much to break down here, as these clusters are essentially the quadrants anyone can find when they pull up the bat tracking leaderboard.
Round 2: Adding Swing Acceleration and Time to Contact
Let’s expand our clustering dataset to now include our swing acceleration and time to contact estimates. When doing so, we see some much more interesting clusters created (this time expanding from 4 to 6).

We now have a much more nuanced view of the hitters. The previously bucketed “slow and short” swings have been divided into swings that accelerate quickly (purple cluster) and those that accelerate much slower (brown cluster). An additional cluster in the middle (red), with relatively average metrics all around, makes the others around it more distinctly different. For context, here are some representative hitters from each cluster and some insights into what success and failure looks like within the group:
- Green: Aaron Judge, Shohei Ohtani, Yordan Alvarez
- Very efficient to the ball and finds success in utilizing the high bat speed to hit pitches out in front for power. This group may be plagued by a high whiff rate.
- Blue: Juan Soto, Bobby Witt Jr. Gunnar Henderson
- This group is the most efficient to the ball and is full of complete hitters that can hit for average and power. Hitters in this group who struggle likely are finding their efficiency by hitting balls too deep.
- Red: Kyle Tucker, Christian Yelich, Christian Bethancourt
- This group of hitters is the largest, consisting of the most “average” players by bat speed, swing length, swing acceleration, and time to contact. The hitters who find success here are generally good at getting up to speed quick and pulling the ball.
- Purple: Steven Kwan, Mookie Betts, Josh Smith
- This group consists of slow to average bat speeds but all very efficient swings. They find success in strong utilization of bat to ball skills and may struggle with too steep of an attack angle.
- Orange: Jose Altuve, Cody Bellinger, Marcus Semien
- This group has high variance with its best hitters finding success by elevating the ball to the pull side, thanks to a point of contact well in front of the plate. The hitters who struggle in this group are due to their high swing length being a product of a truly long swing, not a point of contact that results in pulled fly balls.
- Brown: Charlie Blackmon, Cavan Biggio, Nicky Lopez
- This group generally struggles, with a low bat speed and not getting to that bat speed quickly. The hitters who find success are doing so through a contact-oriented approach with the margin for error being razor thin.
Round 3: Adding Attack Angle
After building this classification, I wanted to attempt to categorize the hitters one more time, this time including attack angle. Attack angle is currently not a public metric, and this version is not ground truth — it is an estimate based on a model built on in-gym data. For this iteration I added two more clusters to get the following classifications.


With this final addition (the only one not based directly on bat speed or swing length) the classifications remain relatively similar for the blue, green, orange, purple, and pink groups. What is interesting, though, is how convoluted the center of the 2D plot becomes. The group previously in the middle is broken up, revealing a more complicated relationship between swing metrics than previously seen. To better contextualize these three groups here are some representative hitters and some insights into results:
- Brown: Brenton Doyle, Yandy Diaz, Kevin Kiermaier
- Slightly slower swings with a very flat attack angle. If these swings are successful it’s likely because of a strong contact oriented approach. They don’t whiff much but may struggle to hit for power.
- Grey: Max Muncy, Christian Encarnacion-Strand, Brandon Lowe
- Relatively normal swings in the context of bat speed and swing length, but follow a very uppercut path. These swings find production through power, while hitting for a low average and whiffing often.
- Red: Trea Turner, Jesse Winker, Patrick Wisdom
- This cluster consists of slightly longer than average swings that take longer than average from start to impact, but generally benefit from hitting the ball in front of the plate. These longer swings may result in too many whiffs.
Concluding Thoughts
There’s no “one size fits all” approach to apply to all hitters. Even at the highest level an outcome (wOBA), good or bad, can be reached through different approaches. With that said, there are clear trends that still hold true. A higher bat speed opens the door to a multitude of different approaches. With lower bat speed, the options are significantly lower and the margin for error is incredibly small.
These cluster trends reinforce the importance of individualized, data-driven training programs in hitting development. By identifying hitter profiles we can detail specific needs, ranging from bat speed, to bat to ball skills, to approach at all levels of the game.
Comment section