The Interaction of Biomechanics and Command

Velocity Training: A Brief History
We were lucky enough to receive the 2025 Dr. Mike Marshall Pitching Biomechanics Research Award from SABR in March for our research into the Biomechanics of Command in Baseball Pitchers. This blog will go over the motivation, methods, and findings behind this research. We feel like it makes the most sense to describe our initial motivation through the lens of the history of velocity training.
Motivation
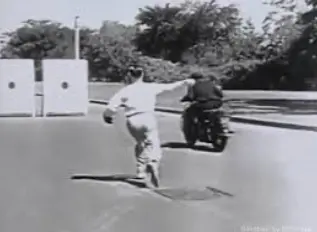
Velocity started as a skill viewed as almost entirely innate. It was understood as something that made it hard to hit a baseball, but little was known outside of that. For most of baseball history there was no way to quantify velocity. They once drove a motorcycle past Bob Feller to try and get an idea of how hard he threw, but there was no way to measure velocity with any accuracy. Training regimens for pitchers were still almost entirely non-existent, outside of stretching and maybe some calisthenics.
Fast-forward to the ‘70s, where radar guns became more commonly used in MLB stadiums. The appearance of instant, quantifiable feedback on the velocity of a pitch unlocked a new level of depth in understanding the art of pitching. If we want to improve something we first have to be able to measure progress. Guys like Nolan Ryan were dominating the league with high-octane fastballs and proper lifting programs. This is also around when Mike Marshall was gaining prevalence in his injury-prevention methodology, leading to very early weighted ball and biomechanics research.
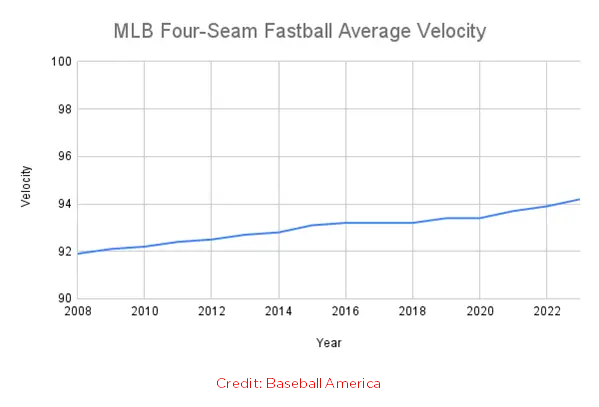
Now in today’s game, we are seeing the results of extrapolating along this same pattern. The MLB average fastball velocity is faster now than ever before, increasingly roughly 2 MPH in the last 10 years. Weighted balls, lifting, and biomechanics are now standard parts of a pitcher’s training program. Training for velocity gains is now considered almost the bare minimum for any pitcher aspiring to be the best.
It’s no secret that this paradigm shift was driven by an influx in information. Trackman units and biomechanics labs are now commonplace at any high level facility or organization. This tech allows us to easily quantify attributes that have been proven to be important.
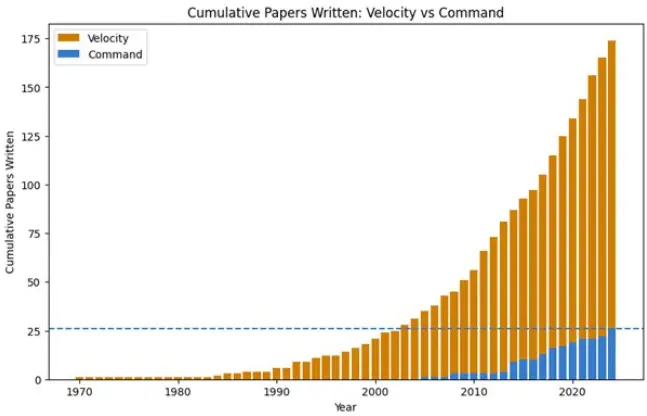
Command has taken a clear backseat in this information era. It’s still broadly understood that command is important, but the lack of quantifiable information in this field has prevented this understanding from developing alongside mechanics and velocity. To this point, almost all publicly available data on command is qualitative and outcome based. For example, by common measures of command like In-Zone% or Strike%, a buried 1-2 curveball will be punished, while the “hung” 0-2 curveball will get rewarded. This is mostly because the pitcher’s intended location is very difficult to measure. As a result, command research is roughly 20 years behind velocity research.
Because of this, training command has largely been a black box since the inception of the sport. The leading methods of training command have simply been to throw more, and throw with an increased focus on hitting the right spot. No substantive biomechanical analysis has reached the mainstream, with each coach having their own idea of what constitutes “good” mechanics in this way. The most consistent rhetoric was encouraging pitchers to have “repeatable” mechanics, without any specification of what needs to be repeatable or what repeatable even really means in this setting. This is what we set out to address with our research.
Command Case Study
Despite this lack of publicly available research, command is well understood to be integral to the success of any pitcher, and therefore should be a focus of any pitcher’s development. To show just how integral this skill is, we’ll take a look at a case study comparing pitchers across different command and velocity profiles.
Here we compare Kyle Hendricks, Yu Darvish, and Ben Joyce. All right handed pitchers with vastly different average fastball velocities, as shown below. These are run value (RV) heatmaps, where blue corresponds to lower run values, which are better for the pitcher.
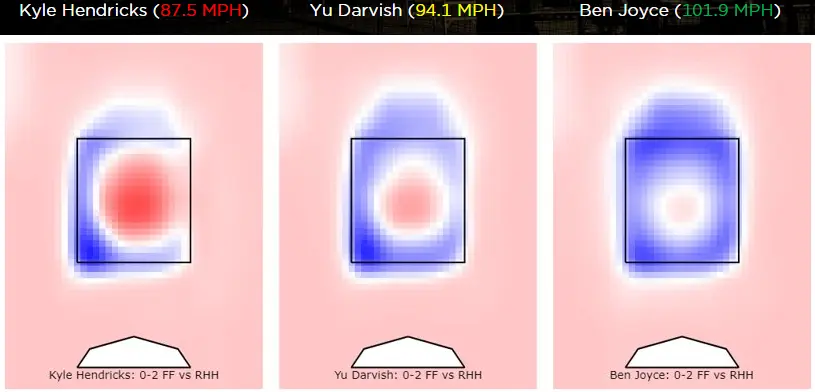
The different velocity profiles clearly have an impact on each pitcher’s margin of error in an 0-2 count. Hendricks basically has to hit the outside corner to have a good RV result, while Ben Joyce can do just about anything as long as it’s in the zone and not center cut.
It should be noted that these heatmaps don’t tell the whole story. MLB average fastballs miss their intended spot by roughly 11 inches on average (intention determined via InsideEdge). Whether a pitcher has elite, average, or bad command plays a crucial role in a pitcher’s *actual* miss distribution.
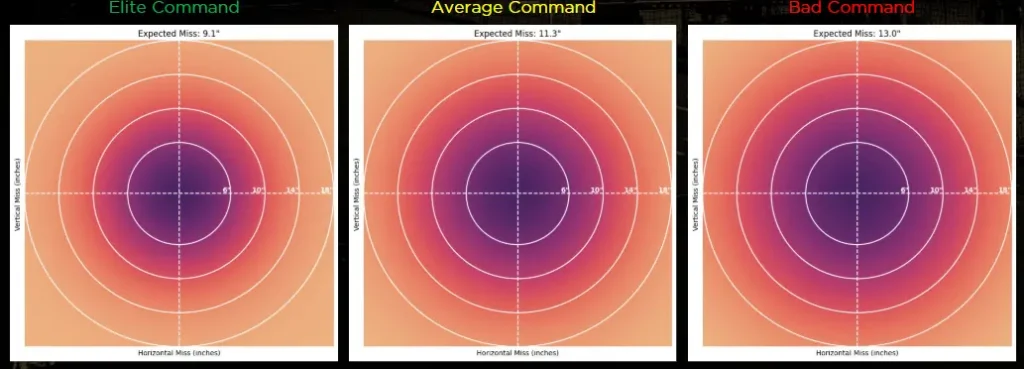
When we run convolutions—a mathematical operation on two functions that produces a third, describing how the shape of one is modified by the other—combining these heatmaps with expected miss distributions, we get a heatmap that better represents the optimal “aim” point for the pitcher.
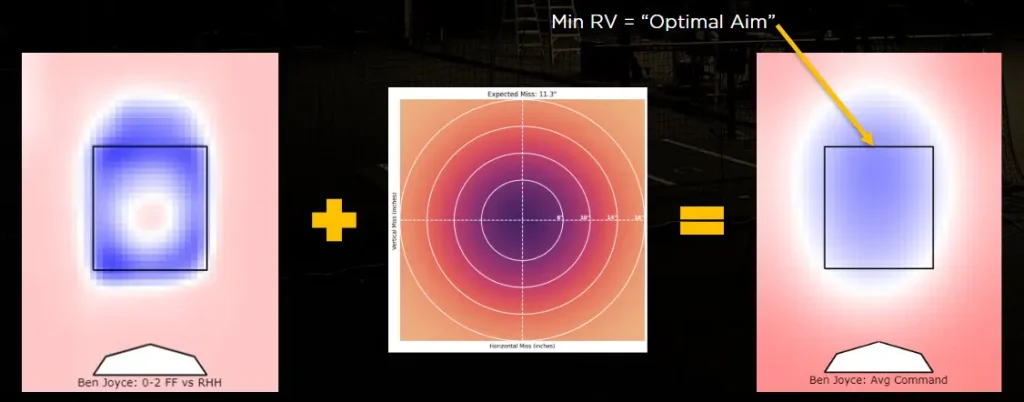
Doing this for each combination of velocity-command profile, we get an RV heatmap grid that looks something like this.
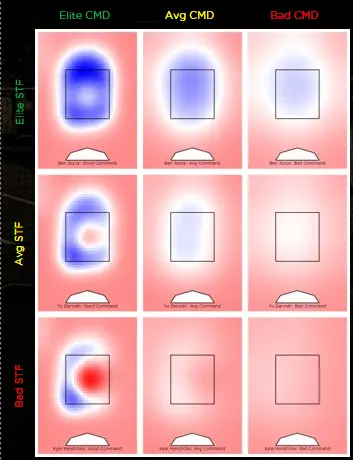
Immediately you can see that Hendricks has basically no good place to aim if his command is average or worse. Darvish has some more room to work with, but still runs into a similar problem if he were to have below average command. Meanwhile Joyce can still aim just about anywhere in the zone and likely get a good result, even if he has bad command.
This tradeoff makes sense intuitively. Velocity essentially buys you room for error with your command. Training economy is a finite resource, so it’s important to know when to try and move left on this grid instead of up. But the problem once again lies in the fact that the science behind training command is in its infancy; even when you want to move left on this grid, there are no proven ways to do it, and there are no tools than can measure improvement.
Intended Zone Tracker
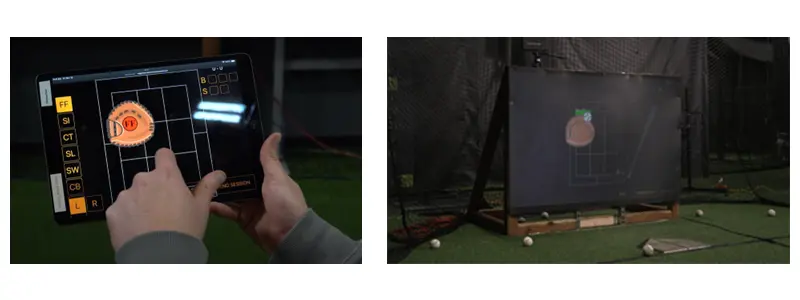
Enter the Intended Zones Tracker. This is a piece of technology developed here at Driveline that allows us to numerically track a pitcher’s ability to command the baseball. Trainers or players can pick their intended location, get that instantly displayed via a projector, and then we use a Trackman Mobile unit to relay immediate visual and quantifiable feedback of the resulting pitch location relative to the intention of the pitcher. The Marlins’ Janson Junk has enjoyed tremendous benefits in working with the IZ Tracker, improving to a 113 Location+ last season. The motivation behind this tool was largely to address the shortcomings of measuring command highlighted earlier. Previously, the only reliable way we could attempt to measure pitcher intent was to use video to manually tag the catcher’s glove location for pitches, which is consistent, unreliable, and more labor intensive.
Now, we have quantifiable objective. We have our radar gun. The next step will be using this new tech to identify, quantify, and train the movement patterns that drive this skill. By leveraging the IZT in conjunction with our in-house biomechanics lab, we were able to conduct research to address this underdeveloped field.
Methodology
The data we collected came from a paired combination of the IZT and the Launchpad (our biomechanics lab). We collected data from a set of athletes that were fully on-ramped, in a Velocity phase, and participating in “A Days” (~90% intensity). The data we collected was miss distance from the IZT and a full biomechanical analysis from our Launchpad. This set of athletes included a mix of college, independent professional, affiliate professional, and MLB pitchers.
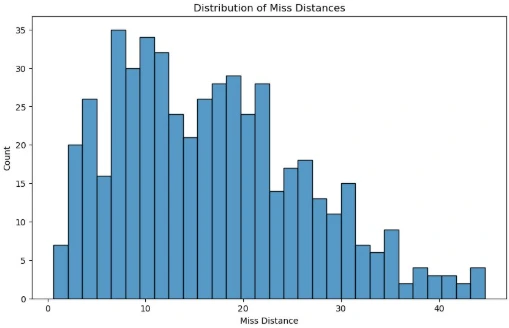
All athletes were instructed to throw 8-20, middle-middle fastballs. Data was collected from the same athletes once a week if possible. Some athletes were present in gym longer than others, leading to a inconsistent number of throws per athlete.
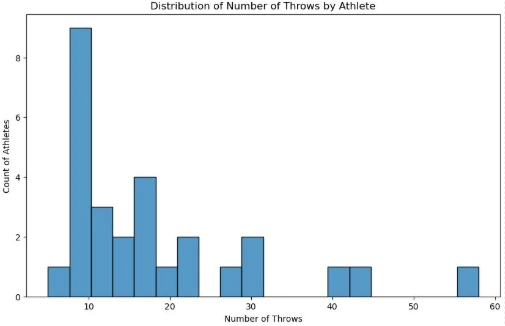
In our analysis, we ended up taking only the first 10 throws from each athlete’s subset (excluding athletes with less than 10 throws), leaving us with 27 athletes and 270 throws.
Results
Standard Deviation Analysis
After trying a few analysis methods, including the ANOVA framework outlined here in some significant previous research, we concluded that our sample size was likely too small to identify meaningful relationships between the raw biomechanics values and miss distance. So instead, we decided to try and address the notion of repeatability often found around good command pitchers.
This is one of the only consistent narratives connecting mechanics to command found in baseball. Guys with “repeatable” mechanics are said to have a better chance of developing good command, and guys with good command are often described as being able to repeat their mechanics well. But for as long as this phrase has existed in the game, it has never been clear *what* exactly needs to be repeated, or what repeatability means on a more granular level. These were the main questions we sought to answer.
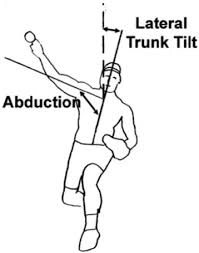
To do this, we looked at joint angles and joint angular velocities at 4 key points in time. These key points were peak knee height (PKH), foot plant (FP), max external rotation (MER), and ball release (BR). I will be using abbreviations to refer to each of these key points going forward.
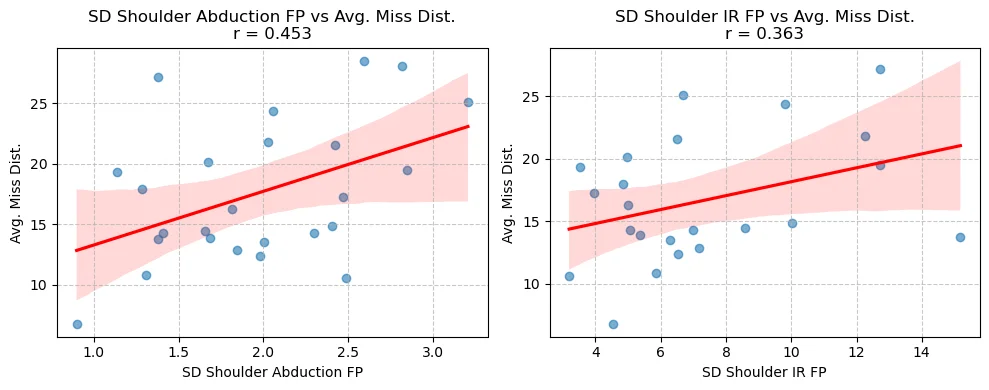
For each of these features, we calculated the standard deviation for each athlete, leaving us with 27 standard deviation values for each feature. We also calculated each athlete’s average miss distance, and found the correlations of these standard deviations to average miss distances. This method gave us much more signal than any other previous attempt, with multiple features having a Pearson’s Correlation R Statistic with an absolute value over 0.5.
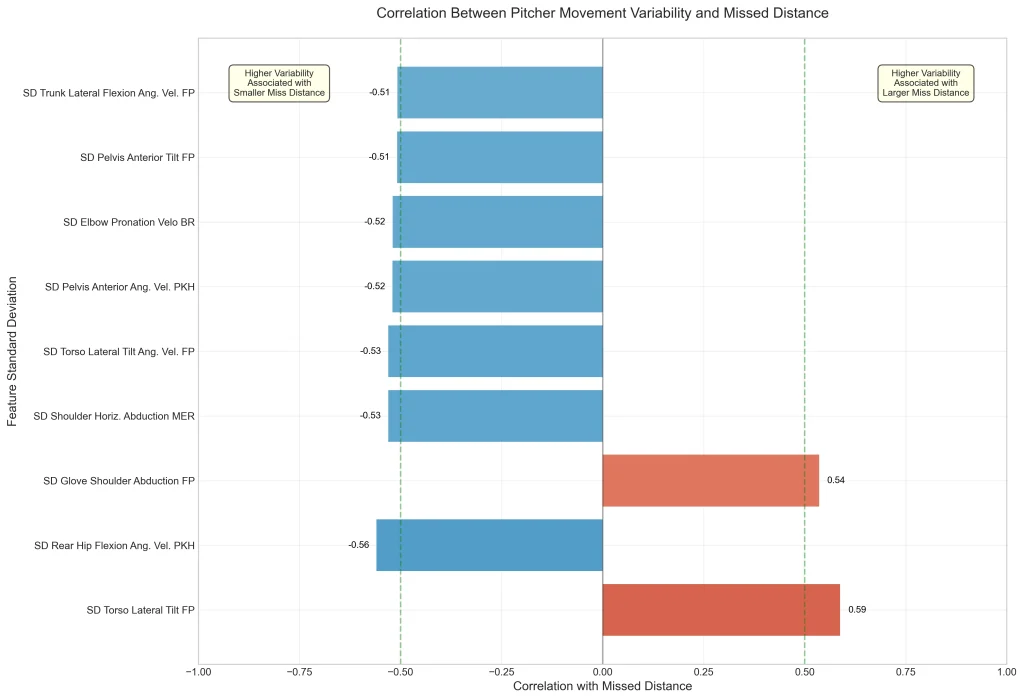
Here, positive correlations suggest the more consistent or “repeatable” the metric is, the lower the miss distance is on average.
We see that more consistent glove shoulder abduction and torso lateral tilt at FP seems to correlate significantly with miss distance.
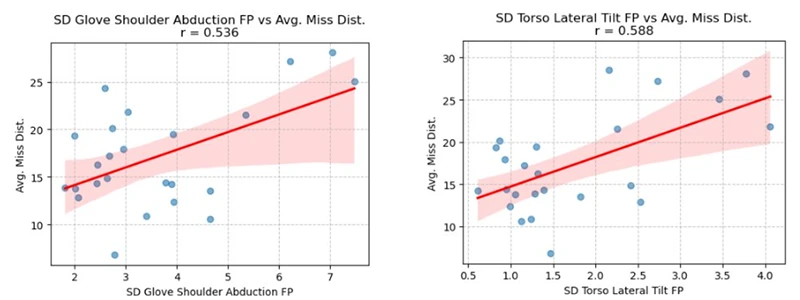
This makes sense, as glove shoulder abduction at FP would contribute directly to the pitchers front side position as he begins to rotate. Differences here would likely have a myriad of downstream effects that would affect release and miss distance. Similarly, torso lateral tilt sets the axis that the pitcher rotates around, so deviation here would likely impact arm angle and ball release directly.
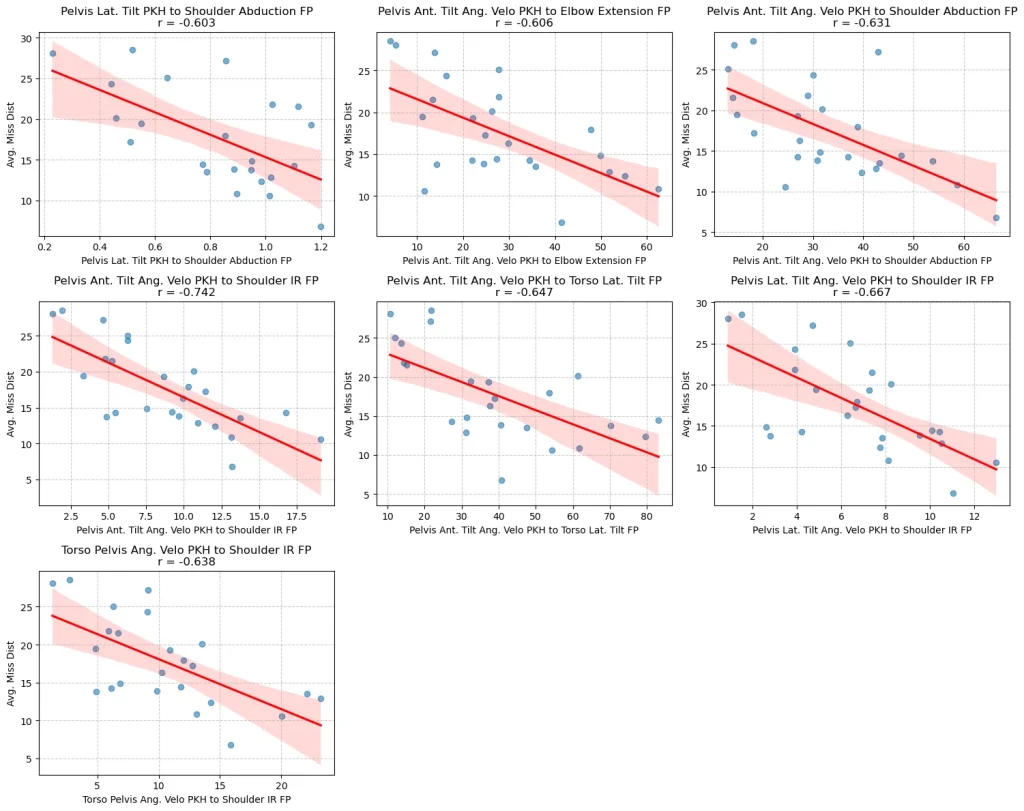
We noticed that there were many more features with negative correlation than we were expecting. Since a negative correlation suggests that more variance relates to lower miss distances, we interpreted this as suggesting that adjustability was at least as important as repeatability when explaining variance in command.
This surprised us, given how much this “repeatability” skill that has been so sought after by scouts. But at the same time, this makes a lot of sense from the perspective of athletics as a whole. Experienced runners are known to be able to compensate for fatigue and subconsciously adjust their form to maintain peak output for longer. This has been postulated to be the case for maintaining throwing velocity in pitchers as well.
Building off of that, it makes sense that accuracy – like peak output – is something that is maintained by these subconscious adjustments. Think here of Bernstein’s Hammer, the most elite blacksmiths will always hit the center of the blade, despite never having the same hammer-swing mechanics.
Examples of adjustability and compensation being important parts of elite output are littered throughout many sports. More modern examples include athletes like Scottie Scheffler or Steph Curry. In golf, Scottie Scheffler is known to be one of the best ball strikers of his generation, and also known to have some of the most unorthodox and inconsistent footwork ever seen on the PGA tour.
Similarly, Steph Curry maintains his unparalleled ability to sink shots regardless of where his body is going, how fast he is moving, or where the defenders are in front of him.
Now, these negative correlations are evidence that the same principals hold true in commanding the baseball. While the negative correlations we encountered earlier support this notion adjustability being important throughout the throw, there were still no clear patterns or stories to tell, so we decided to take this analysis a step further and apply some principal component analysis.
Principal Component Analysis
Essentially, what PCA does is combine existing features into “component” features in such a way that explained variance is maximized for any given number of components. In our case, it took 10 principal components to explain 80% of the variance present in our feature set. Note here that this explained variance is the variance within our feature set, not our response variable (average miss distance). We then had to take these components as a new set of columns, and get correlations to our average miss distance response variable.
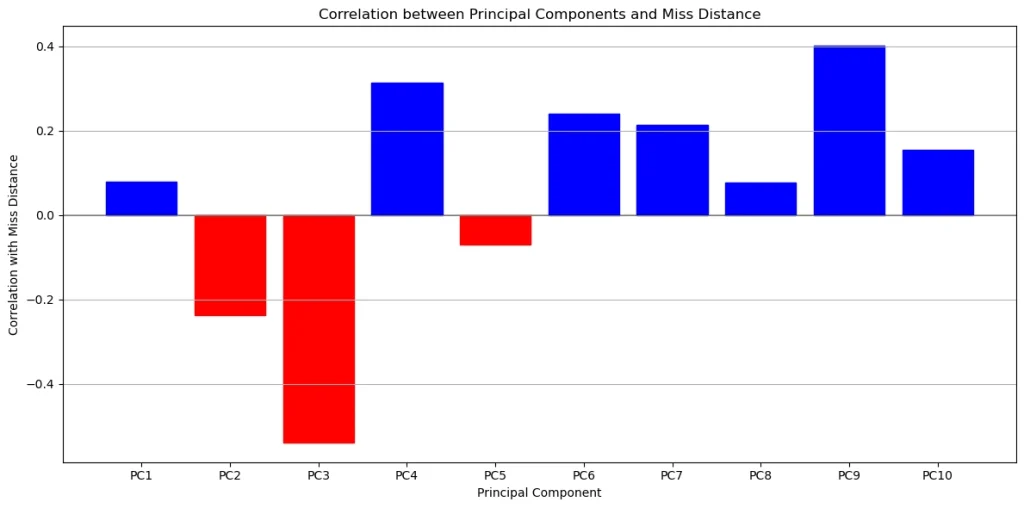
Again, positive correlations suggest repeatability being important, and negative correlations suggest adjustability being important. Here we see we have a couple more suspiciously strong correlations.
First we’ll take a look at the original features that compromise the component with the strongest correlation. This is the component with the greatest negative correlation to average miss distance, or our “adjustability component”, PC3.
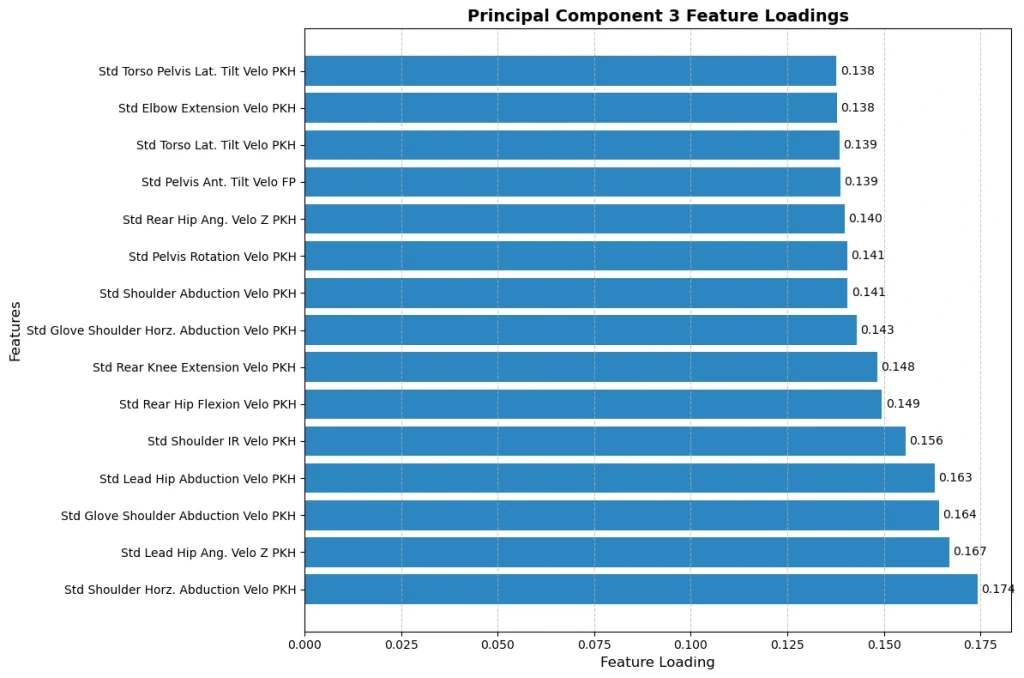
Immediately we see that these feature loadings are all positive, maintaining a clear signal that being adjustable with these variables is important for having a low miss distance. We can also see that all of these variables are angular velocities, and 14/15 are measured at PKH.
This strongly suggests that being adjustable in the way you are moving into and out of the top of your leg lift relates to having good command
Now lets take a look at the features that correspond to the highest positive correlating component, our “repeatability component” PC9.
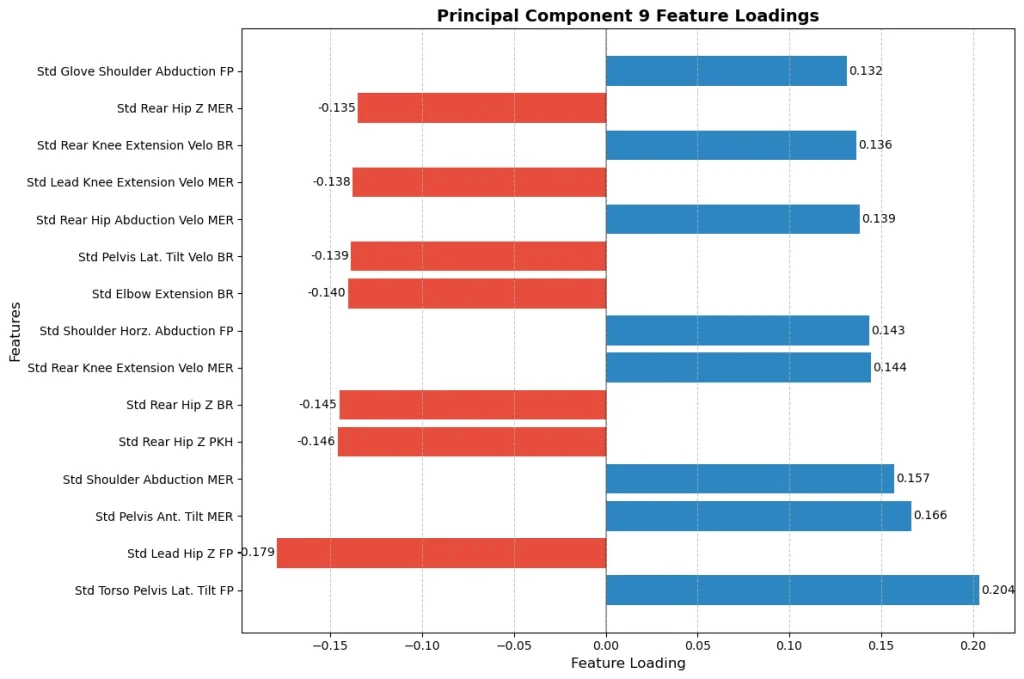
These feature loadings are much more of a mixed bag – some positive, some negative – making it hard to interpret towards any real conclusion. Although it is worth noting that all of these features occur after PKH, suggesting that being more repeatable in certain ways after PKH has a strong relationship to command.
Digging Deeper
This wasn’t quite the clear picture we wanted to see. It seemed like there was a combination of repeatability and adjustability that we were failing to quantify. So we took a new approach, and built off of some core principals we felt were crucial for this analysis.
1. Pitch location is a result of a sequence of positions
a. This sequence is the throw itself, driven by the kinetic chain
2. Each position is a result of previous positions
a. This means both earlier in time and earlier in the kinetic chain
3. Getting to “correct” positions by release is necessary
a. “Correct” only determined by delivering the ball to the intended location
This is to say, when a pitcher is “out of sync” they must adjust accordingly before release.
Now, it is worth noting that, while some positions likely need to be as repeatable as possible, perfect repeatability is an impossible goal. No two throws can be exactly the same, especially at high levels and extreme velocities, but the ultimate outcome of pitch location should be repeated as much as possible. So given that, it makes sense that some actions *must* be variable to compensate for prior unneeded variation that popped up during the throw.
Dampening Scores
Given what we mentioned above, and the fact that we need to connect repeatability and adjustability conceptually, order of events is now crucial. This led us to breaking down our movement patterns into two distinct categories
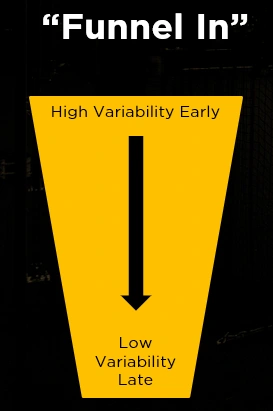
Funnel In
“Funnel In” is the name we gave patterns that start from a high variability state, and end in a low variability state. You can think of this as having different “entry” patterns or movements, but getting to the same end point throw to throw.
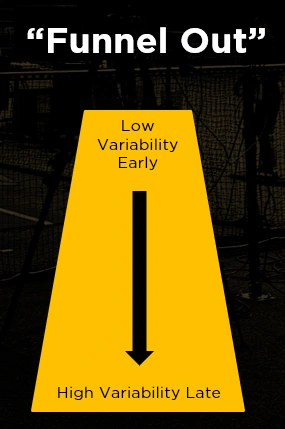
Funnel Out
“Funnel Out” is the name we gave the opposite pattern. This is where the pattern starts in the a low variability state, and ends in a higher variability state. Think of this as having different “exit” strategies but having a more consistent starting point.
The Math
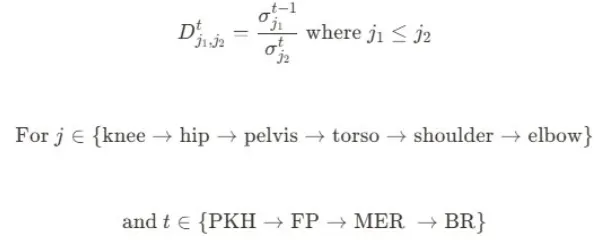
To represent these concepts, we took a ratio using the standard deviations we mentioned earlier. Here, the denominator must represent a feature that is both at the next key point in time and also after the numerator in the kinetic chain.
We called these “Dampening Scores”, where a high dampening score represents a “Funnel In” relationship, and a low dampening score represents a “Funnel Out” relationship.
For example, this means we would take the standard deviation of lead hip extension at FP, and divide it by the standard deviation of shoulder abduction at MER, and also glove shoulder abduction at MER, and also torso lateral tilt at MER, and so on. But we would not divide it by the standard deviation lead knee extension at MER, as that is below the hip in the kinetic chain.
This breaks the throw down into 3 distinct phases
1. PKH to FP
2. FP to MER
3. MER to BR
We calculated every valid dampening score for each of these 3 phases, and again found the correlation of these features to average miss distance. We saw a much larger set of significant correlations and much larger correlation values overall.
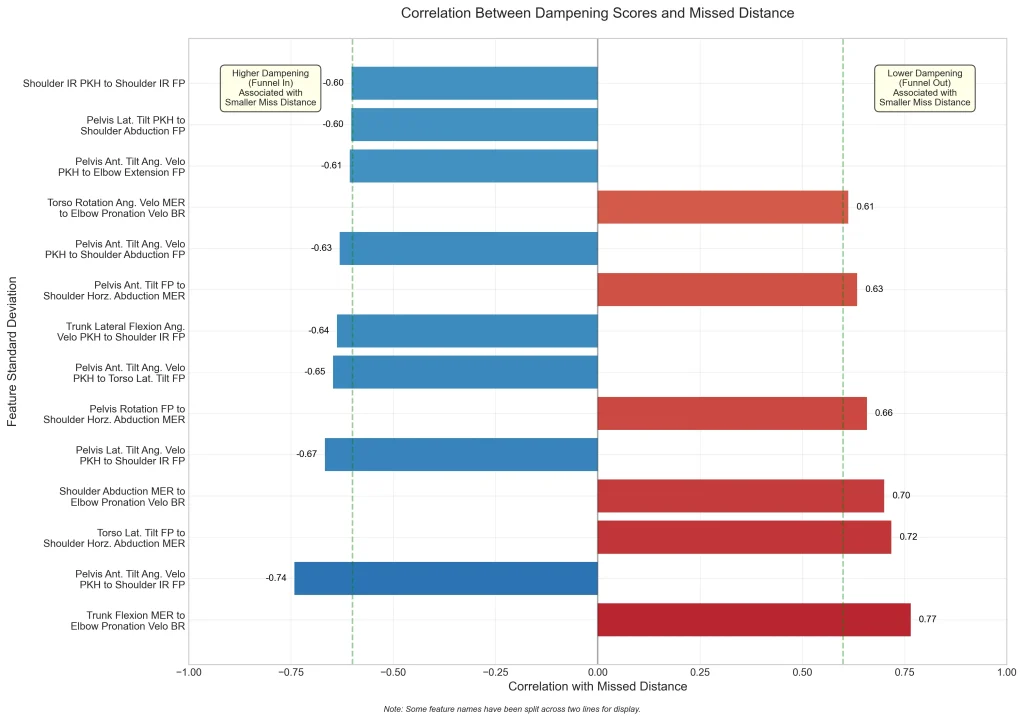
Peak Knee Height to Foot Plant
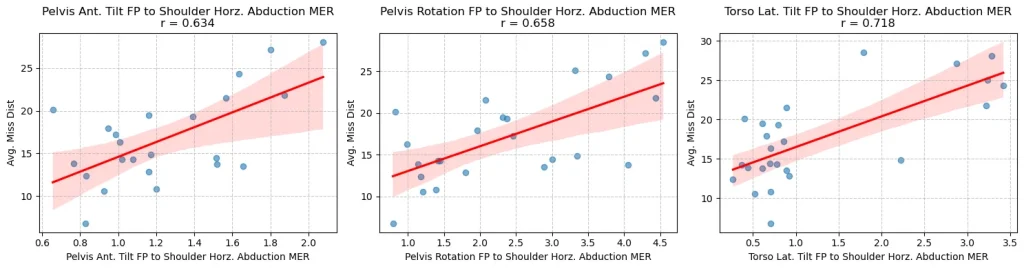
First we’ll take a look at the features that represent the transition from PKH to FP. Here, we see that all of the dampening features with more than a 0.6 correlation coefficients are all negative, meaning that they are all “Funnel In” features. Specifically, we see a lot of pelvis and torso related metrics at PKH, and we see a lot of shoulder IR abduction at foot plant.
These pelvis and torso metrics being important at PKH makes sense, as PKH is typically where the “drift” of the CoM and “coil” of the torso/pelvis occurs. Throwing shoulder IR and abduction at FP are setting the stage for the “flip up” of the throwing arm, which will begin to occur almost immediately after FP. In general, FP can be seen as the last place of stability before the throw enters its main rotational phase. In this way, FP acts as a “firing point”,
This suggests that having more adjustability through your leg lift, drift, and coil, so that you can get to similar flip up positions by FP, indicates better command.
Generally, knowing what these FP flip up positions actually are on average tells us nothing about miss distance
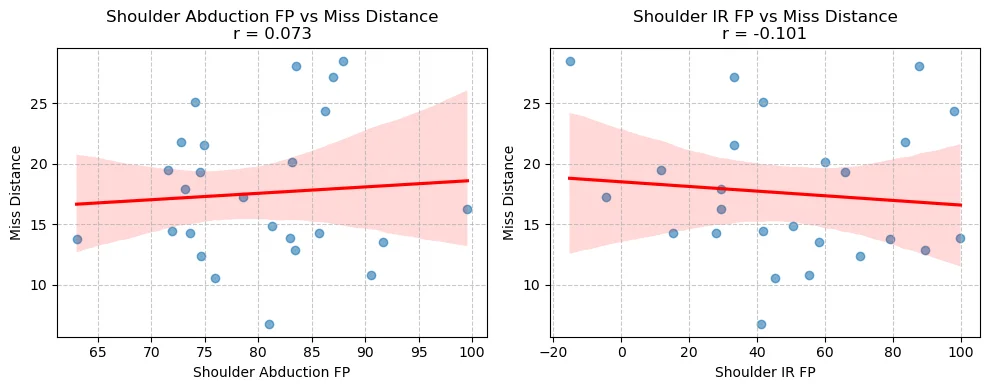
Knowing the standard deviation of these positions shows a stronger relationship to miss distance, suggesting that being more consistent is better for command.
But once you put these positions in the context of how adjustable the pitcher was during the leg lift, there is a much stronger relationship to miss distance on average.
Foot Plant to Max External Rotation
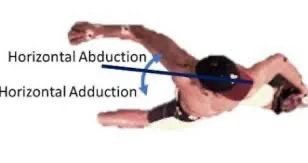
All of these significant correlations are positive, meaning they are “Funnel Out” features. Specifically, we see that having consistent trunk positioning at FP and having a variable throwing shoulder horizontal abduction at MER having lower miss distances.
Having consistent trunk positioning at FP also tracks. In general, FP can be seen as the last place of stability before the throw enters its main rotational phase, so it makes sense that having a consistent “firing point” limits the need for adjustments or compensations later in the delivery. This concept has already been shown earlier in our analysis, thinking back to the angle of torso lateral tilt that had a significant standard deviation on its own and the need for consistency at FP in the dampening scores look at PKH → FP.
Consistent trunk positions at FP with adjustability in scap retraction has a strong relationship to miss distance. This suggests scap retraction serves as a “clean up” point, where potential inconsistencies between FP and MER are compensated for.
Again, we see that the actual angle of the shoulder horizontal abduction at MER doesn’t have much of a relationship to miss distance.
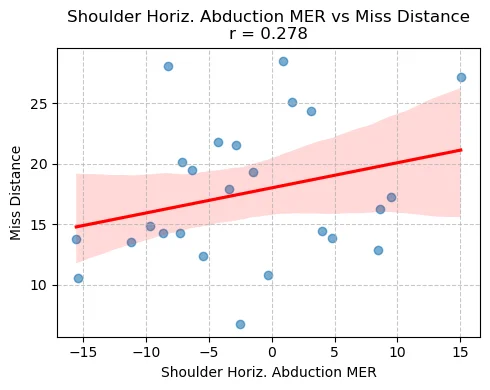
The standard deviation of this horizontal abduction has a stronger correlation to miss distance
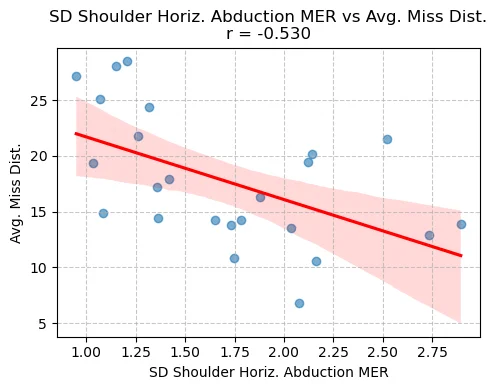
But again, putting these standard deviations in the context of what happened – and when – made this relationship to miss distance significantly stronger.
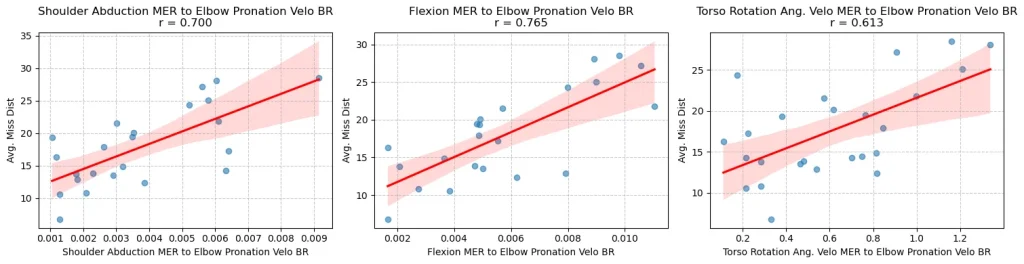
Max External Rotation to Ball Release
This phase was very similar to FP to MER. There are 3 significant features and they are all “Funnel Out” features. In general, we see that having more consistent upper body kinematics to start, and then having a more variable rate of pronation at ball release, correlates to having a low miss distance on average.
It makes a lot of sense that rate of pronation at BR should be variable. Pronation at BR is what determines the spin and approach angle of the pitch, which obviously would have a direct impact on the location of the pitch. Depending on the prior positions of the throw, the windows during which pronation occurs will be different lengths.
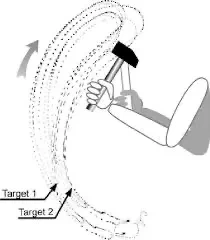
The “Driveline” phase of the throw – the namesake of the company coined by Dr. Mike Marshall – can be thought of as the unravelling of the arm from MER into BR in the direction of the target (the red line in the gif). Mike Marshall thought that maximizing the length of this driveline phase was essential for safely building velocity. This is also the exact window in which pronation into ball release occurs.
The rate of pronation into BR should be variable depending on the length of the driveline phase of the throw, so that “correct” positions can be achieved by release. Having consistent upper body kinematics at MER minimizes the need for adjustment at BR, and likely keeps the necessary adjustment within reasonable ranges.
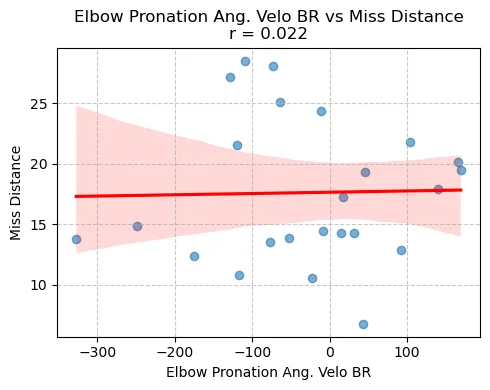
Again we see that the rate of pronation on average does not relate to miss distance.
And although the standard deviation of this rate of pronation had a much stronger relationship, suggesting variability is ideal for limiting miss distance.
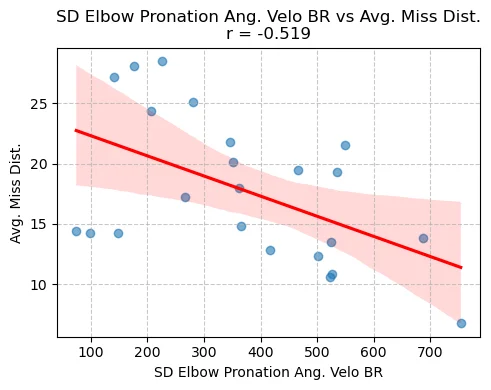
We again see putting this standard deviation in context with the prior positions and prior levels of the kinetic chain drastically improves the quality of the signal.
Conclusion
So, after all that, does repeatability matter? Yes… but it doesn’t nearly paint the whole picture.
Perfect repeatability of a pitching delivery is still an impossible goal. While we want the outcome of this delivery to be as repeatable as possible, variability in the throw is inevitable. We still want to minimize variance in certain ways.
Overall, we see that it pays to have lower variability at foot plant specifically. This can be thought of as the “setup” of the “shot”. The main mechanism of the throw is rotation, which usually begins as foot plant is occurring and sending energy up the kinetic chain, so it makes sense that one would want to be less variable at the “start” so as to minimize the amount of variation that will need to get compensated for.
We’ve also found multiple key “clean up” points, where having higher variance signals having better command. Specifically, we see that it pays to show higher variability in the main throwing arm movements that occur just prior to key points in the arm action. Shoulder horizontal abduction is usually one of the last things the arm does before reaching max external rotation, and pronation of the elbow and wrist are usually the last things that happen at the arm during ball release. Having high variance this shoulder horizontal abduction and rate of pronation were seen to signal good command.
It is well known that the hardest throwers are the best self-organizers. These players have elite proprioception, allowing them to compensate in ways that will consistently make the most of their current physiological state and current level of fatigue. While it makes sense that this holds true for command – the guys with the best control are the guys with the best “feel” – we now have a better understanding how the best will adjust to realign with this “feel”.
Next Steps
This study was still a necessary and significant first step towards our ultimate goal of making better pitchers. While we have begun to isolate and measure the things that seem to contribute to having good command, we still need to find a way to provide an external focus and stimulus to the athlete beyond saying “just hit your spot”.
No hard scientific articles backing any specific training methodology may exist yet, but there is now a much clearer and more intuitive standard for coaches to design training around. For example, implementing differential learning techniques could likely force adaptations in a pitcher’s ability to adjust throughout his delivery. Our command training balls of varying size and weight fit this bill perfectly, and we plan to investigate further how these command training balls might be able to quantifiably drive favorable adaptations.
We also plan on increasing the scope of our analysis in further investigations. Looking at full time series data, as well as joint forces and energetics, is at the top of the list. Additionally, we plan to test these command training balls against what we’ve found so far.
But most important, we will continue to refine and distill our interpretations of these findings into something our trainers can confidently use to help our athletes. Whether in the form of a tool or a drill, we hope to find some type of constraint we can implement into training that is proven to drive the adaptations we have found to be important.
And in doing this, we hope to, once again, revolutionize the way pitchers train.
Comment section