Optimizing Bat Paths
Every year new metrics are being made available to the public through Statcast. In the latest drop batting metrics were highlighted to give more insight into how a batter’s swing and stance line up at the point of contact. These new features give context beyond the original exit velocity and launch angle stats that hitters are accustomed to looking at. These features provide essential context into explaining how the batter’s swing created those batted ball results.
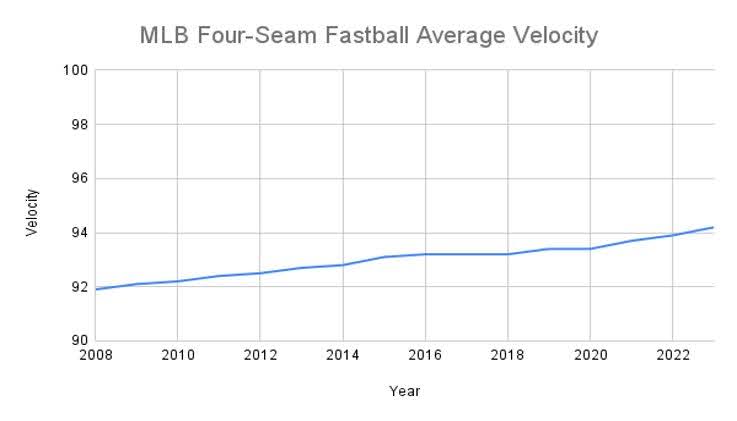
As we have noticed across many facets in training is that once something gets measured, we are able to change how it impacts how we train. The most notable instance of this is the climb for velocity in pitching since 2008 when pitch velocity began to get measured
At Driveline we have been collecting this type of swing path data for a long time to help improve our athletes. We do lots of work training batters, and we are confident in being able to make bat speed gains and path adjustments that maximize the player’s production.
Determining what adjustments are necessary is the hardest and most important piece of this puzzle. Unfortunately, this is a labor intensive process, and we are limited to the data we collect from athletes coming into the gym. Oftentimes players could only be in a few weeks at a time, and then stretches of months before we will see them swing in our lab again. Statcast now provides continuous swing data throughout each season dating back from the 2023 All-Star break, leaving us with more clean and extensive datasets than we had previously had. To expand this dataset even further for this project, we split the seasons into season halves that were divided at the all-star break. This left us with 2023 second half, 2024 both halves, and 2025 first half.
In this study the swing metrics I am referring to are bat speed, swing length, attack angles (vertical and horizontal), swing path tilt, and depth of contact. These new metrics are largely important at understanding how the bat is positioned at contact.
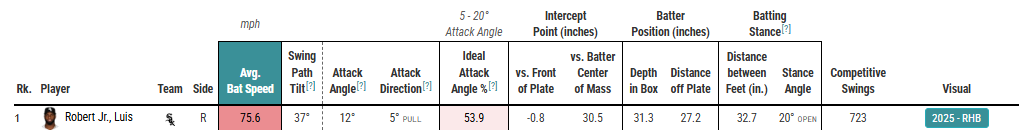
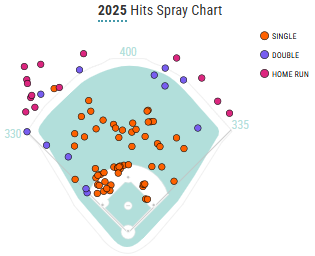
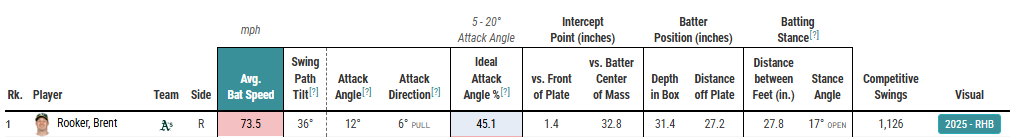
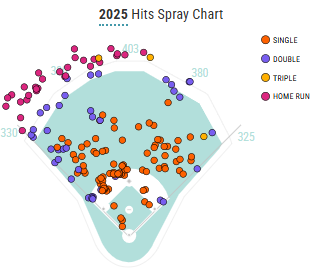
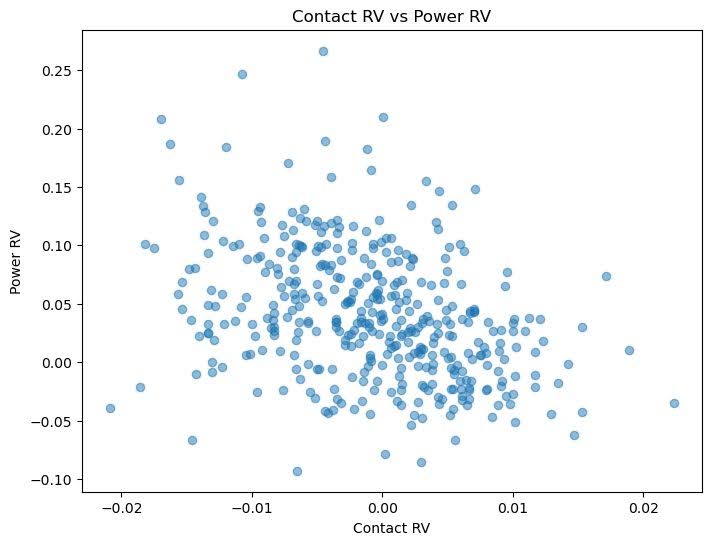
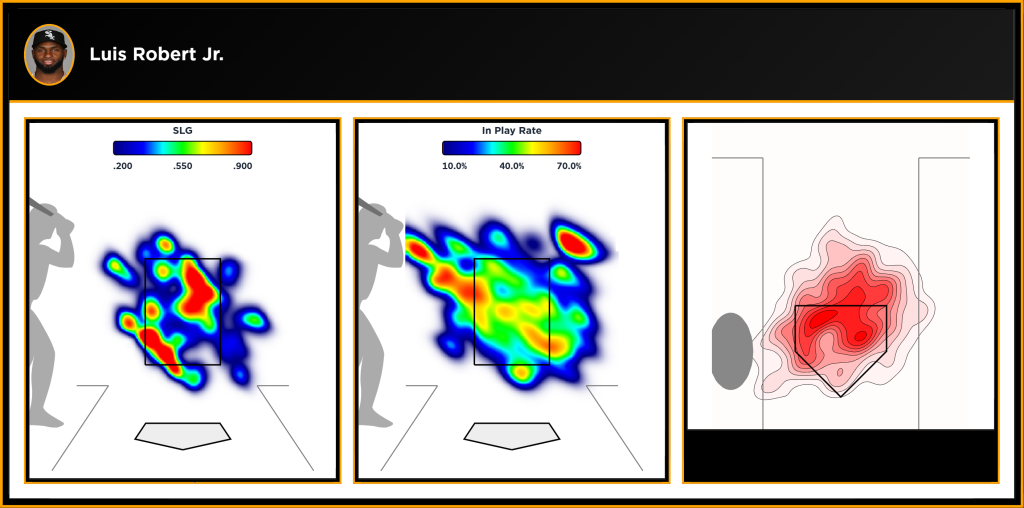
What this data is missing is how the batter got into this situation in the first place. Batters can have extremely similar average metrics in their swings at contact, but have different results in their batted ball profile based on how they are getting to that point. Here’s an example of two hitters with similar bat speed, tilt, attack direction, and attack angle on average, yet very different results on the field. Luis Robert Jr. and Brent Rooker both have similar swing profiles at contact, but their spray charts tell a different story.
As good as these metrics are from statcast, we needed to do more to paint the whole picture. Throughout this reading, we will be taking you through our steps to building our swing path “optimizer”. We will cover the reconstruction of the full signal bat path, optimizing with feasibility constraints, real world examples, and our findings.
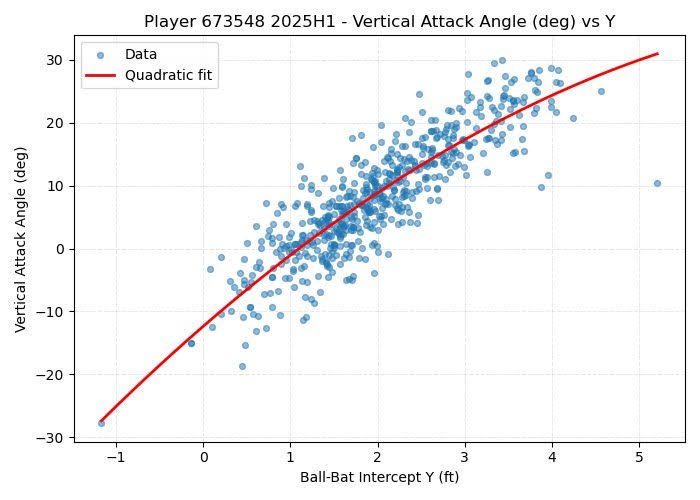
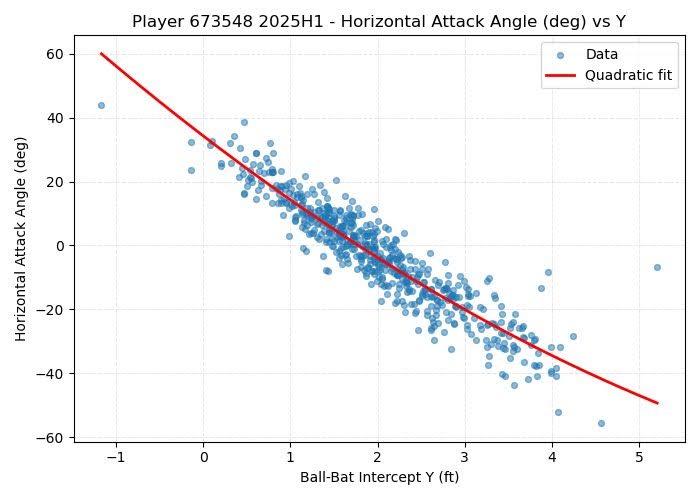
Since all the data is at contact, we are able to model the relationships of the attack angles and the depth of contact in the Y direction (from home plate to the mound). By using contact points to represent the barrel’s position, and attack angles as the direction of the barrel’s velocity, we are able to generate a proxy for full signal bat paths.
Bat path reconstruction
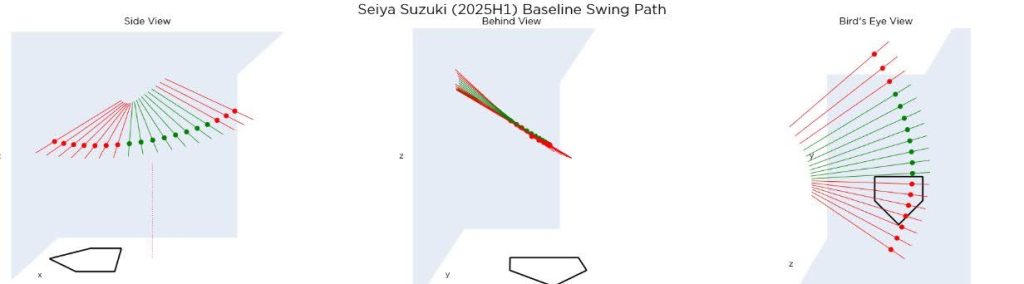
We sample 18 points evenly along the path to generate a 3D bat path reconstruction. This bat path keeps the bat speed and swing path tilt constant through the entire swing. For training purposes we broke down the 18 points into 3 sets of 6 where the first set is “Down Swing”, the second set is “Contact Zone”, and the final set is “Follow Through”. These names are strictly for categorization and interpretability rather than actually being meaningful sets for our analysis.
Over the offseason we rebuilt our models to be component based. In doing so, we are able to attribute run value to specific events in every pitch and the probabilities that each of these events occurs. These models allow us to estimate the value of any swing.
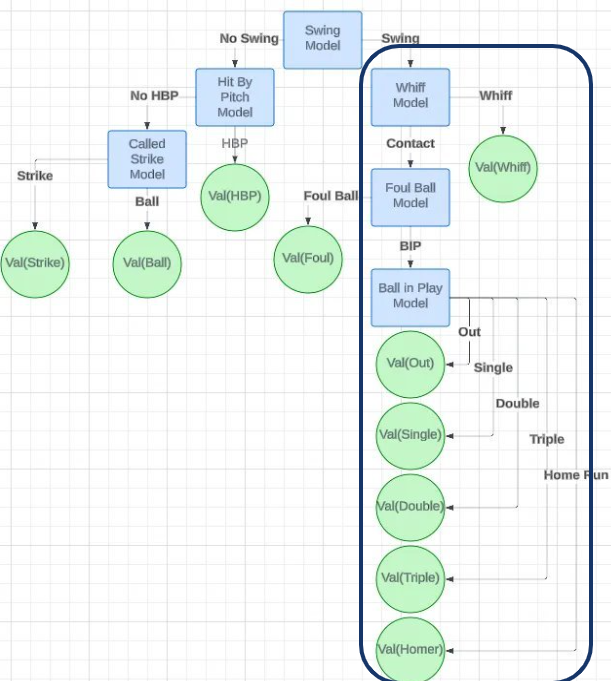
At Driveline we have a “Big 3” set of skills for hitting evaluation that consists of swing decisions, contact, and power. For this project, we will be looking at the batter’s contact and power abilities. In particular, we are looking at the tradeoff of power and contact. As a batter swings harder and for more power, that often comes as a sacrifice to their ability to make contact. It is worth nothing that the run value for the power model completely dwarfs the contact model. This is because adding power is far more valuable than adding contact, because extra base hits generate more runs than just being able to put a ball in play. Additionally, contact can be substituted for the probability of a ball in play that will help us later in the project.
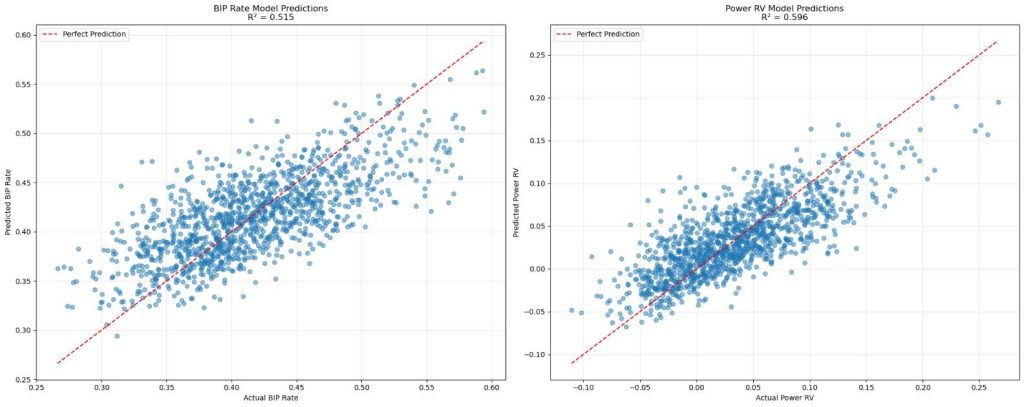
Once the bat path is reconstructed, we can use the set of 18 points in space as our feature inputs to our models. We used power and ball in play rate as our target variables. Both models are Ordinary Least Squares (OLS) models with quadratic polynomial features. Adding a squared term to our simple linear model helps the model pull extreme predictions back toward typical values. For example, extreme attack angles in both the positive and negative directions are likely not ideal, so the model needs to be able to understand that more (or less) is not always better. The models had an R2 of 0.515 and 0.596 for BIP and power respectively. We tried some other modeling types, but these linear models explained a similar amount of variance, and maintained their interpretability better than other models. As a training facility, we value the ability for our models to be explainable. We would rather sacrifice a small amount of predictability to keep the model fast, and easy to understand.
Optimization function and population level constraint
With these two models we were able to construct an objective function to maximize over our two outcomes to get a total run value. We hold the value of a foul or whiff as a constant run value that is the average value of a foul or whiff. Swapping contact for BIP builds a clear BIP vs ~BIP outcome scale.
Objective = P(BIP) vBIP +P(~BIP) * v~BIP
We seek to maximize the objective where BIP = ball in play event, vBIP = Power RV, and v~BIP is a constant of the average value of a foul or whiff.
Optimizing over these characteristics is great in concept, but constraints need to be applied to ensure we are not coming to the same conclusion for every swing. There were 2 constraints we applied to keep the output realistic. We applied a league wide constraint and a player level constraint.
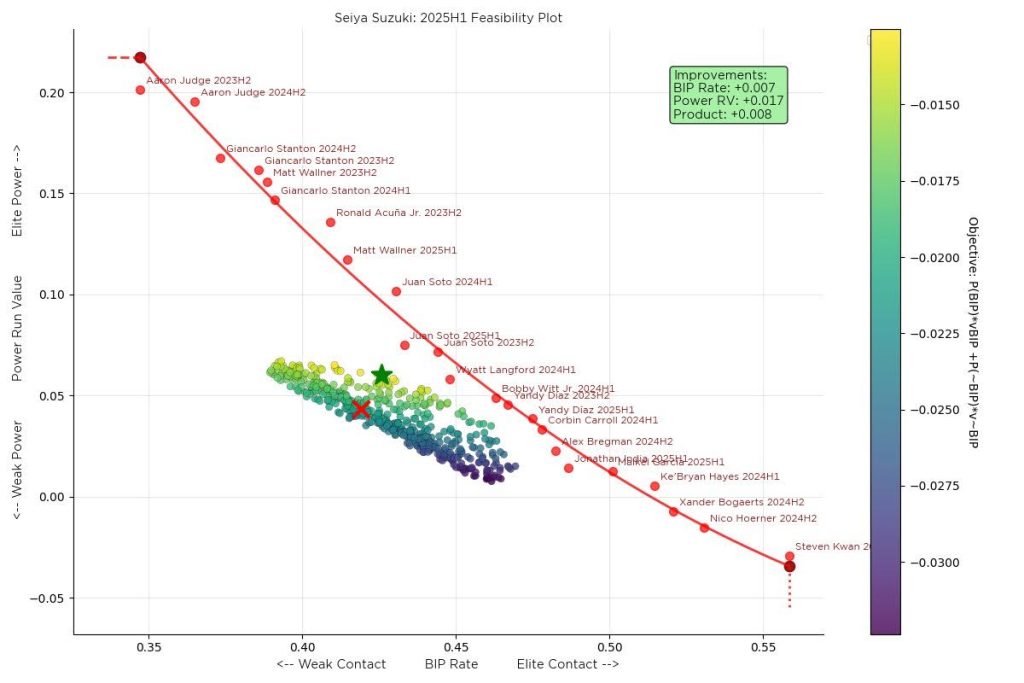
Starting with the league level constraint. We will not be recommending changes that would put anyone beyond the bounds of what our model has seen in previous seasons. For example, we would not recommend anyone exceed Judge’s power from the second half of 2025. To constrain this we created a pareto frontier to visualize the tradeoff between power and contact and plotted everyone who sits at the top boundaries of any efficient solution. This works because we have a multi-objective optimization problem that incurs a trade off between power and the probability of a ball in play.
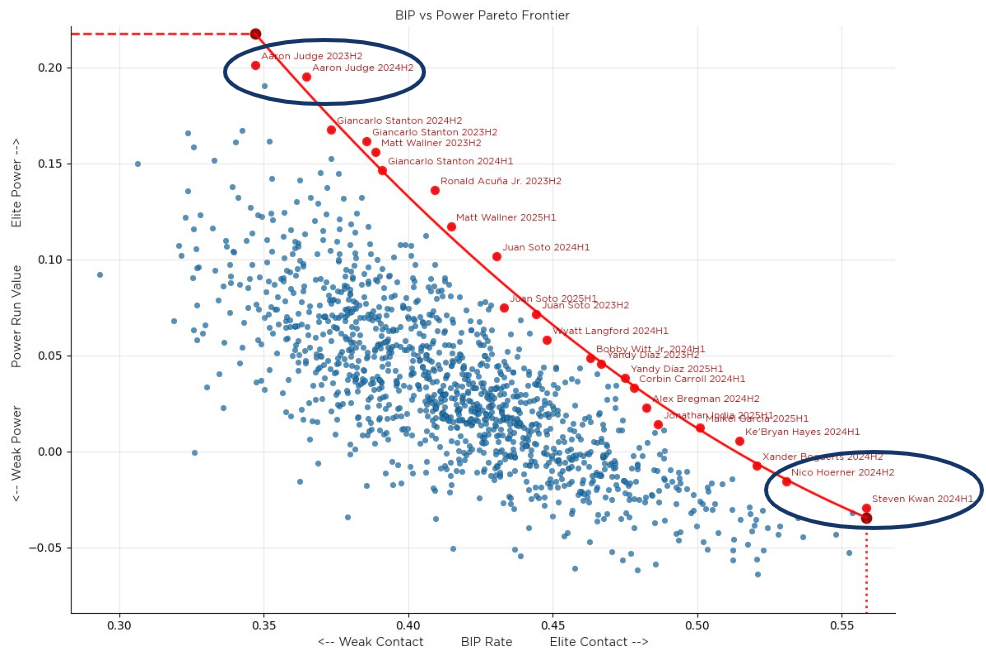
A population constraint keeps everything grounded with what had been done in the past, but we still need to apply a player level constraint. Without a player level constraint our model would be suggesting every hitter should swing with the power of Aaron Judge, or to put the ball in play as much as Steven Kwan. This is where our feasibility within players comes into play.
Player level constraint
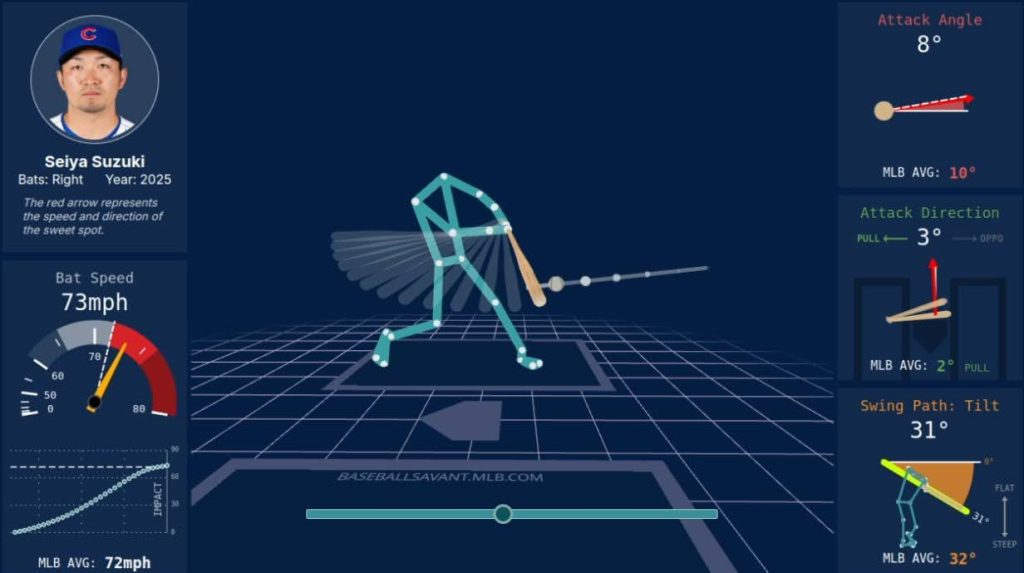
We constructed a dataset we call the “Offseason Changes” dataset that describes the changes a player made from any one season half to the next season half. For example we would have a set that represents Seiya Suzuki 2024 second half and Seiya Suzuki 2025 first half, and the difference between these sets is what we used for defining how we have seen players change. To be included in this dataset, the batter must have a minimum of 180 swings per half season. This is based on our minimum reliability sample to be comfortable to include the batter in this analysis derived from Cronbach’s alpha.
From our original dataset of bat path features, we are able to apply KNN to find N batters that have similar swings to the batter in question. KNN or K-Nearest Neighbors is a supervised machine learning clustering algorithm that finds the closest batters based on their swing metrics. For the purpose of this study, we look at the 15 closest swings based on the first half of data. Using the example above, we found players in our “Offseason Changes” dataset whose baseline set of swing metrics was most similar to Seiya Suzuki in the second half of 2024.
We then construct a multivariate normal distribution using the sample of the offseason changes from the nearest neighbors we identified. Making changes to a player’s swing can vary in difficulty depending on what is being changed and what the player’s swing initially looks like. Training an athlete to change attack angles is much easier than changing swing path tilt, and relatively low or high attack angles are the easiest to change on average. This is the relationship we attempt to capture by using a KNN sample on the offseason changes custom dataset.
It’s also true that these features must change together, especially given how closely related the 18 swing path points must be. This is why we used a multivariate normal distribution to model this sample, as it can properly describe how changes across metrics are dependent on one another. This is shown below in the joint distribution of observed changes in horizontal attack angle at two consecutive path points over an offseason for the 15 players most similar to Seiya Suzuki 2024 H2.
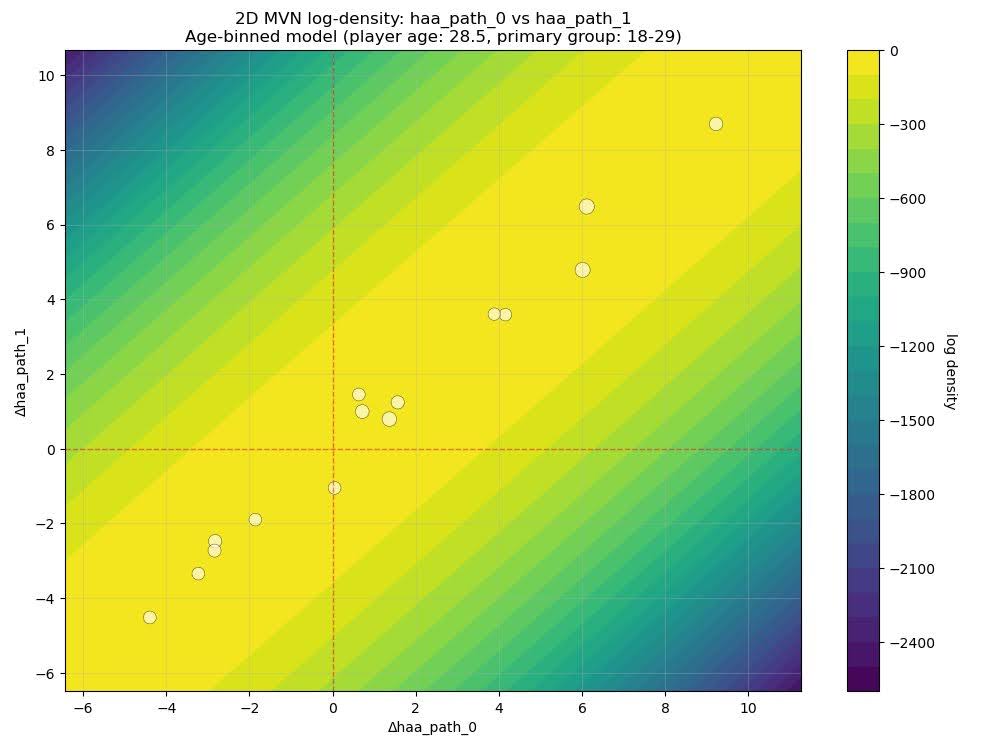
Multi-variate normal plot of Seiya Suzuki’s first two horizontal attack angle points
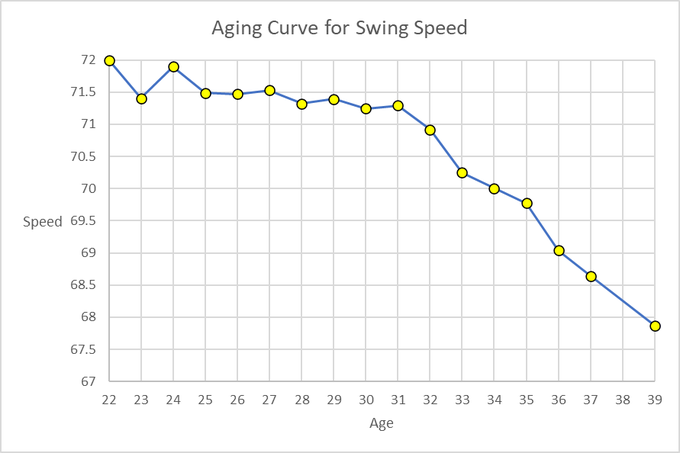
Age also plays a large factor in the “malleability” of a batter’s swing. It is known that as a player gets older, his bat speed begins to decline drastically. Because of this, it is important that age is included in the KNN portion of our analysis. It should not prescribe bat speed gains to a 40 year old player, as this player likely cannot truly gain bat speed but should instead try to not lose bat speed. Age is included as a feature in our initial KNN clustering, and is also used to “bin” this KNN model to only sample players within similar age brackets to the player in question.
Applying everything at once
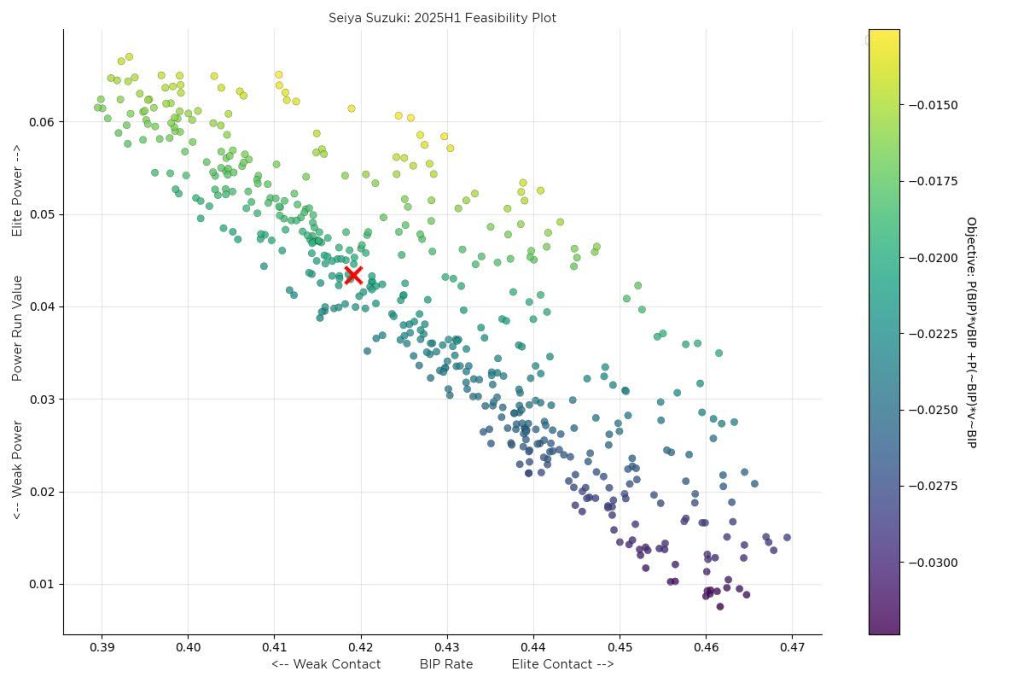
Putting all of this together, we can use the multivariate normal distribution to define a likelihood or “feasibility” value to any given set of swing changes to Seiya Suzuki’s second half of 2024. Because of the elliptical nature of the multivariate normal distribution, we can follow a contour of this distribution to get a sample of changes that are on the 90th percentile of achievable feasibility. We can then apply all of these sampled changes to Seiya Suzuki’s original swing, run each of these potential final swings through our power and BIP models, and then overlay the pareto frontier from our league level constraint to get a complete picture.
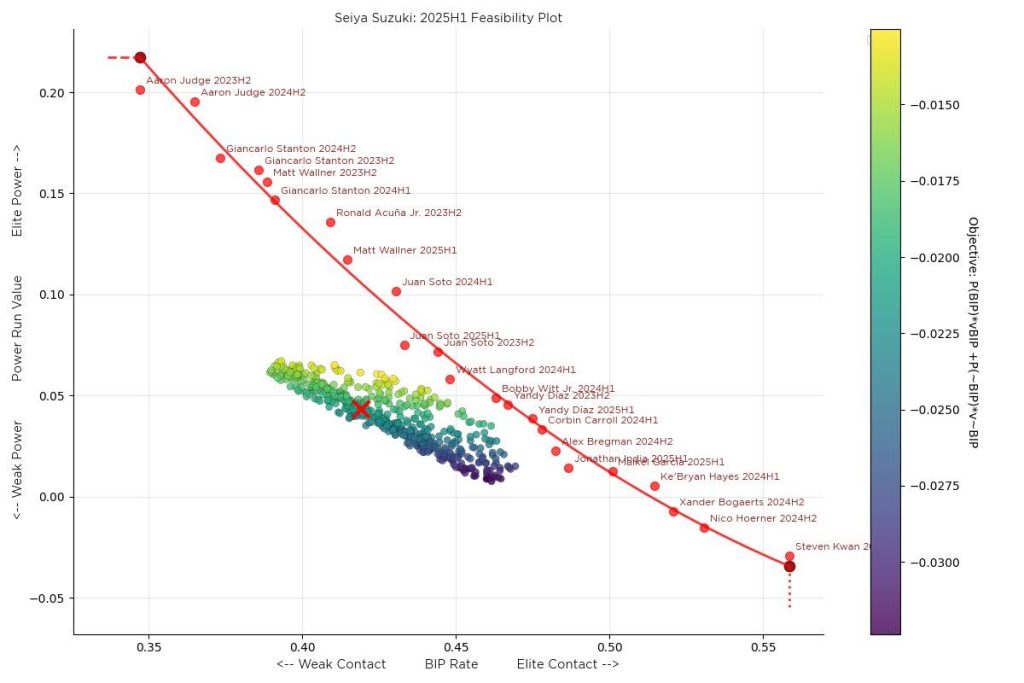
Each point on the contour is a different potential outcome of the same player. Taking the 90th percentile contour of what we have seen allows us to view possible ways the player could change in the offseason within reason. Using the frontier bounds of our population constraint, we can rule out any changes that are feasible at a player level, but would surpass the contact/power tradeoff that has been previously seen.
With our objective function, we can assign a run value to every possible point along the contour to find the swing change that would deliver the greatest change in run value. The best possible outcome would be changes that allow the batter to improve in their power and ball in play rate and maximize their run value.
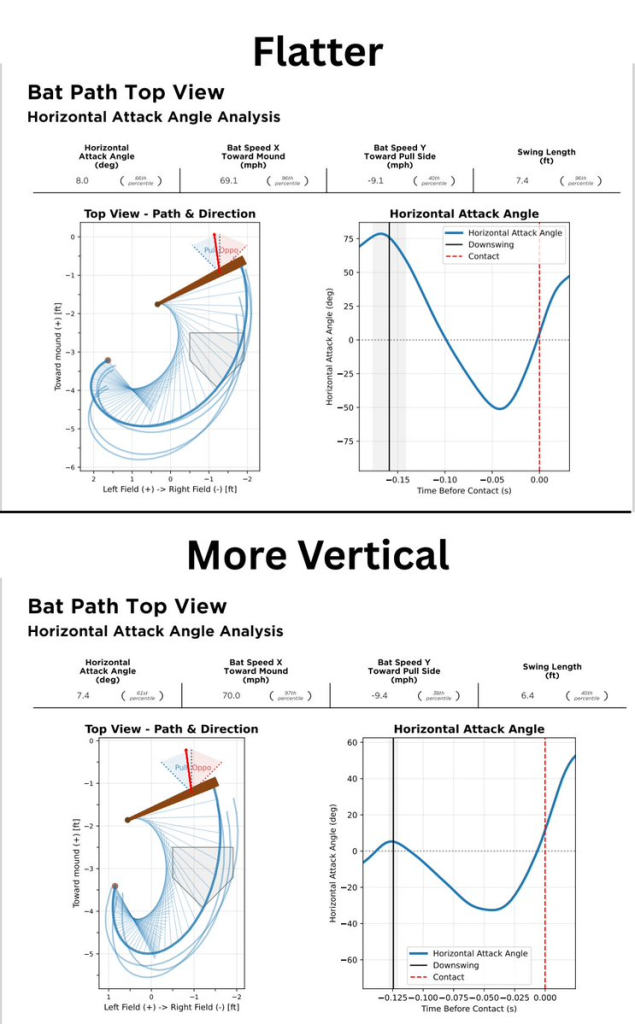
Once we have located the optimal suggested changes, we can take the suggested changes in bat path features from the coefficients of the model to see what is being recommended at each of our three stages of the swing. We can also overlay the original bat path and the optimal bat path to visualize these recommendations.
We can interpret these changes into insights for our trainers, and have our trainers look up batters that they are familiar with. Our model often says to get on plane early during down swing and stay on plane throughout the contact zone and follow through. This matches our trainer’s observations and often what they teach. Because of the personalized nature of our model and analysis, two different swings will get two substantially different recommendations.
An example of this is Mookie. Our models believe Mookie should have a slightly steeper VAA through his entire swing, and be more pull side through down swing and the contact zone, but stay more oppo at follow through. This matches what our trainers believe, but also is different than if we were to have batters like James Wood go through our model. Since Mookie doesn’t have elite bat speed, but owns elite bat to ball skills our model accounts for these points and makes only a slight suggestion to Mookie, while other batters would be more extreme.
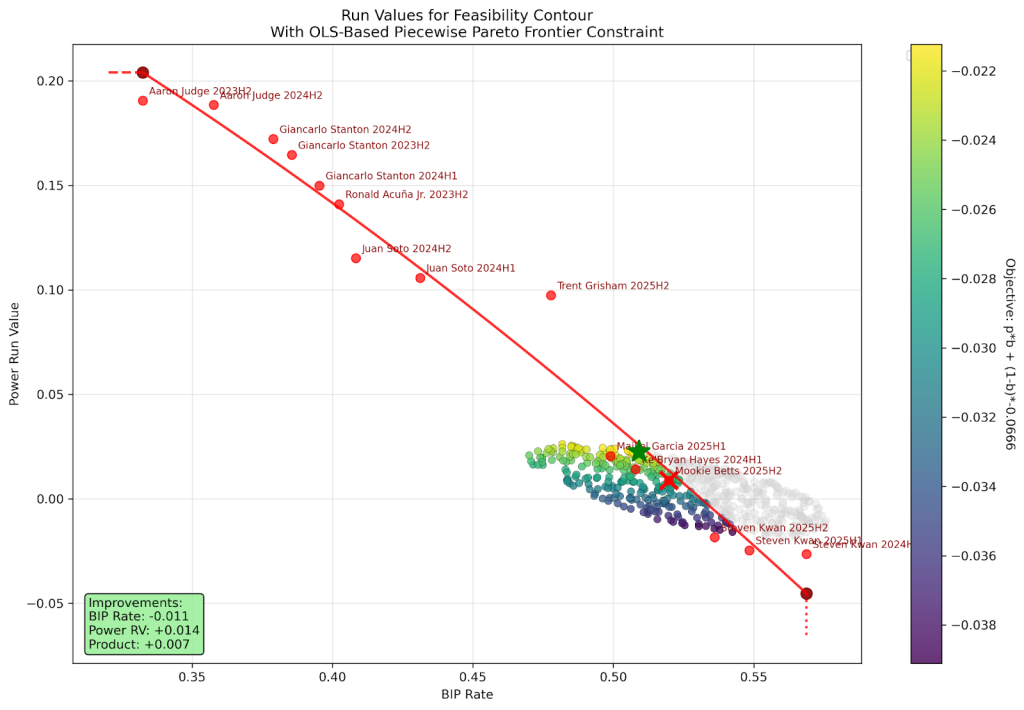
Red X is Mookie Betts’s starting point along with a feasibility contour plotted on the pareto frontier
Optimizing Mookie’s swing path would not be as beneficial as other batters just because improving his contact ability without sufficient power could lead to more non-productive balls in play. Meanwhile, batters like James Wood could stand to gain many more runs by cleaning up their bat path even just a small amount, due to his already elite power profile.
We believe that James Wood VAA needs to be steeper going into down swing and the contact zone, but should be flatter in the follow through. He should also start his swing more oppo and finish more to the pull side. This is different from Mookie’s recommendations, and you can see in the frontier that James Wood stands to gain much more run value through power, while Mookie would be best keeping his elite contact and only slightly adding more power.
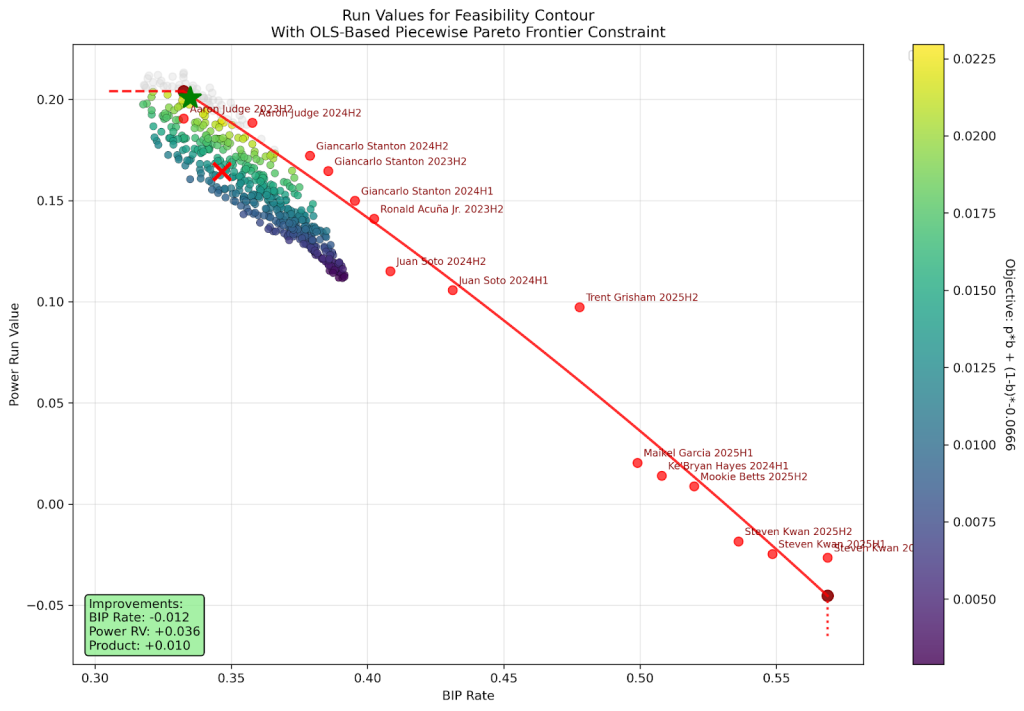
Red X is James Wood’s starting point along with a feasibility contour plotted on the pareto frontier
Training swing path changes
Many people asked us if changing a bat path is possible. They were curious if changes could be made without impacting other aspects of the swing. At Driveline we have been training batters for years, and we are confident in being able to make precise changes that do not take away from a batter’s current profile. Batters at Driveline put on an average of 2mph while training in an offseason. Our model is conservative and will only project small amounts of bat speed gains, typically below 1 mph. This makes us confident in being able to project more bat speed gains than our bat path model.
Ultimately, how we train hitters is entirely dependent on what the batter needs to improve on. The most elite athletes are usually also the most elite compensators. Hitters know what they are good at and what they struggle at. Exposing the weaknesses during a hitting session with specialized drills allows the batters to make necessary changes to adjust their bat path.
Batters with slow bat speed can “cheat” to get their point of contact out in front by pushing with their hands instead of turning with their hips. This can allow the hitter to make contact, but they will be lacking the setup and force from properly sequencing to generate more rotational force behind their batted ball. Aside from just swinging the bat faster, a hitter can do drills that teach them how to get on plane earlier, or stay on plane longer. Offset open and short bats are drills that force the hitter to catch the ball deeper in the zone by adjusting how the batter is standing or the angle of the pitching machine. These are examples of drills used to force the batter to be on plane earlier to still make quality contact deeper in his stance.
There are plenty of other drills our trainers use to expose flaws in the swings. These deficiencies are found through getting an athlete in our motion capture lab and seeing how they are sequencing throughout the entire swing. Through video and highly digestible reports, our trainers are able to peel back the layers of swing into biomechanical deficiencies that are trainable with these specialized drills.
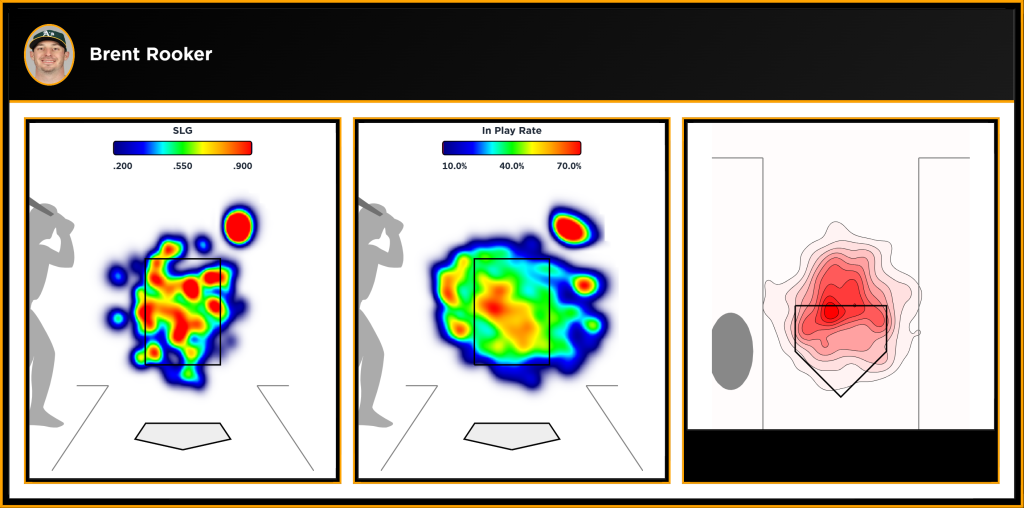
Brent Rooker and Luis Robert have similar metrics at contact, but if you look at charts you can see that Brent Rooker is doing more damage on the balls he puts in play. Roberts is putting balls in play where he is not doing damage, like straight away center field or deep fly balls the other way. Also looking at depth of contact density plots, Roberts is struggling to catch the ball out in front on pitches inside. This can be peeled back much further with bat path and sequencing analysis, describing the HOW each hitter gets to contact, to get an even clearer picture of why the spray charts differ with similar metrics at contact.
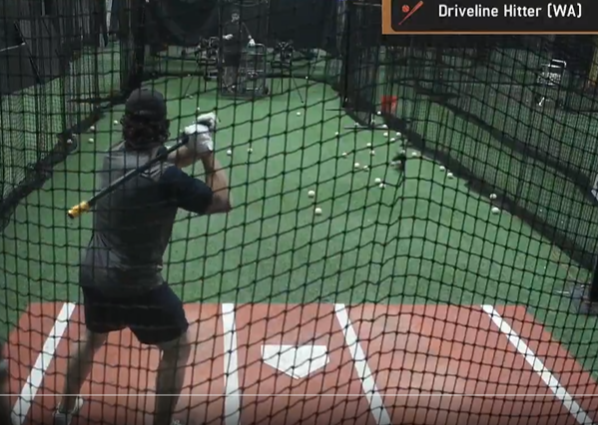
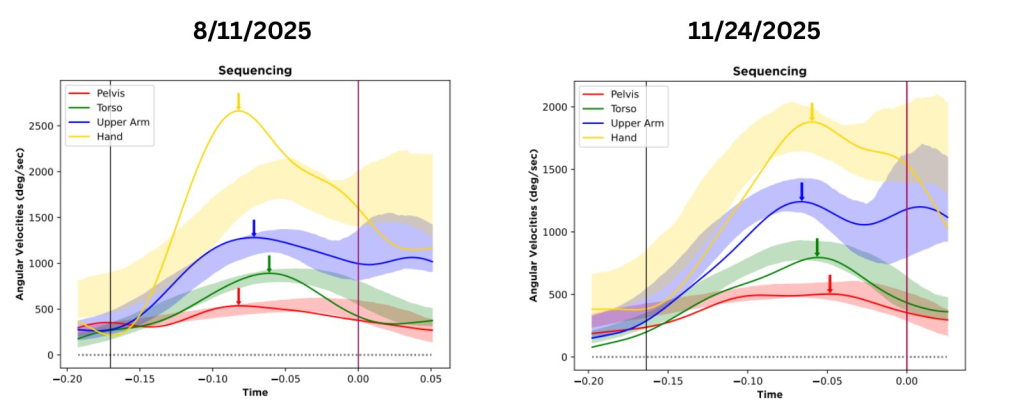
Brent also trains at Driveline, so we are fortunate enough to have his sequencing and bat path reports from our lab. This 2025 offseason, Brent was able to improve upon both of the aforementioned traits while also gaining ~2mph of bat speed. Key focus areas were loading into his back hip and efficiently transferring his weight from rear to lead leg as he went from down swing to contact. The visual below shows the difference in his swing while focusing on the medial to lateral force throughout the swing.
Results and Leaderboards
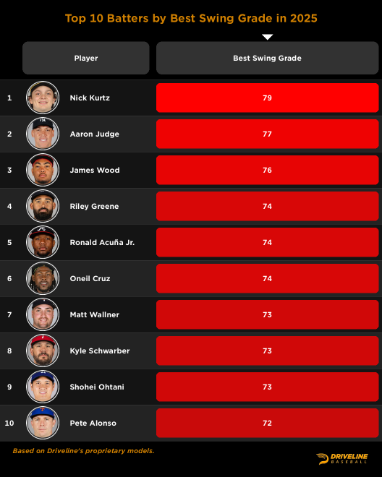
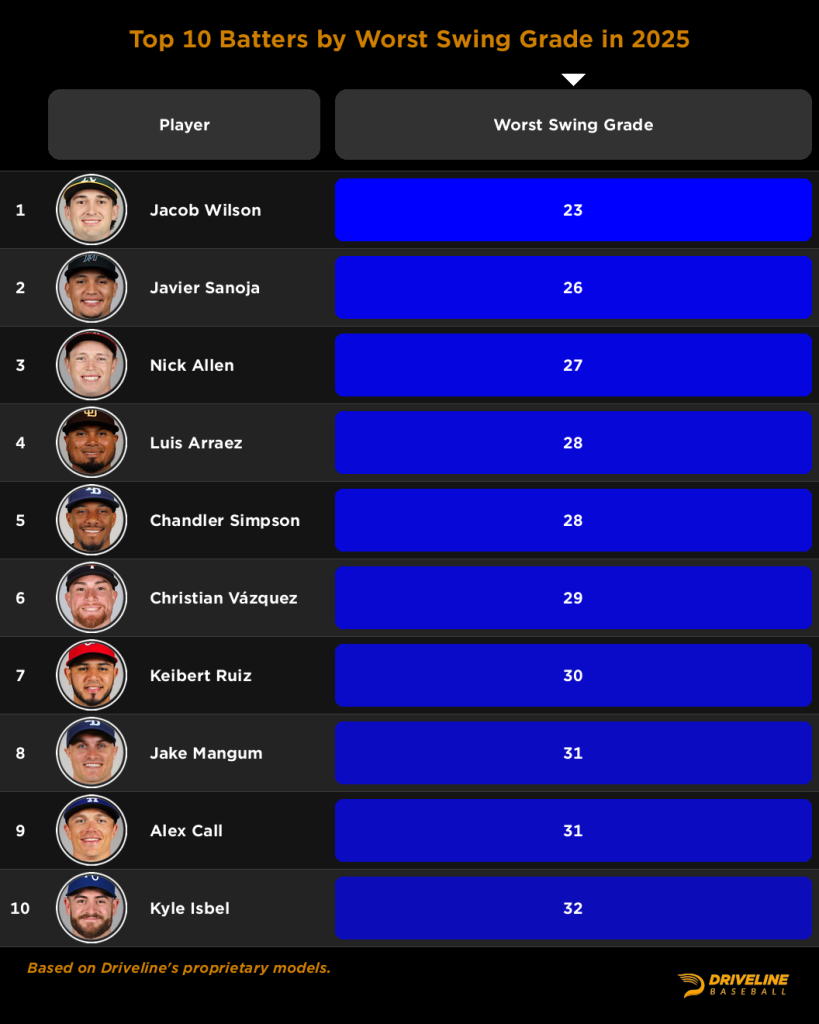
Now that we know this is trainable and we know how to derive insights about the swing, let’s talk about our findings. Running our swing path optimization model over every batter’s actual swing path, we found the best and worst base swing paths. Batters with the best swing path are people you would typically expect at the top of the other stats like xwOBA or SLG, because these batters have fast swings that hit for a lot of extra base hits. On the other side, these batters have elite contact ability. The run value of power dominates the contact run values, so this is not to say contact is not optimal, but it would take a lot more contact to match a single big hit.
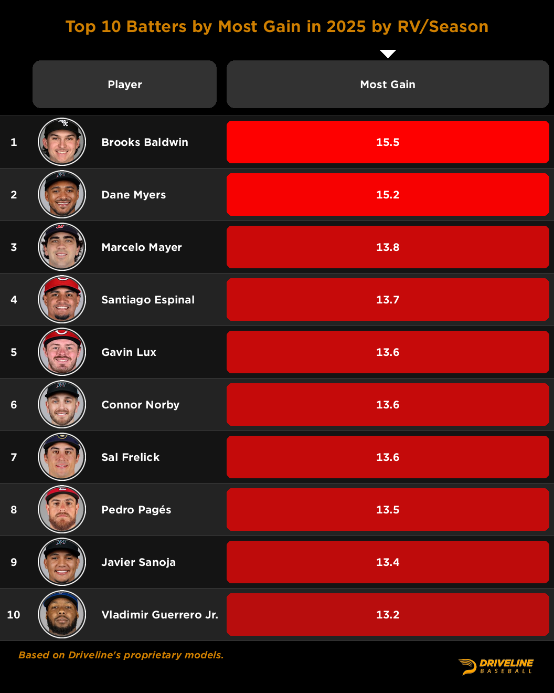
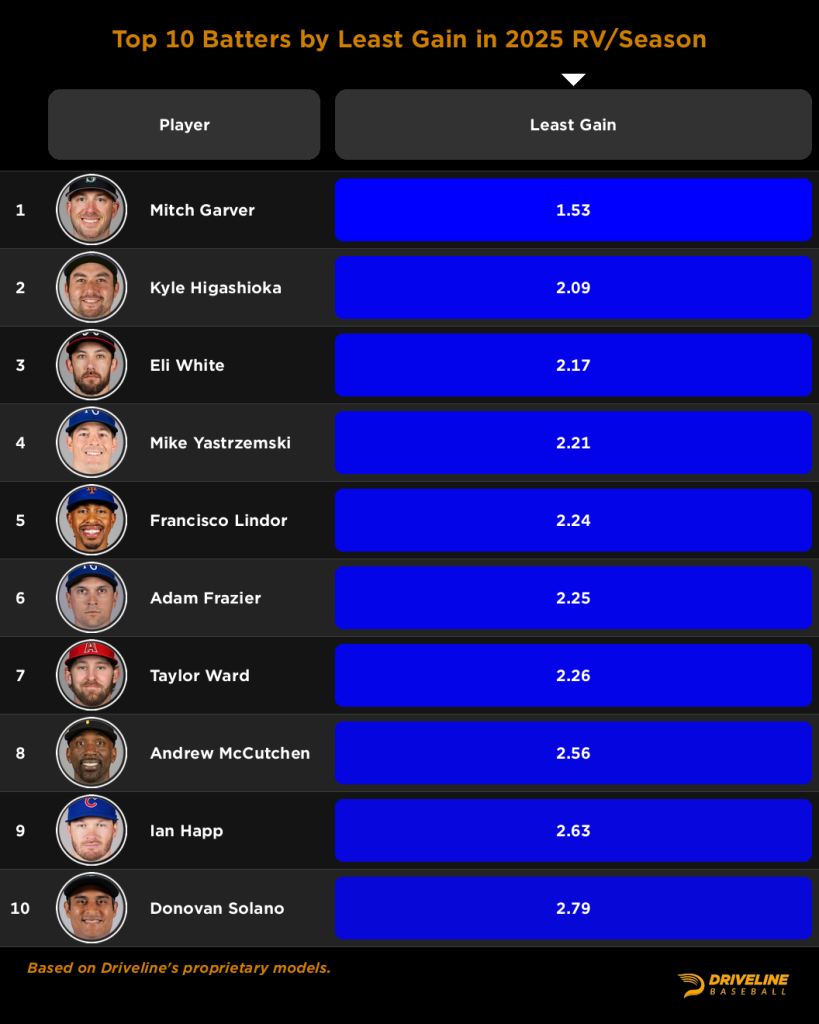
The next thing we looked at was who would stand to gain the most and least from following their recommended optimal swing path recommendations. Our models found that young batters that are able to put on bat speed and change their swing path could stand to gain the most by doing everything our model is suggesting, while the least to gain is typically older players that our model was conservative about the changes they should make.
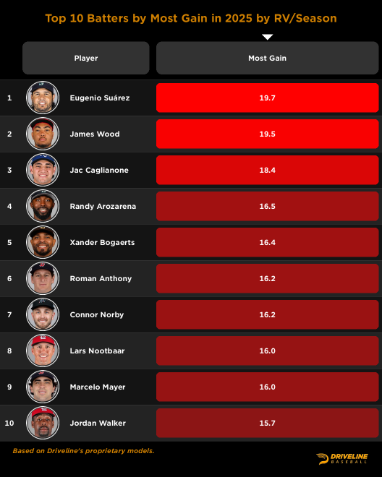
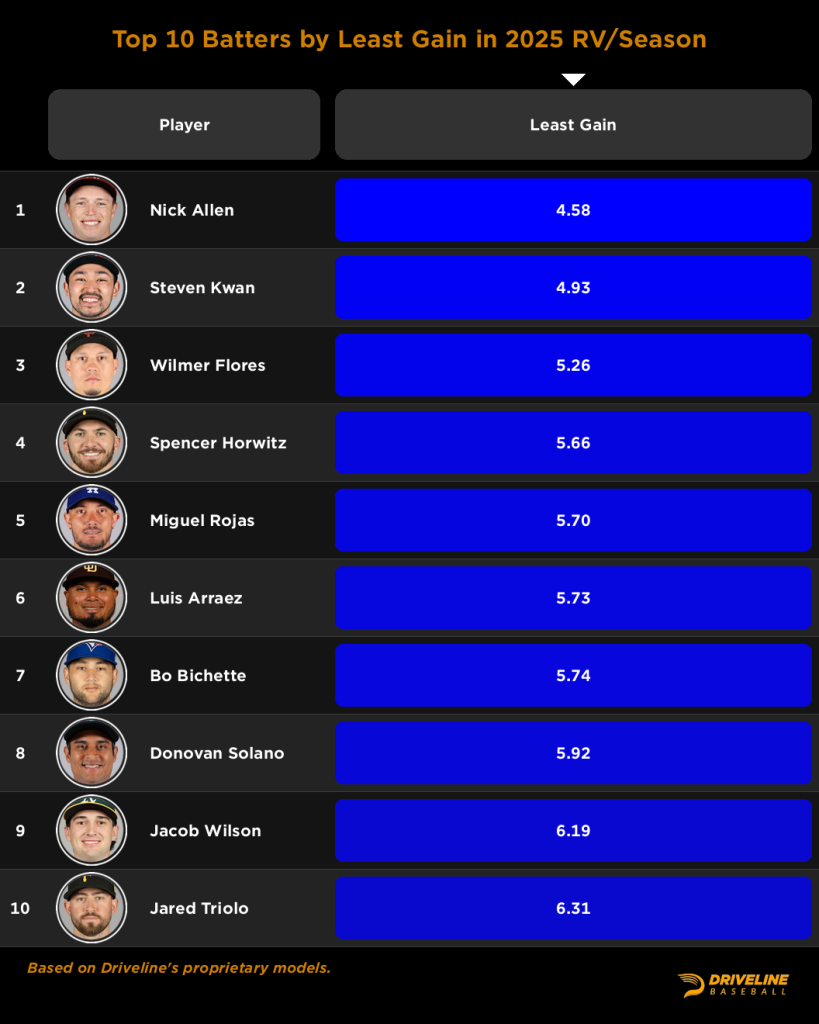
While this first most and least to gain leaderboard is nice, the coolest plot we found was when we kept bat speed constant at their current average bat speed on competitive swings and only looked at the optimal bat path changes the batters could make. Batters like Geno Suarez, James Wood, and Jac Caglianone that have elite bat speed, and extreme swings would stand to gain the most by making slight adjustments to their path. Batters with elite contact like Steven Kwan and Jake Wilson would gain the least by optimizing their bat path and keeping their bat speed the same. These elite contact hitters need to also be able to put on bat speed to see real significant gains when optimizing their path.
While this model sounds enticing, I must caution the reader that all our findings were not all glorious. We understand that there is more to swinging the bat than just the path of the bat. Batting data in itself is very noisy being a reactionary event. We found that our model of optimizing the bat path is confounded by the approach of the batter. Our model makes a general assumption that the batter most often swings like their average swing path. To have a better model we would use two separate models, a swing decision model and a bat path model. This would allow us to marry the two into an overall hitting grade, but this is outside the scope of this project for now. We suggest readers to look into other public research about batter decision making like Stephen Sutton Brown’s Saberseminar presentation on pitch tunneling and the reactionary downstream effects on the batter’s decision making.
Looking into the future for this project, we are seeking to gather a large enough sample to investigate bat paths conditioned by location buckets, and pitch groups. Making these changes would allow us to look at bat path effects on different situations and learn more about the individual batter relative to the population. We understand that a fastball located up and in could have completely different swing characteristics in comparison to a breaking ball down and away.
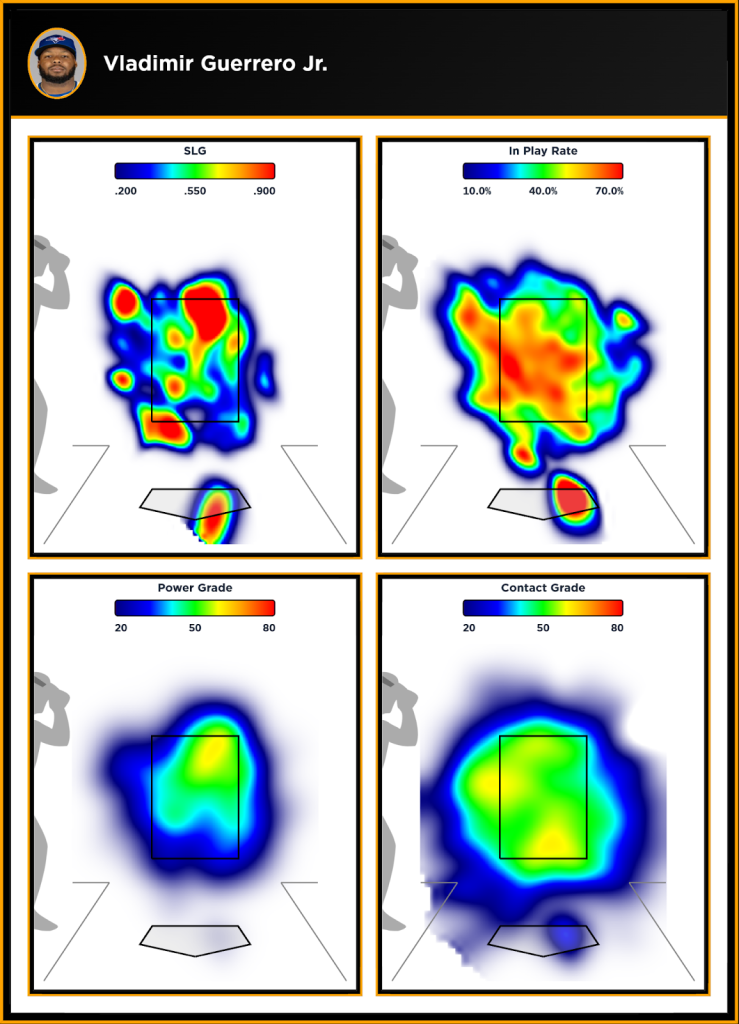
We are also interested in applying this work to data from blast sensors and our motion capture lab to learn more about the sequencing that causes different trends you see in a hitter’s swing path and batted ball profiles. We know Vladi Guerrero Jr. owns an extremely flat bat path and does damage at the top of the zone, but makes a majority of his contact at the bottom and inside part of the zone. Understanding not just the spray chart, or the bat path, but the HOW someone like Vladi is getting into these situations by moving his body. Getting the full picture of his sequencing would allow us to dissect all layers of his batted ball outcomes and work toward training Vladi to have a bat path that can use his already elite talent to get even better production.
That’s all for this writeup. Thanks for reading, and make sure to follow us on twitter (Sam, Conner, Tanner, Travis) if you want to talk more about this project! Check out our presentation slides here.
Comment section