Swing Profile: Introducing Expected Batted Ball Results

Bat sensors play a very important role in our everyday training process here at Driveline. In fact, bat speed specifically is one of the most important metrics we measure. It is one of the hitting department’s KPIs because of its correlation with and symbiotic relationship to exit velocity. Simply put, as a hitter’s bat speed increases, so does the potential for hitting the ball at higher exit velocities, which ultimately leads to more success in the box. Check out some of our previous research on bat speed here.
Foundations of Hitting
30 modules teaching you everything we know about hitting and hitting mechanics.
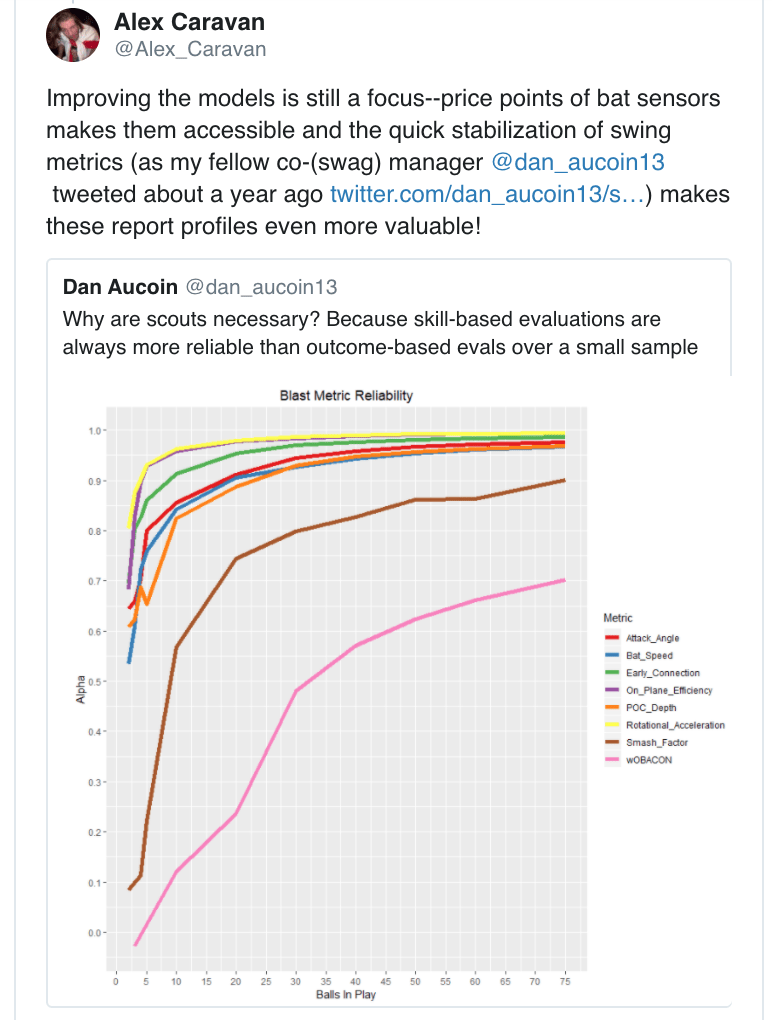
One of the many reasons bat sensor data is so valuable is that it stabilizes rather quickly. This means that we can get a pretty good idea of what is happening in the swing with a relatively small sample of swings compared to what’s necessary for other metrics (for example, exit velocity takes around 30-50 balls in play to stabilize, while wOBA takes several hundred at-bats). For a more technical discussion, look at this Twitter thread from our Managers of Baseball Analytics.
Knowing that bat sensor data is both reliable and often very descriptive of a hitter’s batted ball talent, we decided to build a more powerful report, termed here as Swing Profile, based on *only* swing characteristics—specifically Blast Motion metrics that we have found to be the most impactful to date.
It’s important to note that these averages are all pulled from our internal database of around 450,000 Blast Motion swings logged over the last year, with close to 25,000 of those swings also paired with batted ball data (HitTrax). For a refresher on the previous research and work we’ve done with paired batted ball and swing characteristic data, make sure to check out our blogs here and here.
The Swing Profile report right now reads in Blast Motion data – specifically, it reads in a Blast Connect individual CSV, along with an accompanying date range and returns a seven page PDF, listed below.
Page 1
The first portion of page one compares the player’s averages and other general metrics of interest to the averages of hitters at four different playing levels: Affiliate, Indy, College, and High School. Affiliate hitters are MLB and MiLB players, while Indy is used to classify all other professional non-affiliate hitters; our Indy database includes players from international leagues like the KBO and NPB.
In addition to metrics provided by Blast Motion (defined here), the report also features two new predicted batted ball metrics: Peak Exit Velocity and Launch Angle at Peak Exit Velocity. In this case, we use Peak EV to reference the average EV of an individual’s top eighth hardest hit balls, a proxy for exit velocity that has been used for years by the sabermetric community and has been validated by Driveline’s own findings.
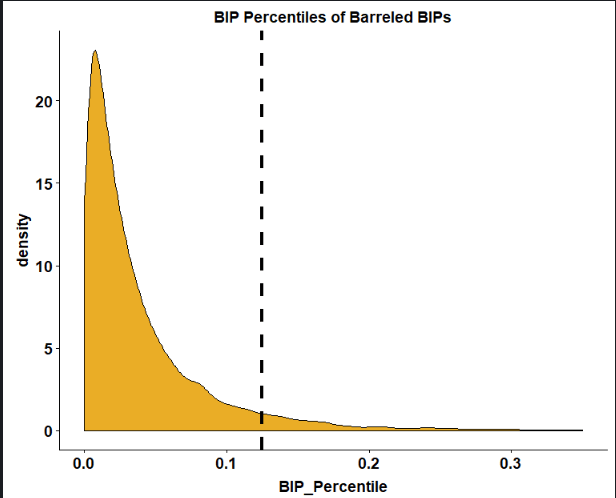
Density plot of Barreled BIPs; everything to the left of the line is in the top eighth of a player’s hardest-hit balls. Barrels here are defined as balls with a smash factor > 1.15.
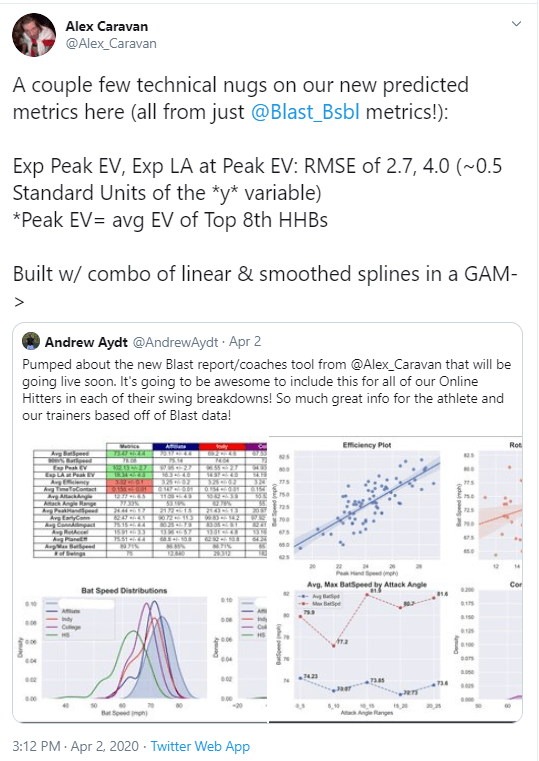
These metrics were built from statistical findings and models based on the aforementioned tens of thousands of paired Blast and HitTrax swings from in-gym hitters. Both Exp Peak EV and Exp LA at Peak EV were built specifically on cross-validated GAMs, or Generalized Additive Models, using qualified hitters’ Blast metrics to predict their batted ball metrics. The RMSE for each model is included in each column of the general tabular data as a +/- proxy of variance to give readers an idea of the accuracy and precision of each estimate.
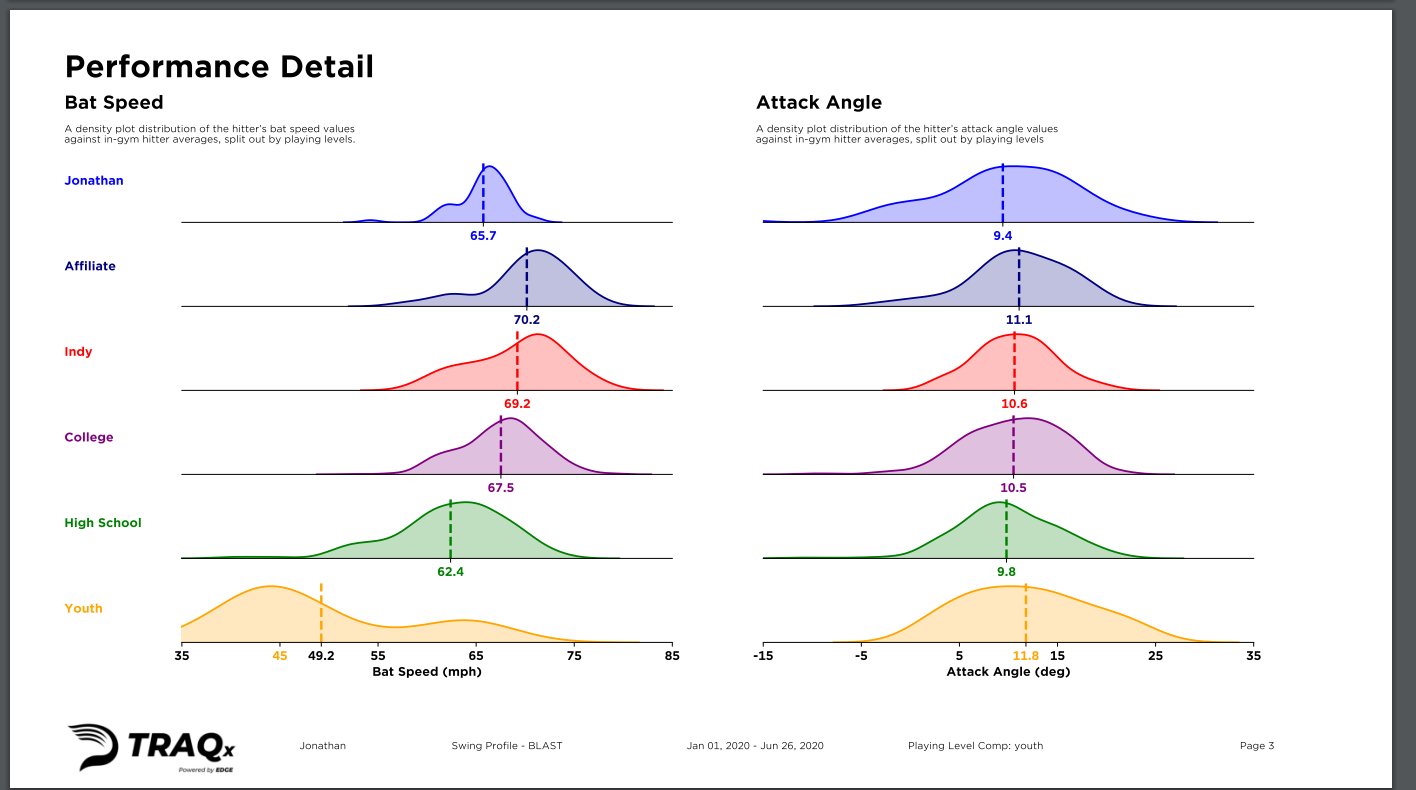
At the bottom of page one, past the tabular data, we have comparisons of density plots for both the bat speeds and attack angles of the player versus our four levels of competition. The density plots show the (smoothed) distribution of each metric, with the y-axis representing the density or proportion of the metric at its specific continuous interval (on the x-axis).
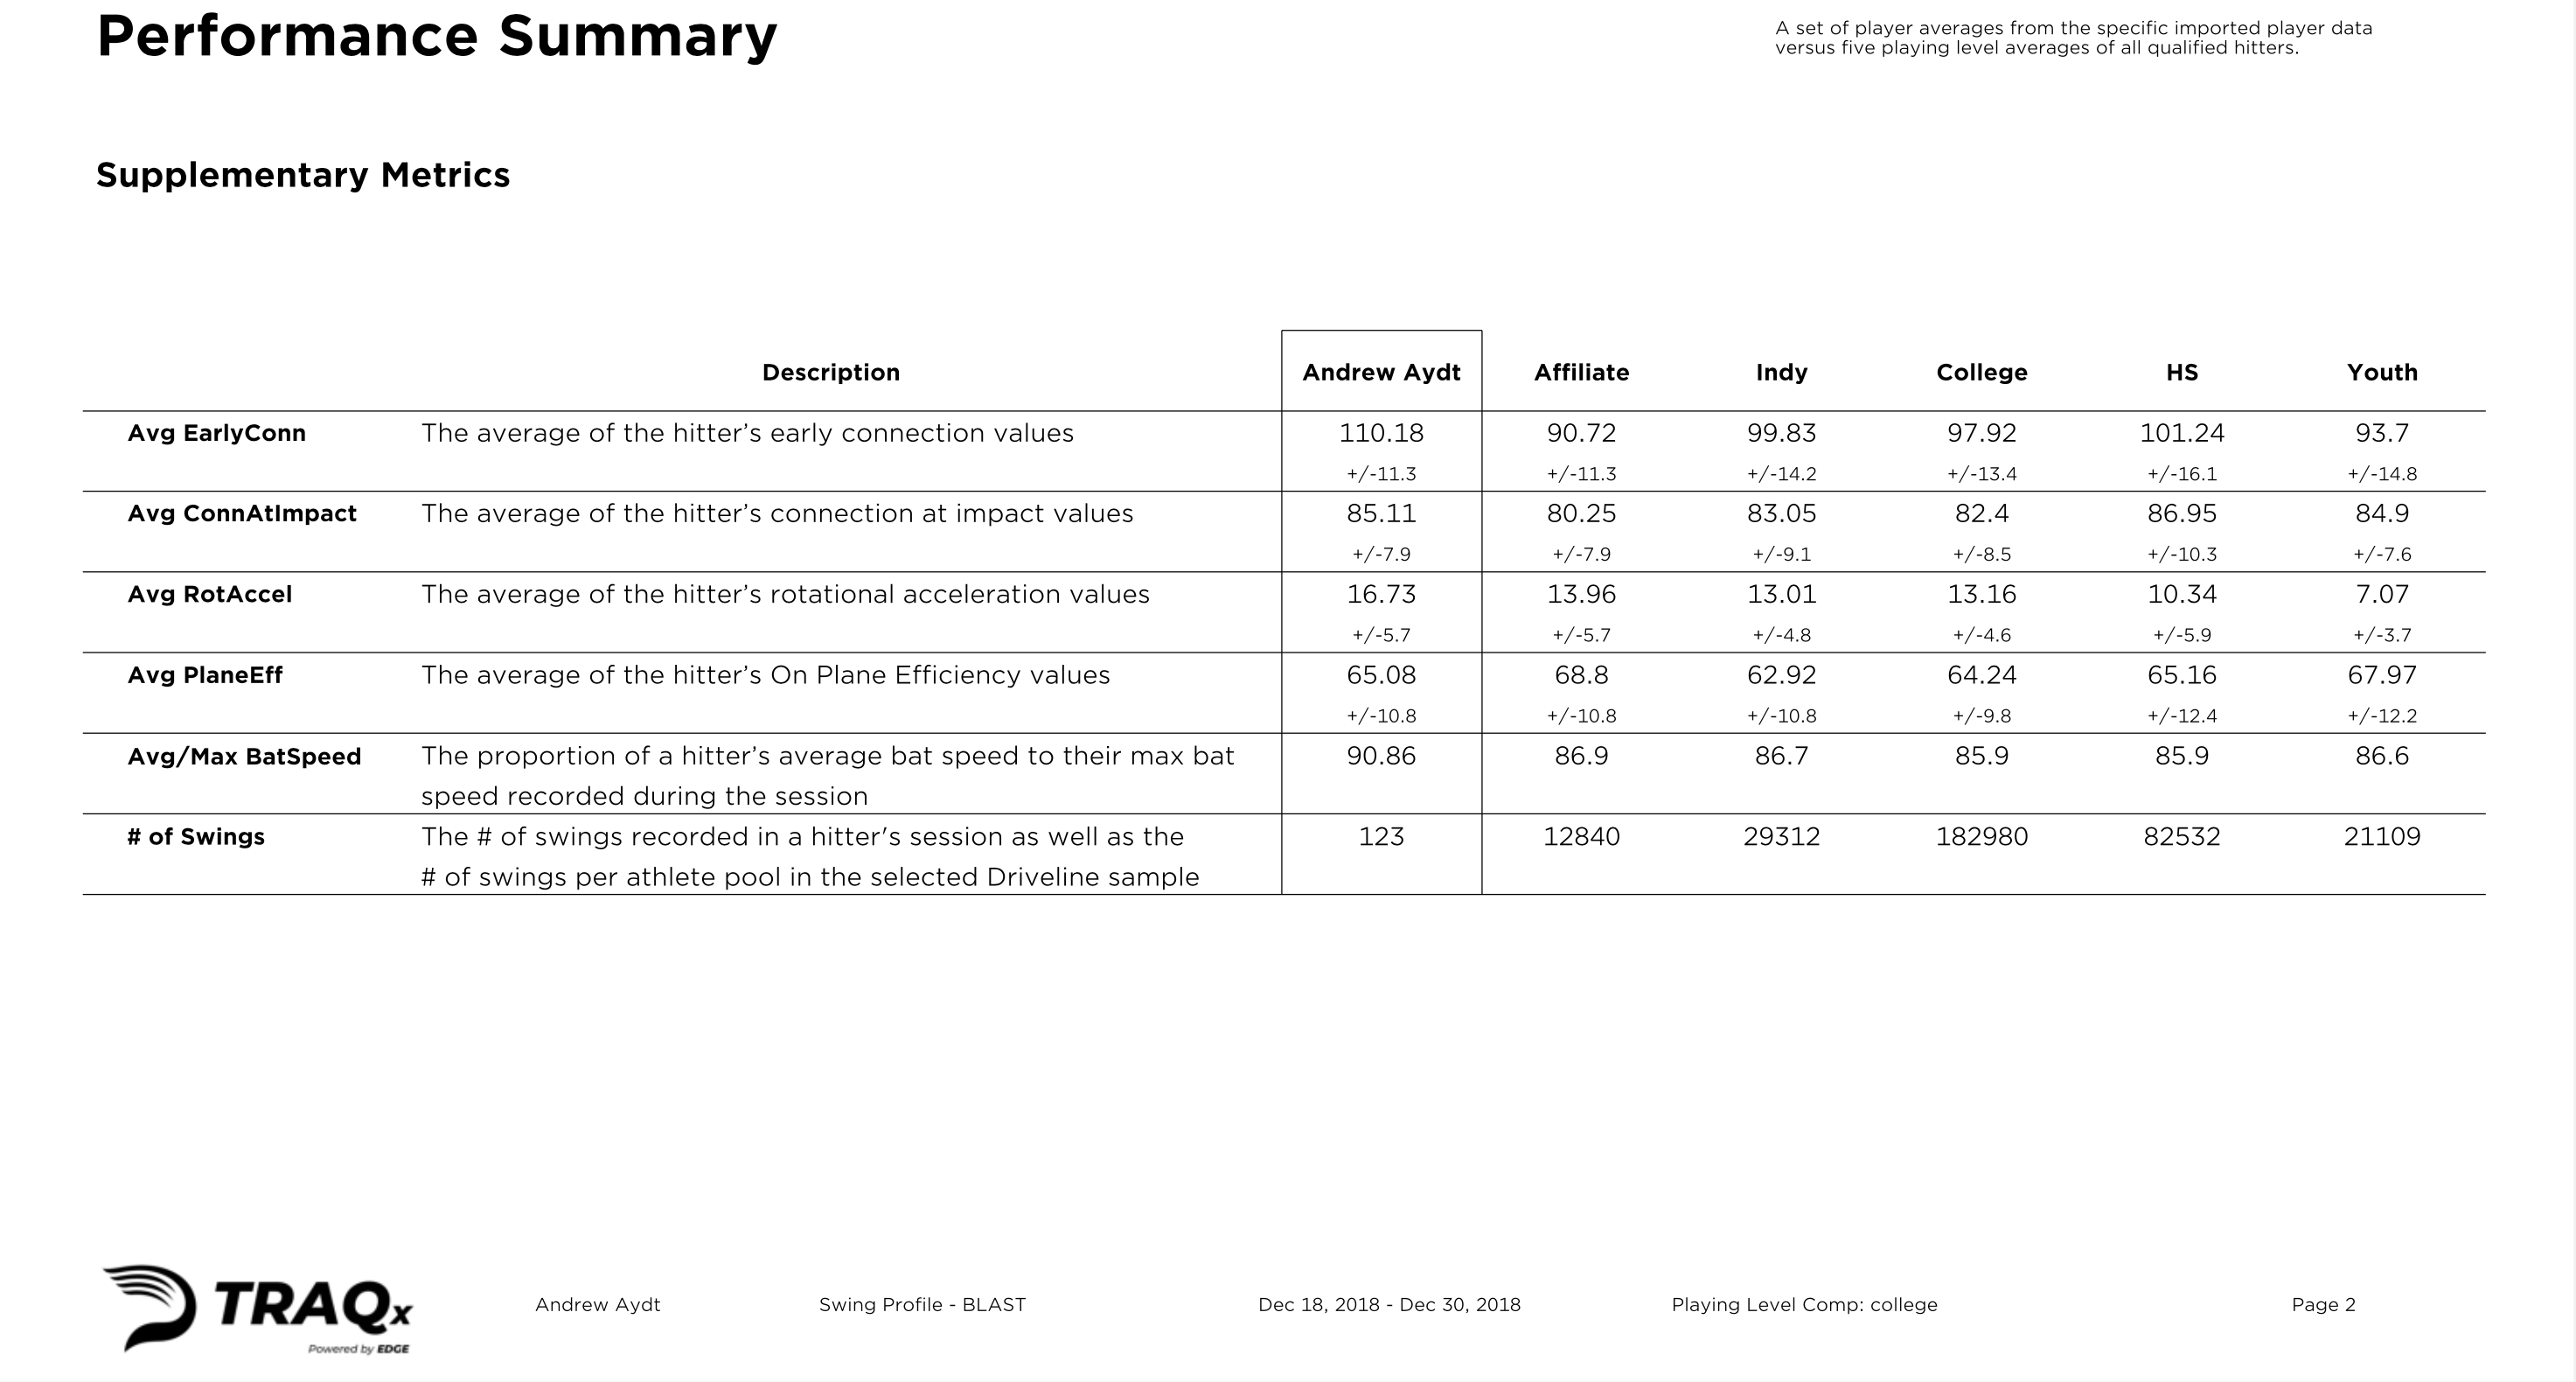
Page 2
The second page of the report features supplementary metrics like Early Connection and Rotational Acceleration.
Page 3
The third page of the report compares the hitter’s bat speed and attack angle to our athlete populations.
Page 4
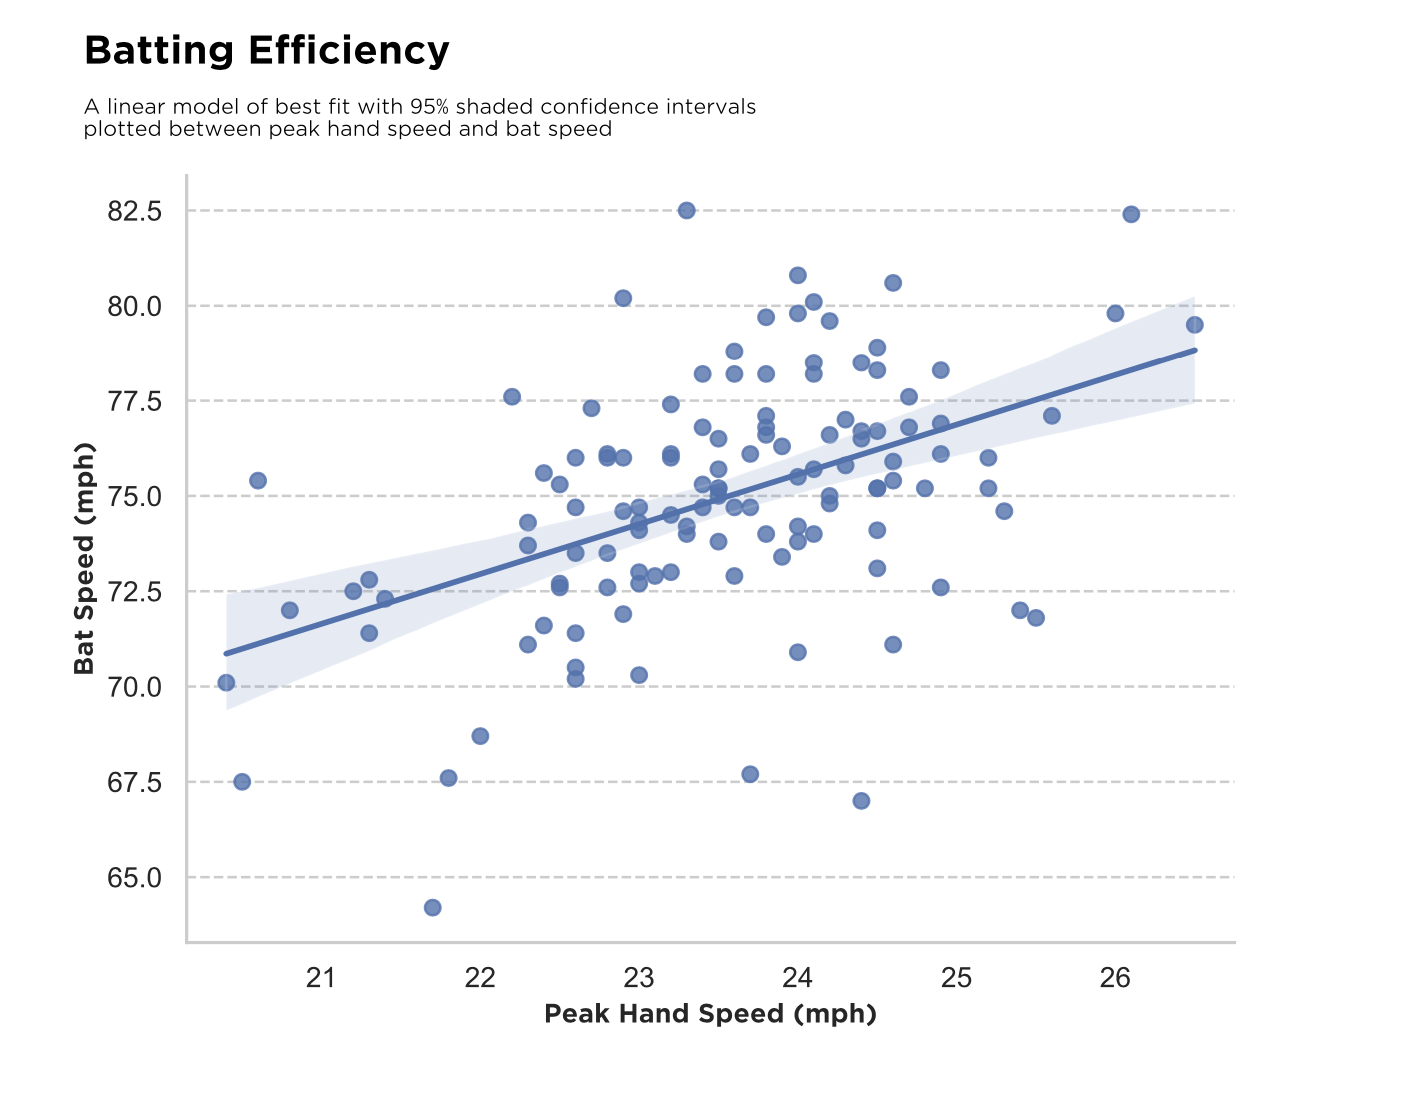
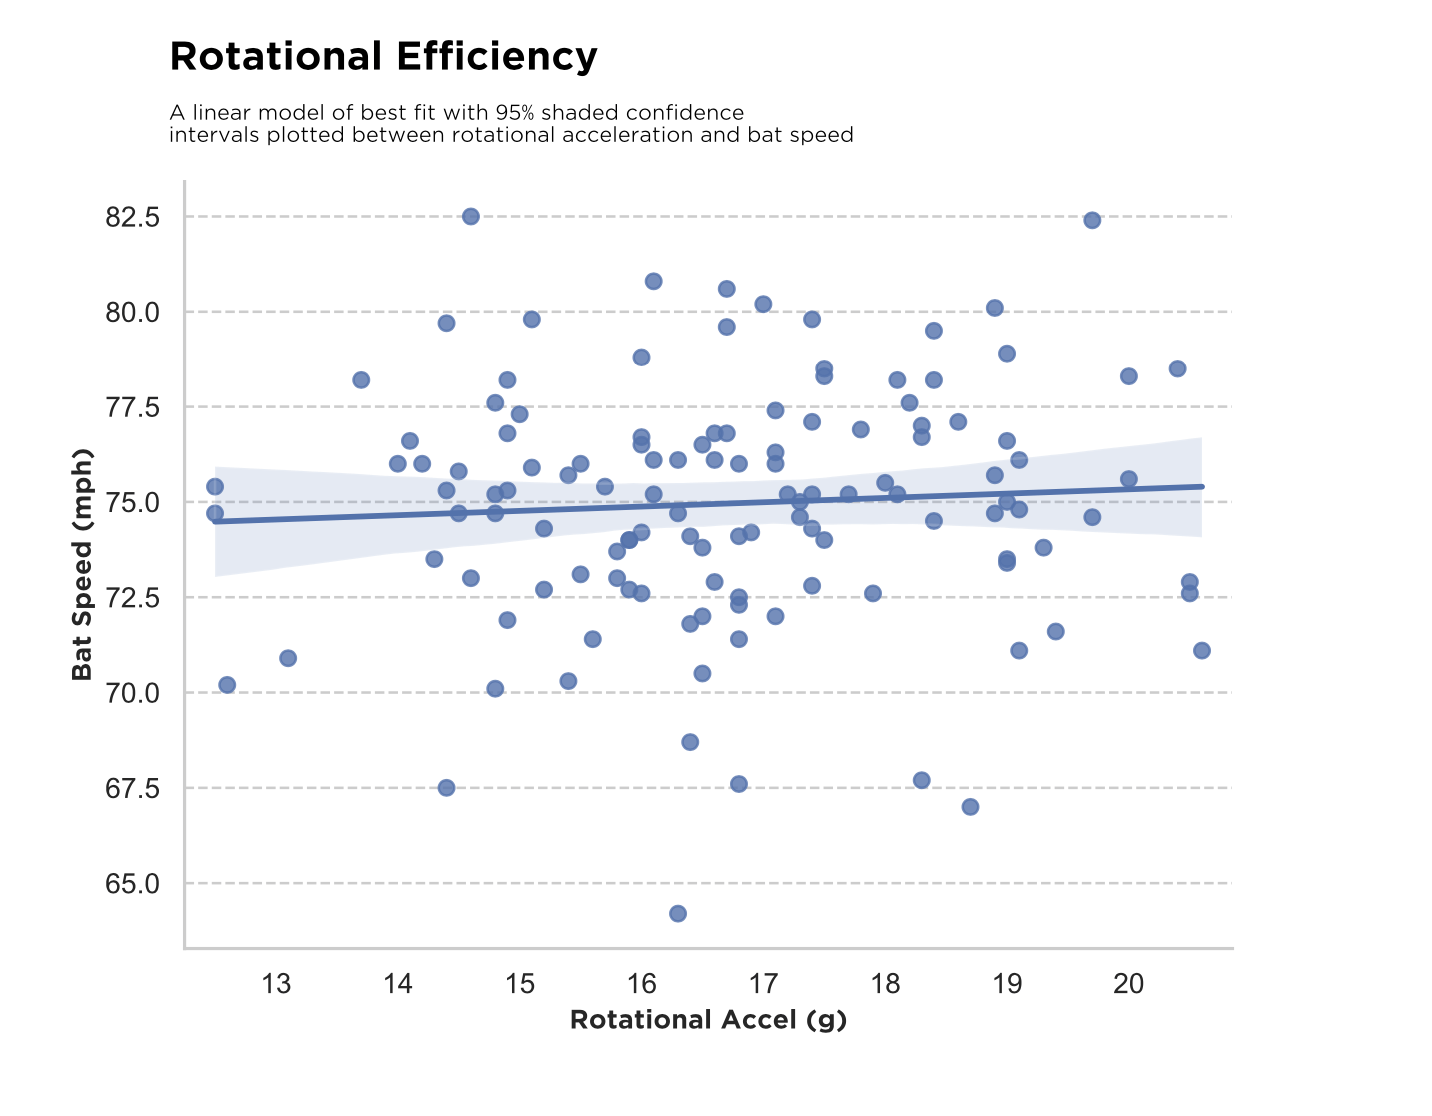
The fourth page of the report features two more plots.
The first visual is an ‘efficiency’ plot, showing bat speed against peak hand speed with a best-fit linear regression line (with a shaded 95% confidence interval).
The second visual is a rotational efficiency plot, showing bat speed against rotational acceleration.
Visual three is a linear scatter plot displaying the hitter’s average and max bat speed at different attack angle ranges.
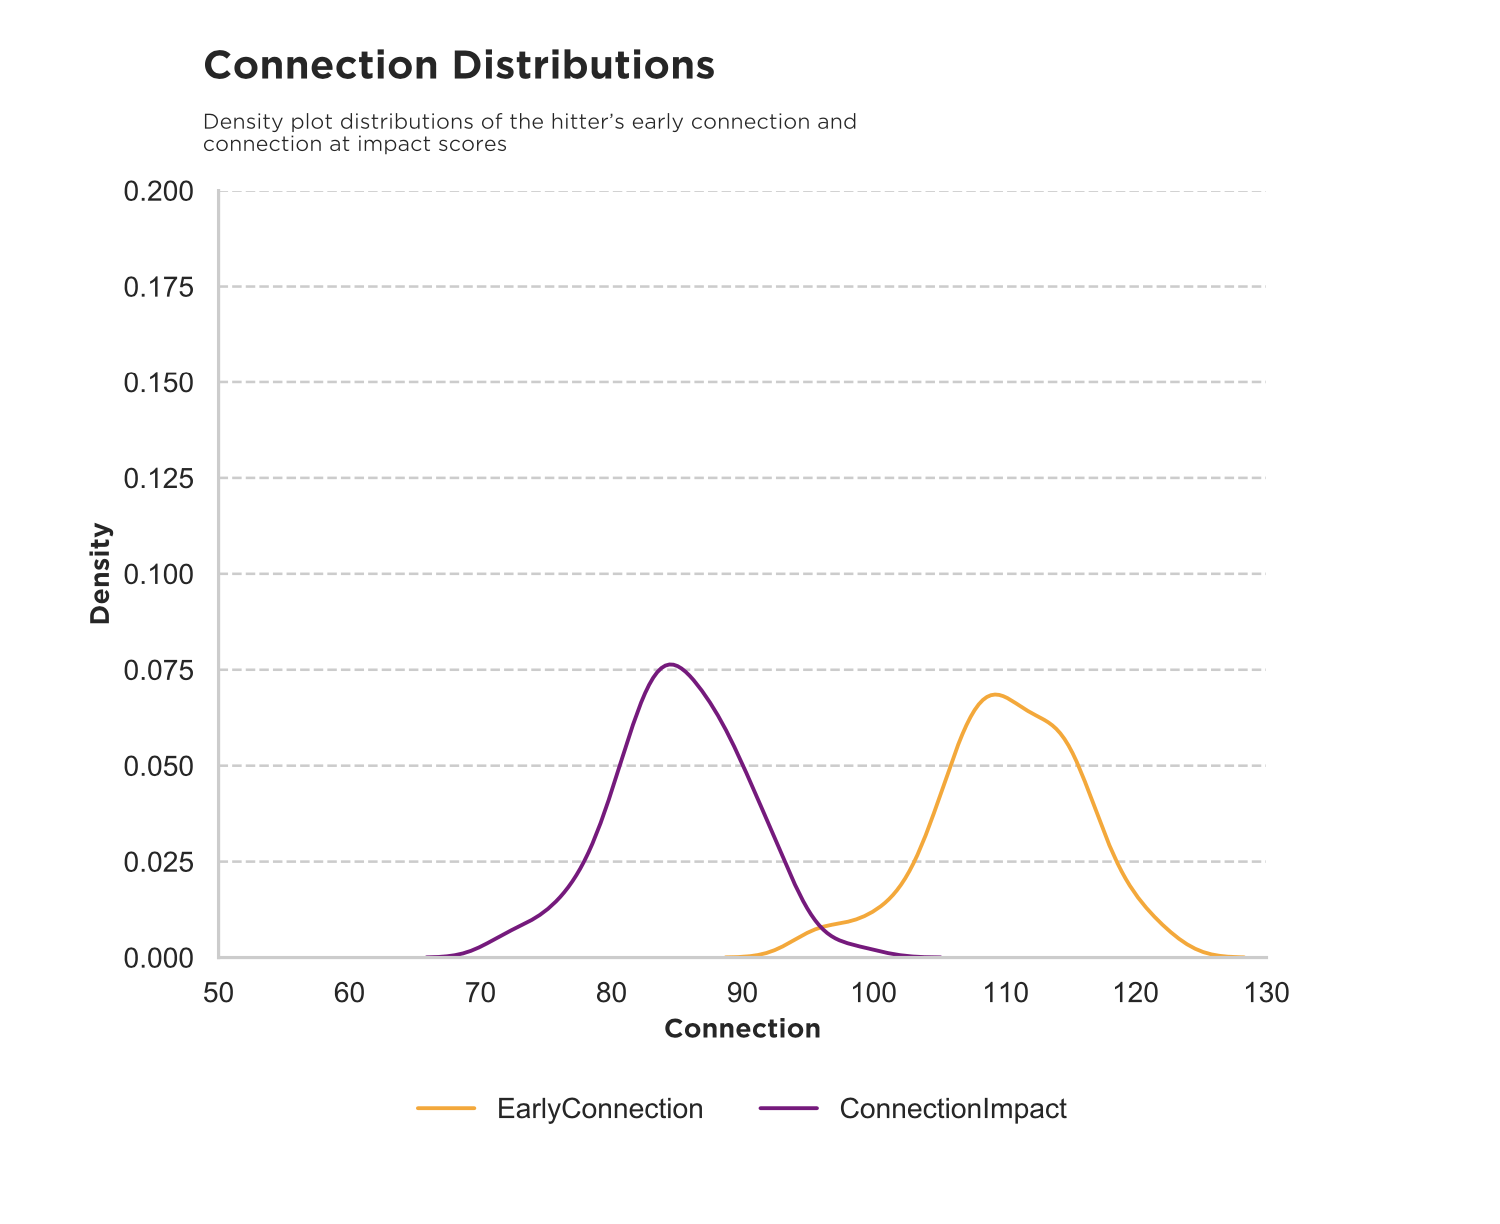
And the last visual is another density plot, this time showing distributions of the hitter’s early connection and connection at impact scores.
Page 5
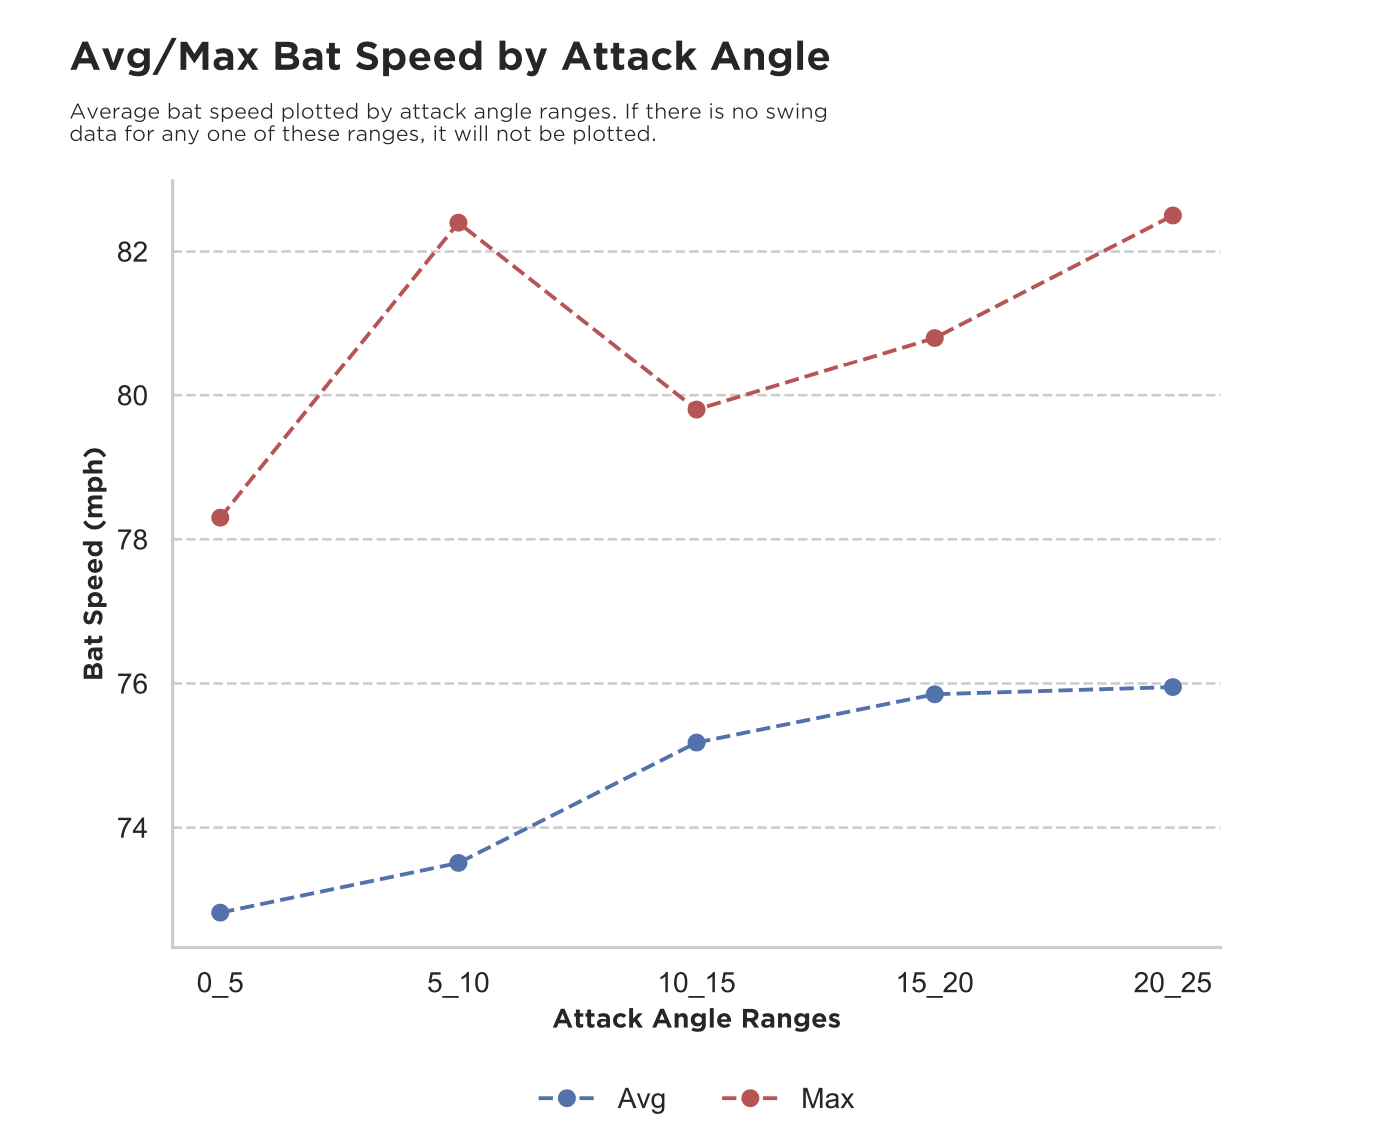
The first visual is a linear scatter plot displaying the hitter’s average and max bat speed at different attack angle ranges.
And the last visual is another density plot, this time showing distributions of the hitter’s early connection and connection at impact scores.
Page 6
Page six provides more context for the hitter’s data, starting with drills and insights.
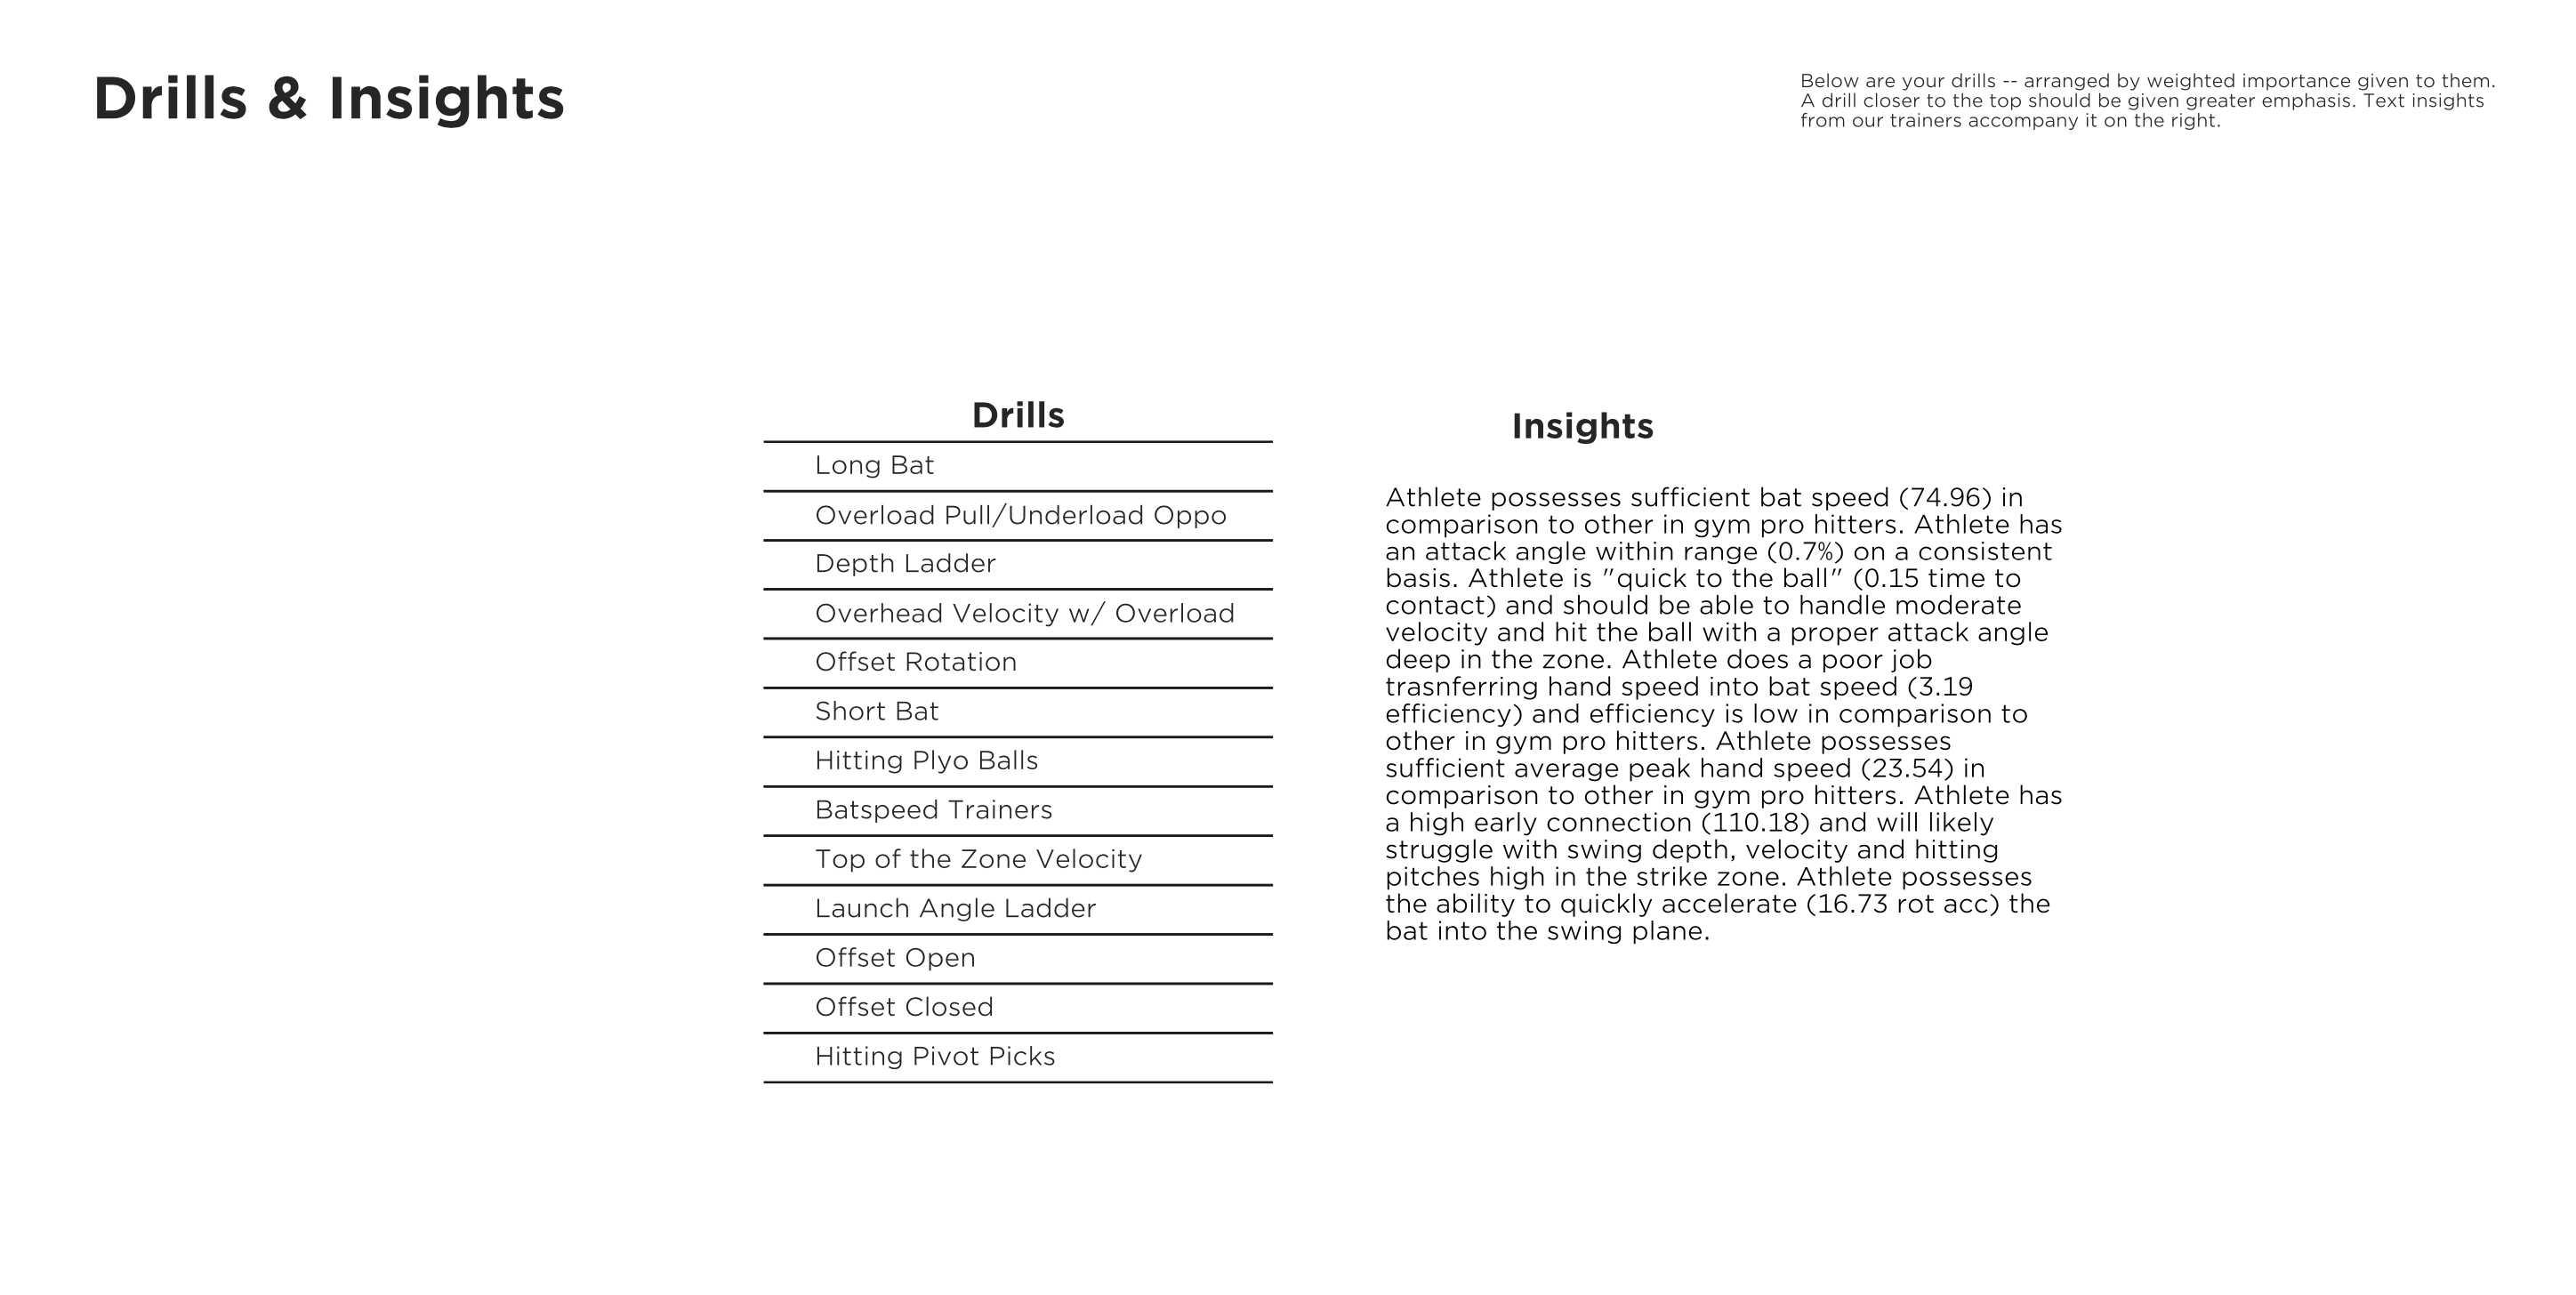
Following the hitting notes is a list of drills with a score weighted from highest to lowest. The list consists of drills/implements we use daily with all of our hitters who train in the gym and online. The drill weights are generated from flags in the hitter’s Blast data, and the most heavily weighted drills are likely to be the most effective in addressing the hitter’s deficiencies as they have been revealed by the data.
When looking through the drills, it’s important to understand that intention generally shapes movement patterns. So, an understanding of what you are trying to accomplish with each drill or implement is essential.
For example, a hitter tagged for low bat speed is going to see a high weighted score for overload/underload, but if that hitter is tagged for a drill like the depth ladder or offset rotation, they must do said drill with the intention of moving the bat as fast as possible.
Page 7
The final page of the report includes blogs to better understand the metrics and your swing.
A Couple More Technical/Validation Nugs
We’ve already talked about the RMSE and adjusted R^2 of our predicted batted ball metrics. These were derived from our 25k database of paired data as we needed the ‘true’ values (the measured EV, LA numbers) to compare to our model predictions taken from the same set of training data. Our model errors and diagnostics were encouraging, and 25k is a decent chunk of data.
But you know what’s better than 25k? The 405k samples of raw Blast data we’ve collected in the last year, as well as the 160k rows of batted ball data (HitTrax) we’ve collected over the same time span. We wanted to see how our models held up over a much larger and much more diverse data set to better evaluate their quality.
For each of these large datasets, we decided to split up all data points into unique player months to control for both different training modalities and changes in talent. Now validating our model that was built on a smaller paired Blast and Hittrax dataset of swings to unpaired, larger individual datasets of Blast and Hittrax swing is an especially rigorous criteria to hold oneself to; for example, there’s not the same guarantee that players took these separate Blast and HitTrax swings in the same training environments or with the same intensity/approach.
Foundations of Hitting
30 modules teaching you everything we know about hitting and hitting mechanics.
To combat this limitation, we only included Blast Swings that were taken against a pitching machine and filtered out mishits on both the Blast (classified as swings that were less than 50% of a player’s max bat speed) and HitTrax side (swings that didn’t register a positive exit velocity or were outside a 90-inch depth range at point of contact).
Then, in our filtered data set, we set a minimum swing filter to determine whether the player month constituted a large enough sample size to merit inclusion (20+ swings for Blast data; 50+ swings for Hittrax data).
For example, if Player X trained at Driveline and recorded at least 20 swings on Blast for five months and at least 50 swings on HitTrax for four of those months, they would have four matching unique data points of bat swing and batted ball metrics. We then used this new dataset of player months (and their respective qualifying metrics) to generate a new set of predictions for our expected batted ball metrics and compare these to the ‘true’ batted ball metrics for predictiveness, destructiveness, and reliability.
We measured correlations and residual errors between the predicted (noted in the visuals with the label ‘pred_’) and recorded values for each player month.
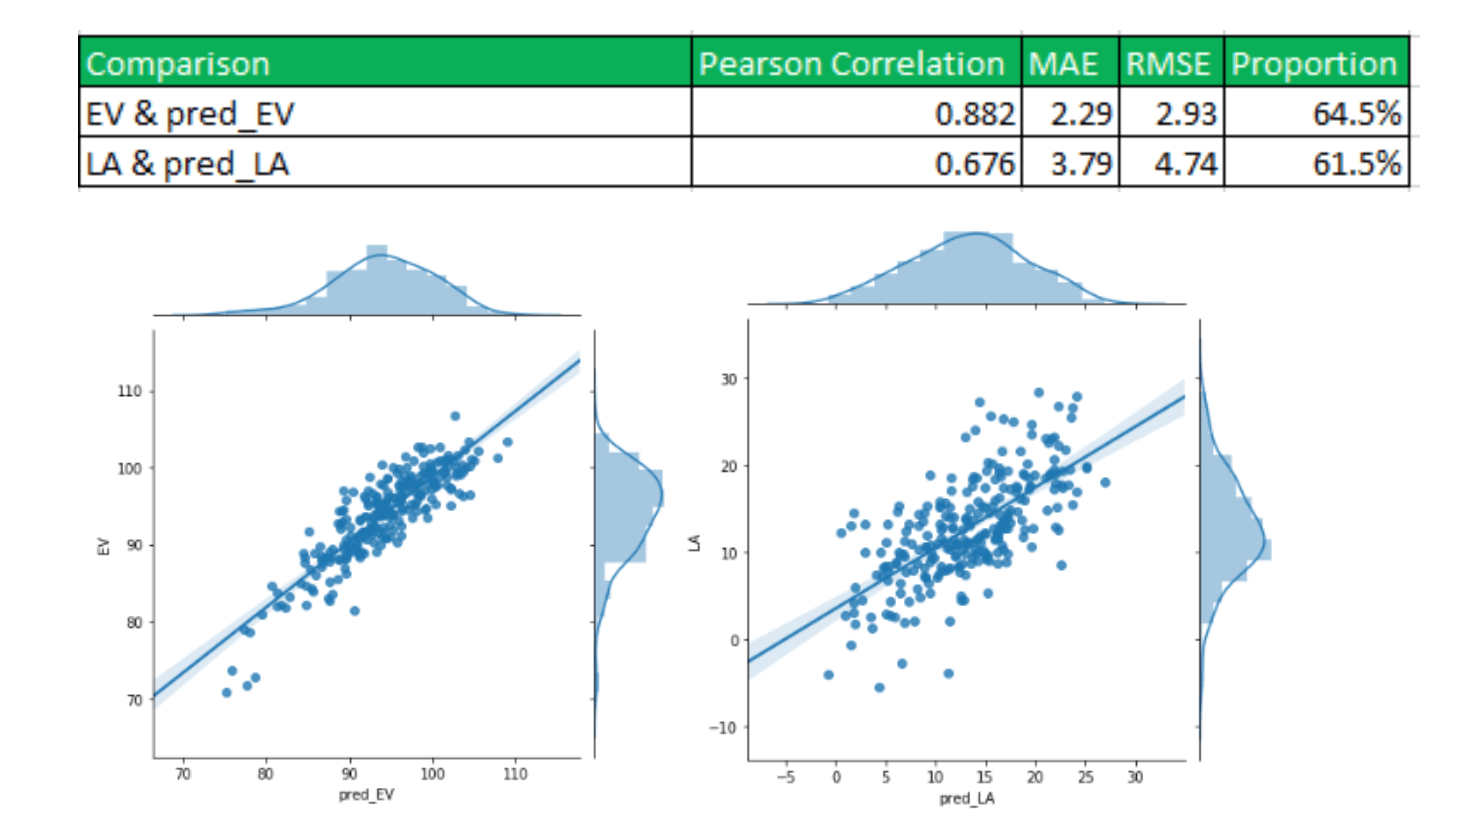
Note: EV and LA are merely shorthands and still refer here to Peak EV and LA at Peak EV.
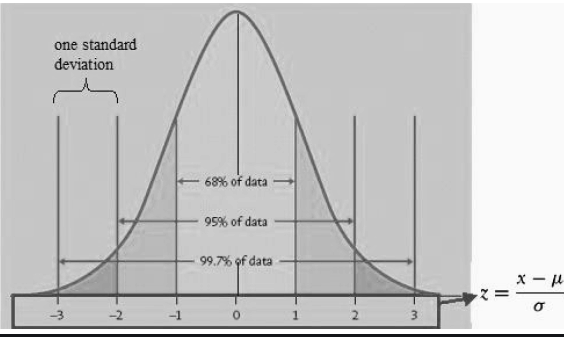
These correlations were satisfyingly high, with the RMSE and MAE mirroring past results from our training set. In addition, using the training model RMSE noted from above (2.7 for peak EV, 4.0 for LA at peak EV) as a 1 SD confidence band, we found that 64.5% of peak EV figures in unique player months fell within the predicted peak EV +/- RMSE band, while 61.5% of the respective LA at peak EV figures also fell within the same band—estimates quite close to the general +/- 1 SD band of a normal distribution (68%).
We then stacked up players who had concurrent months in the dataset to measure month to month reliability and predictiveness. For example, if a player had a qualifying April, May, and June (2019) worth of data, we wanted to see how predictive and reliable the numbers were from April to May and May to June. The actual HitTrax recorded peak EV, and LA figures were the gold standard (after all those were the ‘truth’ values); how close did our predicted proxies get?
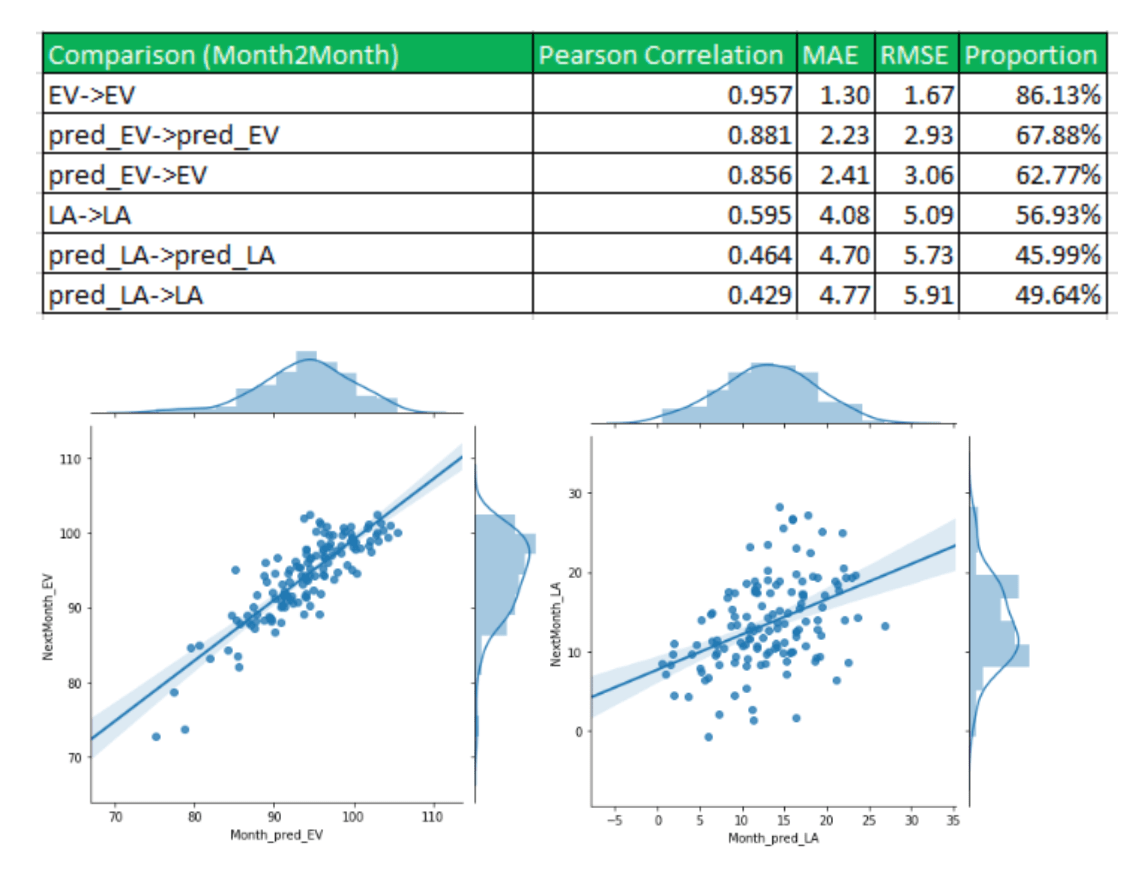
We found these results extremely encouraging, with the reliability from month to month only dropping a tiny bit and RMSE and MAE numbers staying similarly resolute. Given that this new large-scale validation data set spanned a wide scale of talent (peak EV figures in the sample ranged from around 70 mph to 105+), we feel confident in our model’s robustness at generating accurate and precise predictions for varied data sources.
That said, we still do recommend a sample size of at least 50 Blast swings before putting much faith in the numbers. This will mitigate the chances of outliers, mishits, and poor data recording skewing the results.
The new drill scores will also undergo a similar evaluation and validation process in the near future, once enough data points are collected. We plan specifically to look at the frequency of certain drill score assignments with the expected changes/improvements for the metric they were initially flagged for. This process has already been set and employed with other systems in gyms: deploy weighted values for drills or certain programs, collect data with that system intact, audit the system, develop a new system based on the audit, rinse and repeat with (hopefully) increasing efficiency.
Swing Profile provides a ton of value for hitters. Not only does it give them an idea of where they are in comparison to their peers and professional level hitters, but it provides them with context and recommendations for how they can improve.
We’re very excited to put this report to use. It’s a significant upgrade for our online hitting program and is another valuable tool for our trainers when working with hitters remotely and in the gym
Train at Driveline
Interested in training with us? Both in-gym and remote options are available!
- Athlete Questionnaire: Fill out with this link
- Email: support@drivelinebaseball.com
- Phone: 425-523-4030
By Alex Caravan and Tanner Stokey.
Comment section
Add a Comment
You must be logged in to post a comment.
Dave -
What are the best resources to understand *how* Blast calculates early connection and connection at impact scores? Connection scores relate spine tilt angle to vertical bat angle with desired being 90-degrees. I don’t understand how they can derive spine angle from the sensor. Seems they have to make assumptions both about body geometry (torso height, arm length, etc.) and about “typical” swing orientations to estimate spine angle during the swing. Pairing the sensor reading with visual analysis would help verify the readings. Has anyone at Driveline done this?
David Besky -
Dave – that is a great question. Blast reverse engineers the spine angle it uses to calculate these using the bat plane from throughout the swing, although I have not seen good public resources that detail these calculations. Although we have not rigorously compared these connection metrics with videos as far as I know, we are currently in the process of validating the Blast metrics using our motion capture lab which will provide us accurate body position measurements to compare with and verify these metrics.