Caught Looking: Change of Direction Ability, Warm-up Effects and Dry Cupping

Here are three studies the R&D department at Driveline read this week:
Association of the Vertical and Horizontal ForceVelocity Profile and Acceleration With Change of Direction Ability in Various Sports
When considering how important change of direction in baseball might be, it may seem inconsequential to sports like tennis or basketball. However, without analyzing the association between things like change of direction performance and base stealing or various defensive metrics (that can be for another day), I believe change of direction has the potential to be a considerable predictive measurement.
A study in the European Journal of Sport Science looked at the association between vertical and horizontal force-velocity measures and change of direction performance using a modified 505 test (similar to a shuttle test) in 54 male athletes. Tennis, basketball, and soccer athletes were included in the sample.
Vertical force-velocity profiling was done using a validated method incorporating body mass, jump height, and push-off height during loaded and unloaded counter-movement jumps, and horizontal force-velocity profiling was done using a continuous horizontal velocity measurement with a Stalker ATS Radar Device.
Baena-Raya et al. found that the performance measures of the horizontal force-velocity profile were more closely associated with change of direction performance than vertical force-velocity profile measures. The Pearson Correlation Coefficient was as high as -0.941 (-1.0 would be a perfect negative association) between maximum theoretical force and change of direction performance for the non-dominant side of tennis players.
This means that an increase in maximum theoretical force in the horizontal direction was associated with a decrease in change of direction score (which is better; lower time = faster). Additionally, change of direction performance exhibited significant correlations with sprint times across the board.
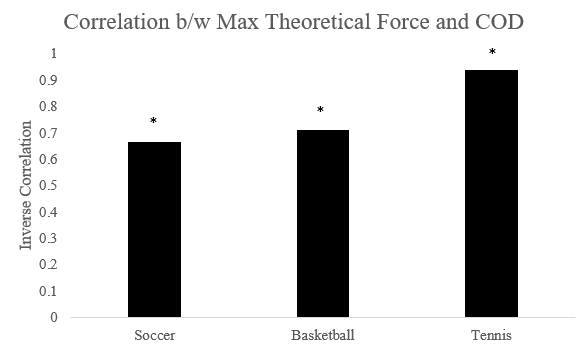
Correlation between maximum theoretical horizontal force and change of direction performance on the athlete’s non-dominant side. All three correlations are statistically significant.
Despite the lack of baseball players in this sample and not knowing the true impact of change in direction performance on in-game baseball performance, the main takeaway from this study can be that horizontal force-velocity profiling may be a valid measurement for position players in baseball.
If we assume that change of direction is an important aspect of playing the field and running the bases in baseball, then a simple measure (done with some code/spreadsheets and a Stalker ATS II) of an athlete’s horizontal force-velocity profile may be a worthwhile strength and conditioning assessment addition.
Influence of quantified dry cupping on soft tissue compliance in athletes with myofascial pain syndrome
Dry cupping is a common therapy for soft tissue discomfort in baseball. Other therapies are also widespread—including Graston—which are often tough to quantify and standardize.
For example, when an operator is providing dry cupping therapy, how much air to pump out of the cups, how long to leave the cups attached to the skin, the location and size of the cups, and whether or not to avoid a specific area of somebody’s body are all things that can be inconsistent between users. The experience of the operator is most commonly relied upon to make these judgments while providing the therapy.
In an interesting effort to quantify the use of dry cupping, Chiu et al. in Taiwan tested an electronic system for measuring negative pressure inside the cups and the distance which the skin moved during the cupping therapy. Optical sensors to measure distance and pressure sensors were placed inside the cups and were wired to a processor to provide quantitative measurements of the cupping therapy.
Two groups were created, 9 baseball players with subjectively identified myofascial pain syndrome and 9 players without, and were given four weeks of dry cupping therapy with 6 cups for 15 minutes, two times per week, with the same pressure.
The two groups were evaluated for qualitative shoulder and arm function, internal pressure trends of the cups during the 15-minute cupping sessions, and the distance and compliance of the skin (basically how much the skin moved during the cupping session with the fixed* amount of force/pressure. The main findings of this study were:
- Pressure was attenuated significantly more in the normal group than the group with myofascial pain syndrome.
- Soft tissue compliance was higher in the normal group than the group with myofascial pain syndrome (their skin was displaced more in the cups)
- After four weeks of cupping, the myofascial pain group had more ‘lift’ of soft tissue in the cups (skin was moved by the pressure more in the cups) than before the four weeks of treatment.
- Both groups improved shoulder function (based on qualitative questionnaires)
All in all, there aren’t many takeaways from this that will change when, why, or who gets dry cupping therapy. One positive, however, is that both groups showed an improvement in shoulder function. Whether that is due to the cupping, measurement error, or an unknown confounding factor, we can’t be 100 percent sure.
This study is more of an interesting look into the quantification of cupping’s effects and specifications than a drastic change of approach with dry cupping in baseball players.
However, this study does do a good job of highlighting the limitations associated with these types of therapy. They are very often reliant upon the experience and subjective judgment of the operator. At some point in the near future, maybe instrumented cups will be used for this type of therapy to allow for its standardization and even improve its effectiveness.
Warm-Up Intensity and Time Course Effects on Jump Performance
As we move to more standardized warm-ups in our program, it seems appropriate to consider how warming up affects athletic performance. Many warm-ups are non-standardized and vary in specificity, but understanding the effects of warm-up intensity is important for creating a protocol that will sufficiently prepare an athlete for performance.
Tsurubami et al. looked into warm-up intensity and its effect on heart rate, muscle temperature, subjective fatigue level, and countermovement jump (CMJ) performance. These measures were taken at three different time intervals after the warm-up was completed: immediately after, 10 minutes after, and 20 minutes after completing the warm-up. The warm-up intensities that were tested included a 15-minute warm-up at 80% VO2 max, 60% VO2 max, and no warm-up, all completed on a treadmill.
The experimenters found that, as you might expect, heart rate, muscle temperature, subjective fatigue, and CMJ jump height increased after the warmup for the experimental groups and decreased as time went on. Additionally, the high-intensity warmup (80% VO2 max for 15 minutes) elicited significantly higher heart rate, subjective fatigue, and muscle temperature at almost all post-warm-up time points.
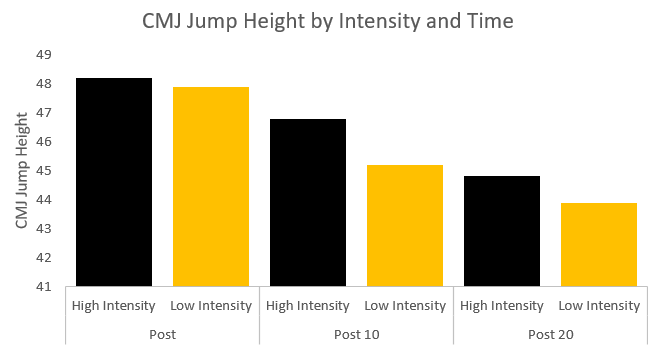
CMJ Jump height as a function of warm-up intensity and length of time post-warm-up. ‘Post’ is immediately after the warm-up, ‘Post 10’ is 10 minutes post-warm-up, and ‘Post 20’ is 20 minutes post-warm-up. This figure is a rough estimate of the data presented in the study.
This leads us to believe that higher intensity warm-ups are more ideal; however, subjective fatigue was significantly greater in the high-intensity condition immediately after completing the warm-up. Additionally, although mean jump height was higher in the high-intensity warm-up condition than the other conditions at all time-points, the difference wasn’t significant.
There are a few limitations to this study, including sample size (though the within-subjects comparison alleviates some of this), and specificity.
Since running on a treadmill isn’t specific to the jumping task, it’s possible that these results would be different with a more specific warm-up activity. Additionally, the effect of warm-up intensity on jump performance may not be the same effect observed in a more applied, skilled task such as throwing a baseball or swinging a bat. Despite these limitations, the experimental design does an awesome job of exhibiting the importance of an intentional warm-up and how intensity can affect an athlete’s subsequent performance.
By Kyle Lindley (@kylelindley_)
Comment section