What if We Could Make Throwing Rehab Better? Doing my dissertation at Driveline Baseball
By Kyle Wasserberger, PhD, CSCS
What if we could make throwing rehab better?
This was the question at the heart of my dissertation. The premise: Pitchers are always going to get injured. Despite our best efforts, and no matter how good we get at reducing them, injuries are still going to happen (picture the little Dutch boy plugging the hole in the dike).
If we accept that injuries will never not be a thing, it begs the question: What if we could minimize the impact of those injuries that do still happen? What if we could get athletes back from injury faster, or better prepared to handle the demands of competition, or both?
When it comes to research, we (and by we I mean the sports medicine and sports science research communities) already devote considerable time, effort, and resources studying how to fend off injuries before they happen. Conversely, research aimed at minimizing the time and labor costs of the rehabilitation process is less common. Why not try and attack the injury problem from both directions? Yes, we should try to prevent as many injuries as we can. But, we should try just as hard (if not harder) to make the recovery process as smooth and efficient as possible for those injuries that do still happen.
Throwing rehabilitation programs prepare injured players to handle the demands placed on them during competition in as little time as possible. We can break down this process into three steps:
1. Start with small, tolerable throwing workloads
2. Gradually and systematically increase throwing workloads
3. Repeat until the athlete can tolerate workloads similar to those found in competition
These steps are reflected in the typical interval throwing program: Athletes start with relatively few throws at a relatively short distance. Over the course of several weeks, athletes perform more and more throws from longer and longer distances. Eventually, athletes return to the pitching mound and gradually increase their pitching workload. After passing enough checkpoints, they’re allowed to return to competition.
Current interval throwing programs rely primarily on throw number and throw distance, integrated with subjective feedback from the athlete about how their arm feels. More recently we have seen calls for radar gun inclusion to provide quantitative throwing intensity feedback. But what if there was a way to quantify throwing workload and intensity not only by how many throws you made and how far/fast you threw them, but by estimating the stress experienced by the throwing arm? What if we could integrate biomechanical analysis into the interval throwing program?
Doing the study
With my dissertation I wanted to gather information that could eventually be used to improve throwing rehabilitation protocols. In short, I wanted to know whether players responded differently to similar changes in throwing intensity (as measured by velo). If players respond differently, then it’s possible that more program individualization could be beneficial. What if a set increase in throwing intensity was a challenge for Player A but not a big deal for Player B? If both players were keeping the same rehab timeline, then either Player A would be progressing too fast, risking a setback, or Player B would be progressing too slow, costing valuable playing time.
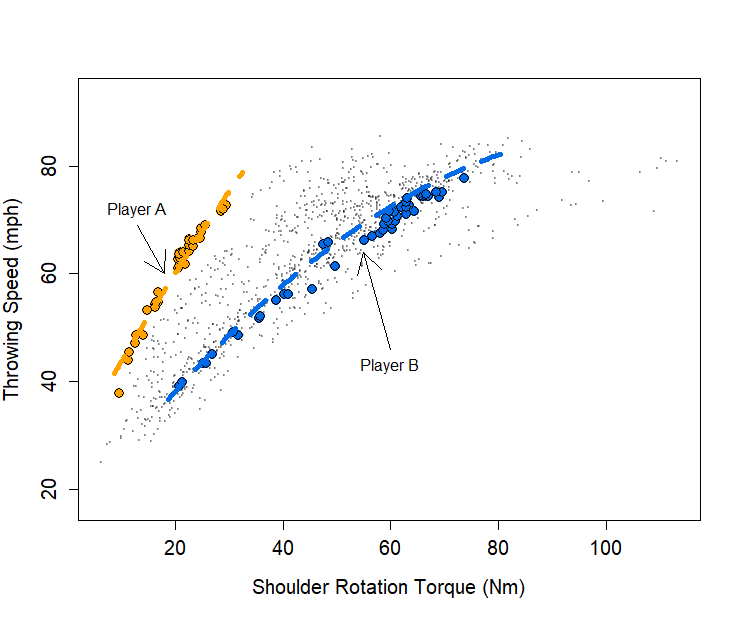
To examine whether different players responded differently to increases in throwing intensities, I needed to quantify the loads placed on the throwing arm throughout the throwing intensity “spectrum” (i.e. starting at “first throws of the day” intensity, progressing all the way to maximum effort throwing). I brought players into the motion capture lab and recorded their mechanics as they performed a typical throwing warm up. Players were verbally instructed to progress from minimum to maximum intensity at their own pace. I then built a biomechanical model for each athlete and estimated the loads on the shoulder and elbow for every throw. The result was a joint load vs. velo curve unique to each athlete. Two such curves are emphasized in the figure below…
In total, I collected data on 1,318 throws from 36 players, 32 of which I could use for my dissertation. Once I had the biomechanical data, I had to model each athlete’s curve statistically. To do this, I turned to mixed-effects modeling, a technique used commonly in fields like quantitative psychology but rarely used in biomechanics.
What is mixed-modeling?
For those unaware, mixed-effects modeling (aka multilevel modeling, hierarchical modeling, and plenty of other names) is a statistical analysis technique which takes nested data (i.e. throws nested within athletes, students nested within classrooms, voters nested within political districts, etc.) and builds a regression model for each “group” in context of the data as a whole (in my case, each group was an athlete). The athlete-level model quantifies the within-athlete relationship between throwing intensity and throwing arm joint loading, while the whole-data model quantifies the average athlete-level model across my entire sample. This approach makes mixed-effects models well suited for examining within- and between-athlete relationships at the same time. My question was not just “what’s the relationship between joint loading and velo?” but (simultaneously) “what’s the relationship between joint loading and velo and is that relationship different between athletes?”, which includes one within-athlete question and one between-athlete question.
The relationship between joint loading and velocity
Anyways, at first glance, the first half of my question (“What’s the relationship between joint loading and velo?”) is pretty straightforward. We already know that as velo goes up, so does joint loading. But I was more interested in whether the increase in joint loading for a given increase in velo was consistent across the entire throwing intensity spectrum. In statistical language: Was the within-athlete relationship between velo and joint loading linear or nonlinear?
Although previous research out of ASMI has shown a strong linear relationship between velo and elbow valgus torque per unit bodyweight height, this relationship was only shown for game-effort throwing from a mound. What about submaximal intensity throws? What about flatground throws? Since most of the throwing rehab program is not performed at game-effort and not performed from a pitching mound, there was definitely a gap in the research that I felt should be addressed. Including the entire throwing intensity spectrum would increase the applicability of my findings to rehab settings.
Does velo and joint loading differ between athletes?
Once I established the within-athlete relationship between velo and joint loading across the entire throwing intensity spectrum, I wanted to see if that relationship differed between athletes. This is where mixed-effects modeling can shine. By allowing each athlete to have their own regression line, I could estimate the regression equation parameters for everyone in my sample (recall that I’m modeling each athlete as a combination of the “average” model across the entire athlete sample (sometimes called fixed effects) plus some deviation from that average (sometimes called random effects). If athletes didn’t differ much in their responses to increases in throwing intensity, then the random effects would be small and the fixed effects by themselves would suffice. If athletes did show differences in their joint loading vs. velo relationship, then including random effects would fit the data better.
Let’s revisit the figure from earlier showing shoulder rotation torque on the x-axis and velo on the y-axis, but this time with the fixed-effects-only model added.
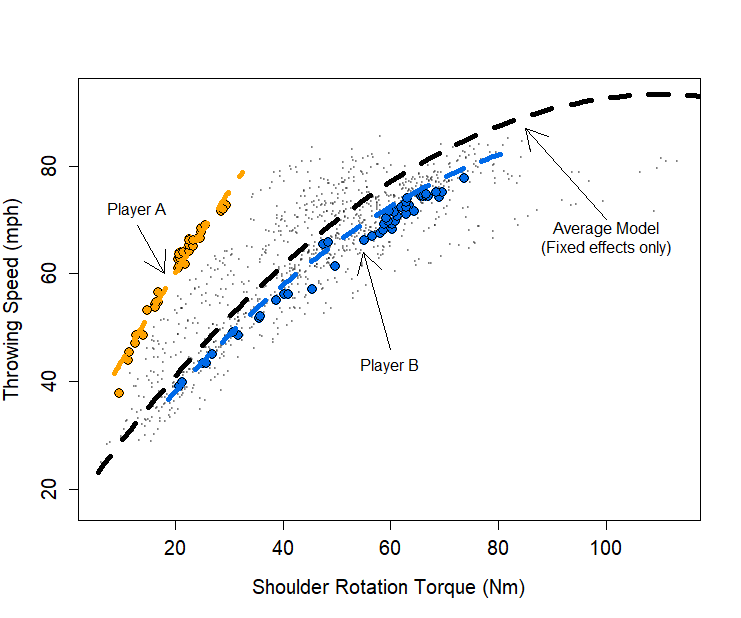
Overall, there are some pretty distinct nonlinear trends in the data (at least at the group level), indicating that the relationship between velo and throwing arm joint loading may not be linear throughout the entire throwing intensity spectrum. Additionally, you can see Player A is consistently above and to the left of the average model, indicating that they threw faster than average for a given level of shoulder rotation torque, while Player B is slightly below and to the right of the average model, indicating that they threw slower than average for a given level of shoulder rotation torque.
In addition to overall position on the plot, we can look at the slope of the individual athlete regression lines. Player A shows a steeper slope with less plateauing than Player B. A steeper slope represents a greater increase in velo for a set increase in shoulder rotation torque. In this fictional scenario, if Player A and Player B were both going through a radar-gun guided rehabilitation program and prescribed the same intensity increase for the next phase of their program, Player A may not be challenged enough or Player B may be challenged too much. Either would be sub-optimal and could cost the player and their team playing time and money.
What’s the deal here? Why do Player A and Player B have different regression lines? What does having different regression lines even mean, and does it have ramifications for throwing rehab protocols? Is this stuff even worth the extra effort or is the standard interval throwing program good enough?
We’re only just getting started down this line of research and, while some of these questions are more easily answered than others, the takeaway here is that mixed-effects modeling gives us a framework for answering them where more common analysis techniques may fall short. Simultaneous modeling of within- and between-athlete phenomena through mixed-effects models can help address the limitations of applying group-based inferences to the individual, as well as the limitations of extrapolating single-subject results across diverse training populations.
Stay tuned. In the next part of this blog, we’ll dive into how we can build up our model to try to explain the between-athlete differences and how Driveline Pulse may be able to help.
Comment section