Count-dependent Pitch Profile Manipulation

“That’s my put-away pitch”
“That’s my get-me-over pitch”
If you’re a coach, player, or have simply been around the game long enough, there’s a good chance you’ve heard a pitcher make comments similar to the ones above. There’s nothing too crazy about that, as, at its core, the idea is that some pitchers intentionally alter the shape of a pitch type depending on the context of a given at-bat, sequence, or game-state in order to gain a slight edge.
However, what’s less understood is just how many pitchers intentionally manipulate the shape of their pitches depending on circumstances, as well as how much they’re willing to adjust a pitch’s shape overall.
Rather than focus on pitch type consistency or overall variance of a pitch’s given shape (which includes both intentional and unintentional pitch manipulation), this blog will attempt to analyze just the intentional variance MLB pitchers impart to their given pitch types over the course of a given season. Specifically, we’ll look at which pitchers change a pitch’s basic shape on purpose, when they do it, and by how much they switch things up.
Why Do Pitch Profiles Change?
Before we can get into the intentional manipulation of pitch types, we felt it’d be important to touch on the natural, inherent causes of pitch shape variation that every pitcher experiences when on the bump. These factors include but are not limited to:
- Feel for the pitch (ability to repeat pitch shape)
- Intent
- Environmental conditions (mound, baseballs, weather)
- Biomechanics
- Injury
- Fatigue
These factors contribute to changing a pitch profile unintentionally, while other components such as count, batter handedness, scouting reports, hitter swings, the number of times a hitter has seen a certain pitch in a single at-bat, and the times through the order penalty may lead to intentional changes of pitch shape.
Pitchers make these changes to improve pitch effectiveness through the manipulation of velocity and shape, as one version of the pitch may be more effective in the current situation than another.
Why Does the Count Matter?
If intentional profile manipulation does occur, we believe that the count has the biggest influence.
As mentioned above, pitchers often refer to a pitch they would throw in behind counts, and sometimes in even counts, as their “get-me-over” version. This version is thrown to steal a strike or when they have a suspicion that the batter is looking for a different pitch type. For example, the “get-me-over” version works largely due to the count and situation, as a batter is usually not sitting curveball in 0-0 and 2-0 counts, and a pitcher knows they don’t need to throw their nastiest curveball in that situation to achieve a positive outcome. Thus, the focus here is less on maximizing pitch quality and more on location and reliance on the likelihood that the hitter will take or, if they swing, be off timing.
In some cases, a pitcher will throw a lesser version of a pitch (in terms of movement and velocity) earlier in the count and “save the good one” for when they need a swing and miss, as they don’t want the hitter to see and adjust to the better version. In this situation, the “best one” or “put-away” version of a pitch is the one that is most likely to produce a swing and miss or strike out later in the count, when that outcome is more achievable and beneficial.
With this in mind, it is no surprise that velocity varies depending on the count; pitchers tend to increase the intensity when they’re ahead in the count as generally they are more focused on achieving a whiff, rather than locating. It is logical that a pitcher would increase intent on their heater in an 0-2 count rather than in a 3-1 count because the consequences of missing aren’t equal. If you miss in the 3-1 count, the batter walks. If you miss 0-2, you are 1-2 and still in command of the at-bat. Aside from velocity, there are pitchers who strive for a certain shape in a certain count.
While theoretically this strategy may not seem novel, it is still relatively unknown whether this change in intent actually results in distinct movement profiles. The rest of this blog will tackle normal variance in pitch profiles, significant arsenal deviations, and league-wide tendencies.
Pitch Profile Manipulation: A Qualitative Approach
To start, we’ll use the common break chart to qualitatively view the deviation of a certain pitch, where horizontal and vertical movement are plotted from the pitcher’s perspective.
A pitcher who is consistent with their pitch shapes will have well defined clusters for every pitch type and standard movement deviation. Take Blake Snell’s break chart, for example, which features distinct clusters that can be clearly identified for each pitch type.
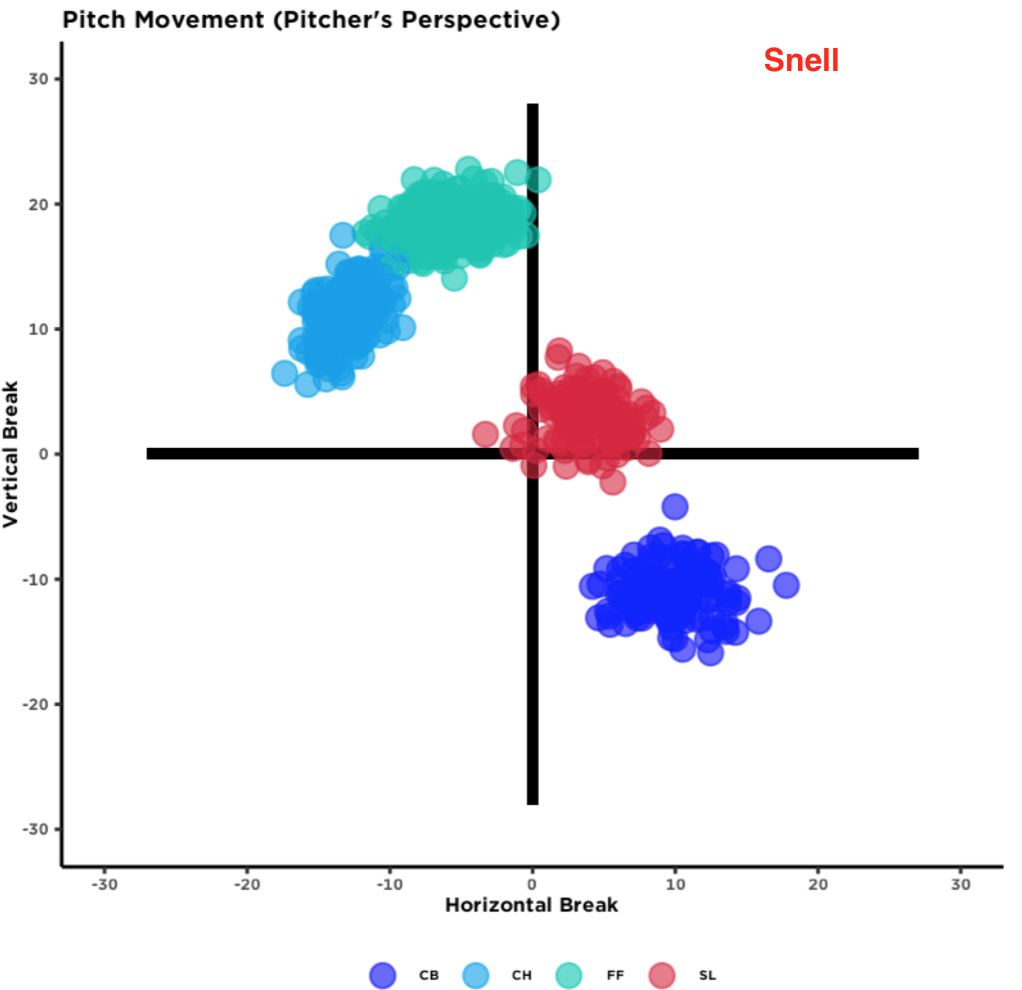
Rather than focus on pitchers like Snell who largely stay consistent with pitch shape regardless of the game and count state, the primary focus of this blog will be the pitchers whose break charts are not as clean. In the examples below, pitch type clusters are not as tight and instead cover a wide range of movement for certain pitch types.
This qualitatively indicates that the pitchers listed are frequently manipulating the movement of their pitches depending on game context, most likely intentionally and with purpose.
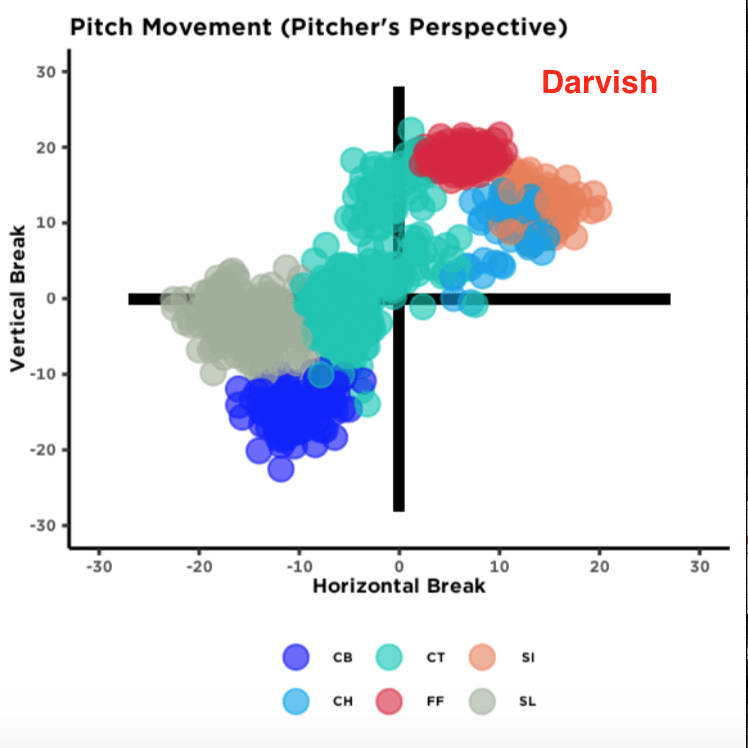
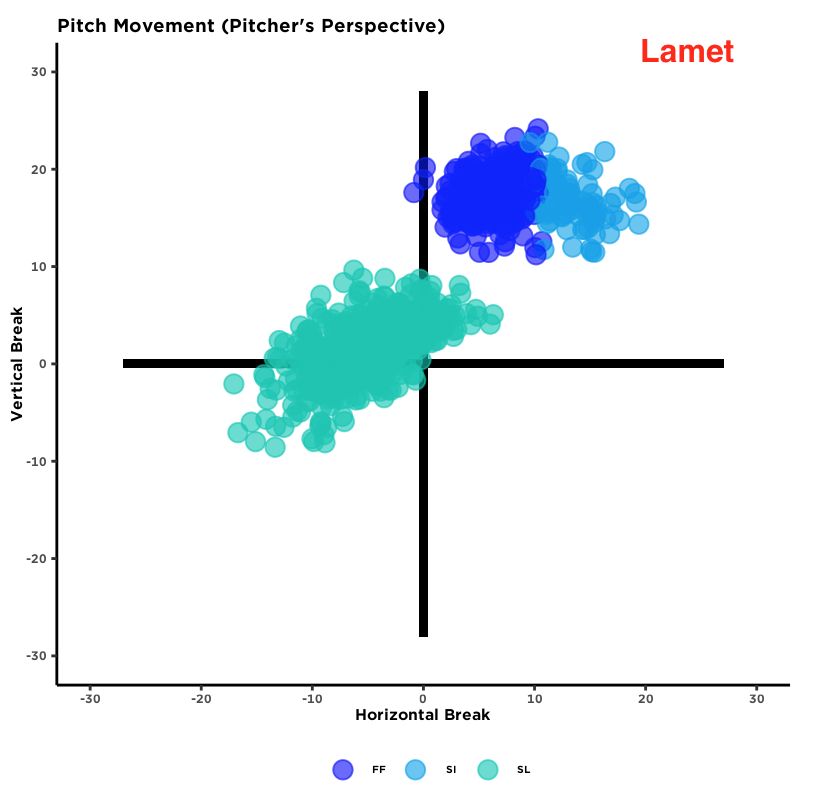
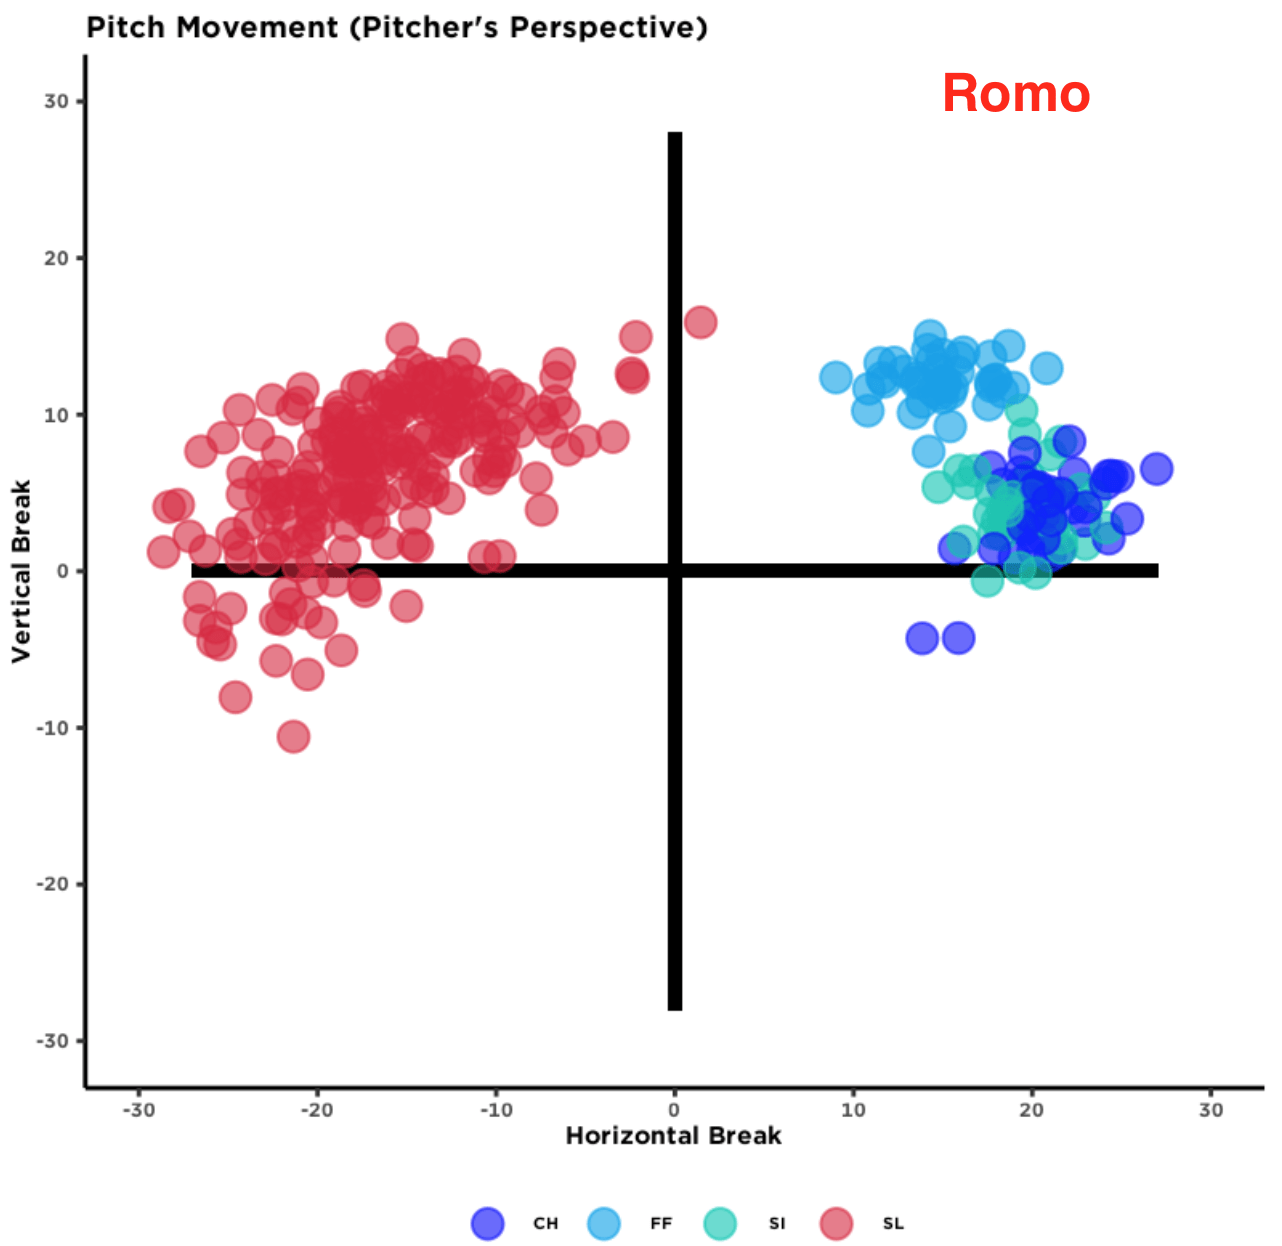
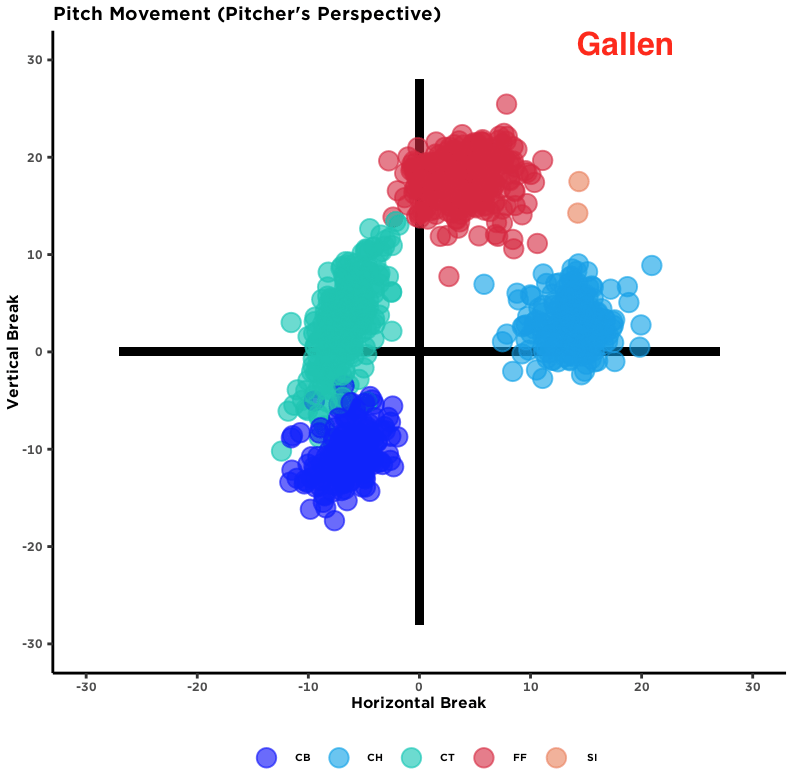
The pitches in the images above that stick out are Sergio Romo and Dinelson Lamets’ sliders, Zac Gallen’s cutter, and Yu Darvish’s, well, everything. Given the sheer magnitude of variation in each offering, one can infer that at least some proportion of the variation in the shape of these pitch types is intentional. In some cases, there is a clear trend in the movement deviation that demonstrates its purpose.
For example, Zac Gallen’s cutter follows a very specific trend in which he manipulates the speed and vertical break of the pitch. His cutter has shown vertical break ranging positively near his fastball, near zero like a slider, and then negatively nearing his curveball. Depending on the count, the pitch takes a shape that could be classified objectively as a fastball, cutter, slider, and even a curveball.
League-Wide Profile Manipulation: A Quantitative Approach
Given that we do see some evidence that pitches can change shape on a pitch to pitch basis, it’s important to understand how they change on a league-wide scale, as well as what is considered a significant change. First, let’s look at average league-wide pitch profile behavior related to the count.
Velocity
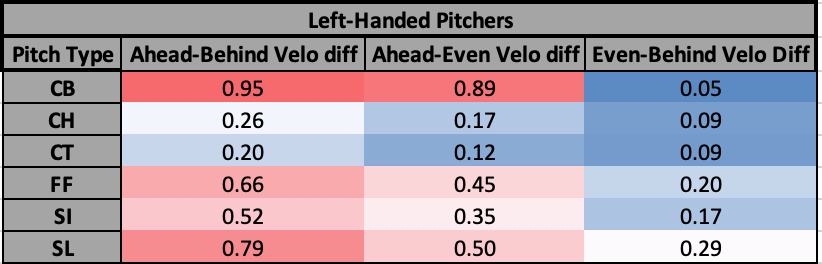
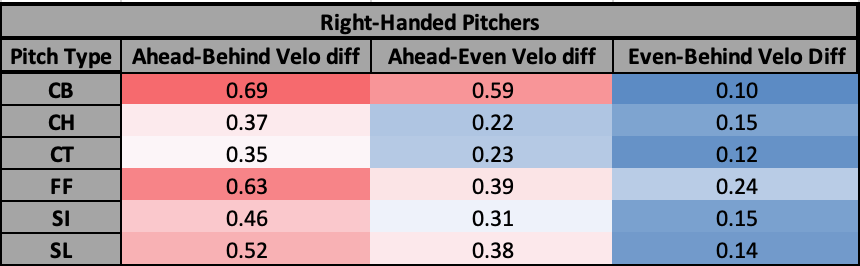
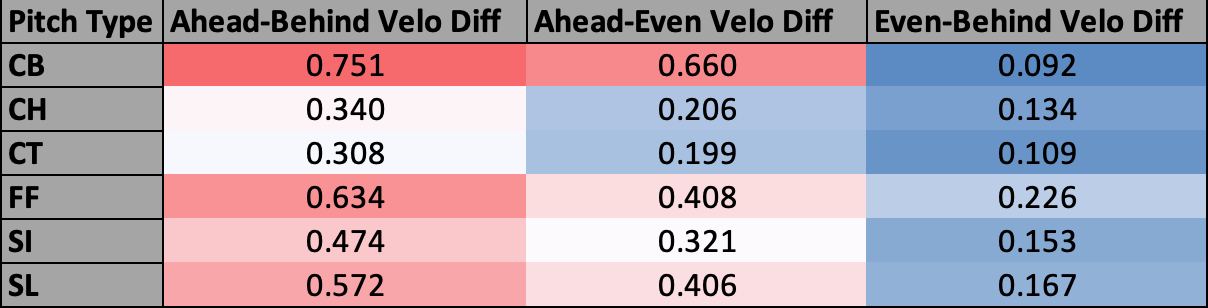
As we touched on previously, it is of no surprise that the velocity of different pitch types changes depending on the count. When looking across all pitch types thrown at the MLB level over the past 5 years, we observe that the average pitch is thrown ~.5mph harder when ahead in the count vs behind, and ~.37mph harder when ahead relative to even. Specifically, curveballs and four-seam fastballs were thrown the hardest when ahead, while the velocity of changeups and cutters were least affected by the count. Overall, left-handed pitchers threw their pitches harder in ahead counts compared to right-handed pitchers.
Vertical Break
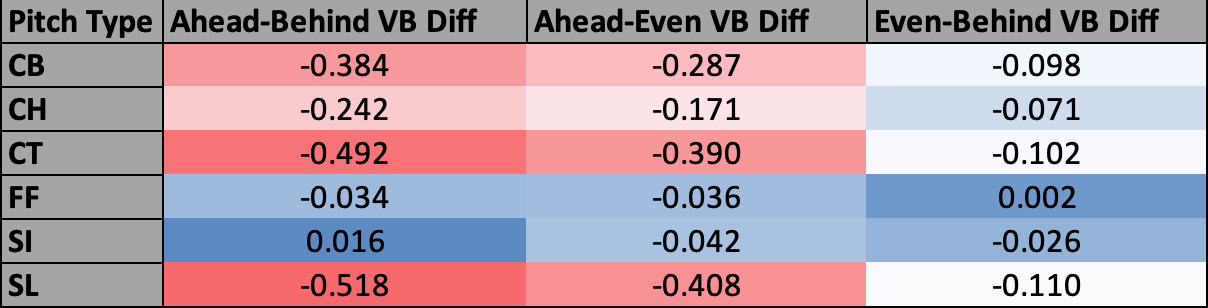
We see a similar trend when looking at vertical break, as almost all pitch types in our sample are thrown with more negative vertical break while ahead in the count relative to behind or even.
For fastballs, sinkers, changeups, and cutters, this would be referred to as less lift. Four-seam fastballs, on average, showed a drop in spin efficiency of -0.039% in ahead counts compared to behind, which could result in the slight drop in vertical break. It is also common for athletes, specifically those with lower average spin efficiency, to decrease their efficiency as fastball intent increases. Knowing that pitchers tend to add velocity ahead in the count with their fastballs while potentially lowering spin efficiency, we might be able to explain the loss of lift.
For curveballs and sliders, this would be referred to as more drop or depth. Sinkers were the only pitch type with more vertical break (more lift) when ahead in the count, which is perhaps counterintuitive given the purpose of a sinker.
Less surprisingly, however, sliders and cutters were the two pitch types with the biggest change in VB from count to count. For sliders, it is likely that a pitcher wants to increase depth and downward movement to induce a swing and miss, while the same may be true for cutters as well.
Horizontal Break
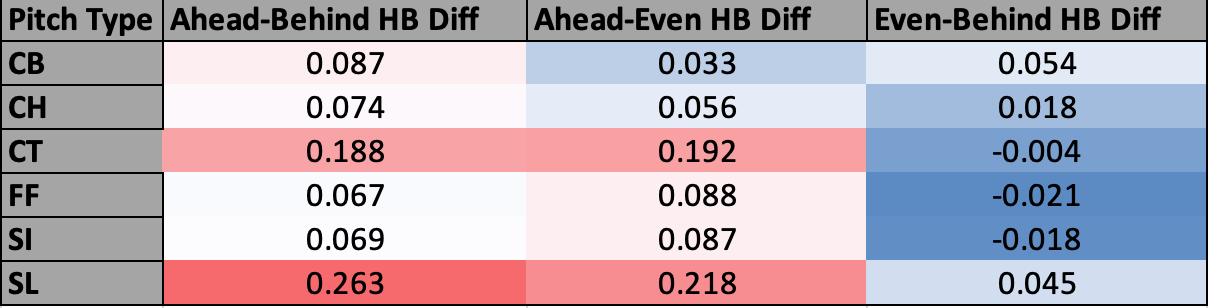
Positive values indicate more sweep, while negative values mean less sweep.
On average, the count didn’t seem to have as big of an effect on horizontal break as it did on velocity and vertical break. As seen above, the average deviation in horizontal break is significantly lower than in vertical break, as all values hover around 0. However, the horizontal break of sliders and cutters was most affected in ahead counts, while all other pitch types were essentially unaffected. It is possible given the abundance of curveballs and sliders thrown harder while ahead that there are pitchers who sacrifice movement in exchange for the increase in velocity.
What is Significant?
In order to determine whether a change in velocity or movement is intentional, we need an understanding of the league-wide standard deviations for each pitch type. Below is a table showing the average pitch variation in movement, spin, and velocity across all counts.
The pitches and metrics with smaller deviations indicate that they don’t fluctuate as much as other pitch types. The lowest expected deviation we found was mostly with sinkers, as they showed the smallest deviations in speed, spin, and horizontal break. This means that across the league sinkers were the most consistent pitch type in terms of velocity and movement. The opposite is true for changeups and curveballs, as they were two of the types with the most variance.
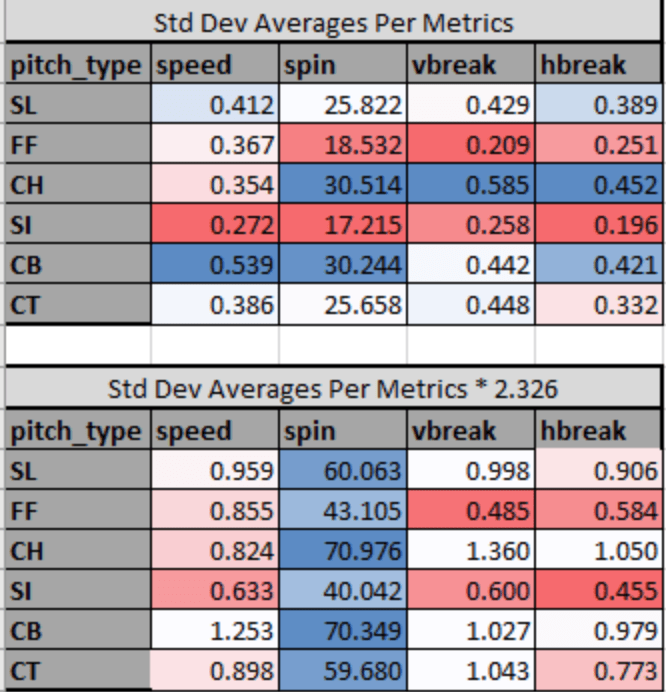
The lower chart indicates our cutoffs for determining significant, or outlier, deviations per metric. These numbers were multiplied by a z score of 2.326, using an alpha level of 0.01. So, in order to determine the frequency of sliders that were significantly manipulated by a pitcher within a given count or game state, we simply flagged pitches that fell above or below the thresholds above.
For example, the deviation of significance for slider velocity was found to be 0.959mph, so we simply flagged the pitchers who threw their SLs .959mph above or below their own average as significantly changing the velocity of that pitch within a given count. The same methods were used for horizontal and vertical break.
League-Wide Count-Based Pitch Profile Manipulation
With a quantitative blueprint for deeming pitch type movement variation as intentional, we can evaluate all pitch types across all counts. This generates insights into what pitches and metrics are manipulated the most/least in certain counts.
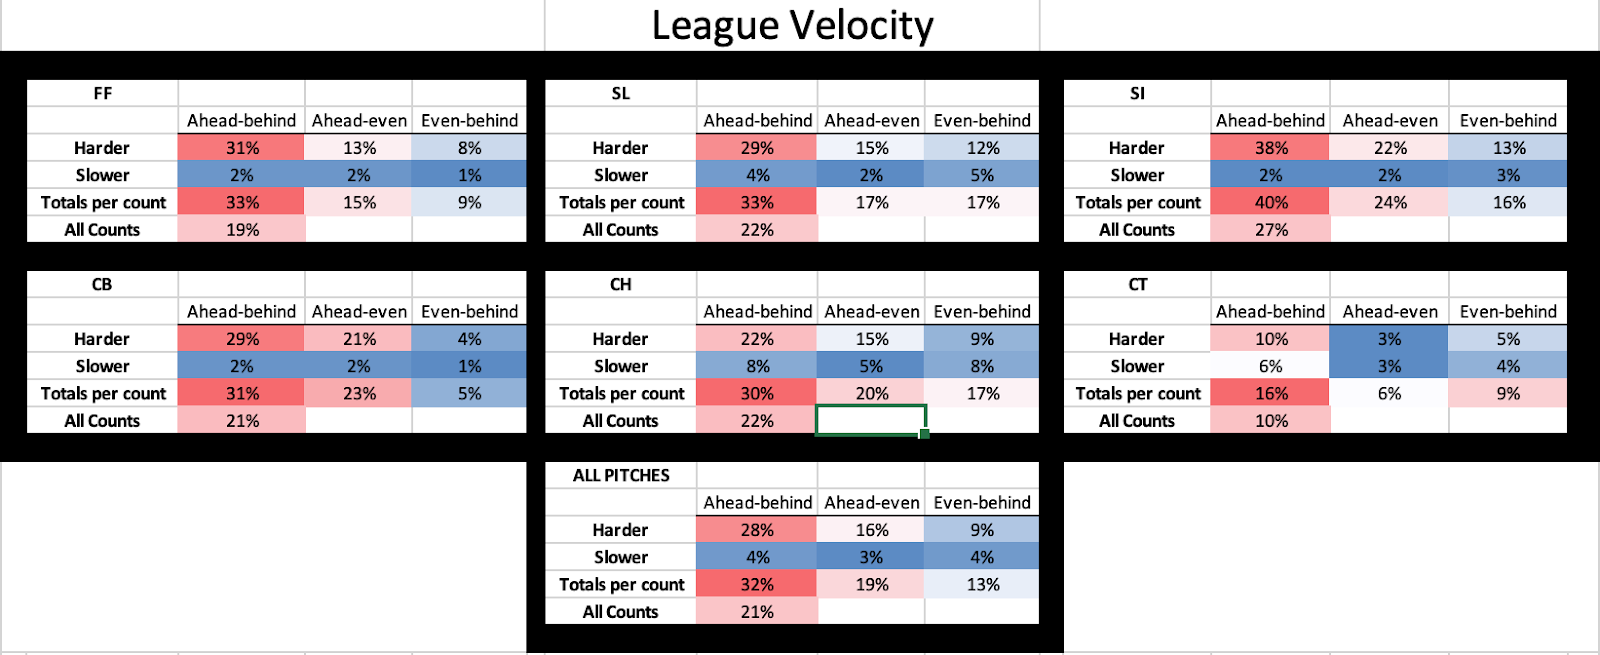
As mentioned previously, velocity was significantly higher in ahead counts compared to even and behind counts. Excluding the cutter, pitchers threw 33.6% of all pitches significantly harder while ahead relative to even or behind. Across all pitch types, 28% of pitches were significantly harder in ahead counts compared to behind, while 4% were significantly slower. Cumulatively, 32% of all pitch types were significantly different in terms of velocity when ahead versus behind. When we include all counts, 21% of all pitches were either significantly harder or slower relative to the specific count state.
At the league-wide level, sinker velocity was most influenced by the count, with 38% coming in significantly harder and 2% coming in significantly slower when ahead versus behind. The four-seamer, slider, curveball and changeup were all 30%-33% harder while ahead. At just 10% harder in ahead counts, cutter velocity was least affected by the count. Overall, in terms of both significantly gaining and/or losing velocity in all counts, sinkers were the most manipulated (27%) and cutters were the least (10%).
There are a few theories as to why horizontal break would be intentionally changed depending on the count. With breaking balls, there is a velocity-sweep tradeoff which describes an increase in velocity as usually requiring a sacrifice in horizontal movement, and vice versa. In ahead counts, some pitchers may opt to throw their breaking balls harder with less sweep, and some may throw theirs slower with more sweep. It is also possible that a change in horizontal break is the indirect consequence of changing intent and velocity with the pitch, so the main focus is throwing the pitch harder, but the movement possibly decreases as a result. On the other hand, pitchers could take a tick or two off their breakers to increase movement.
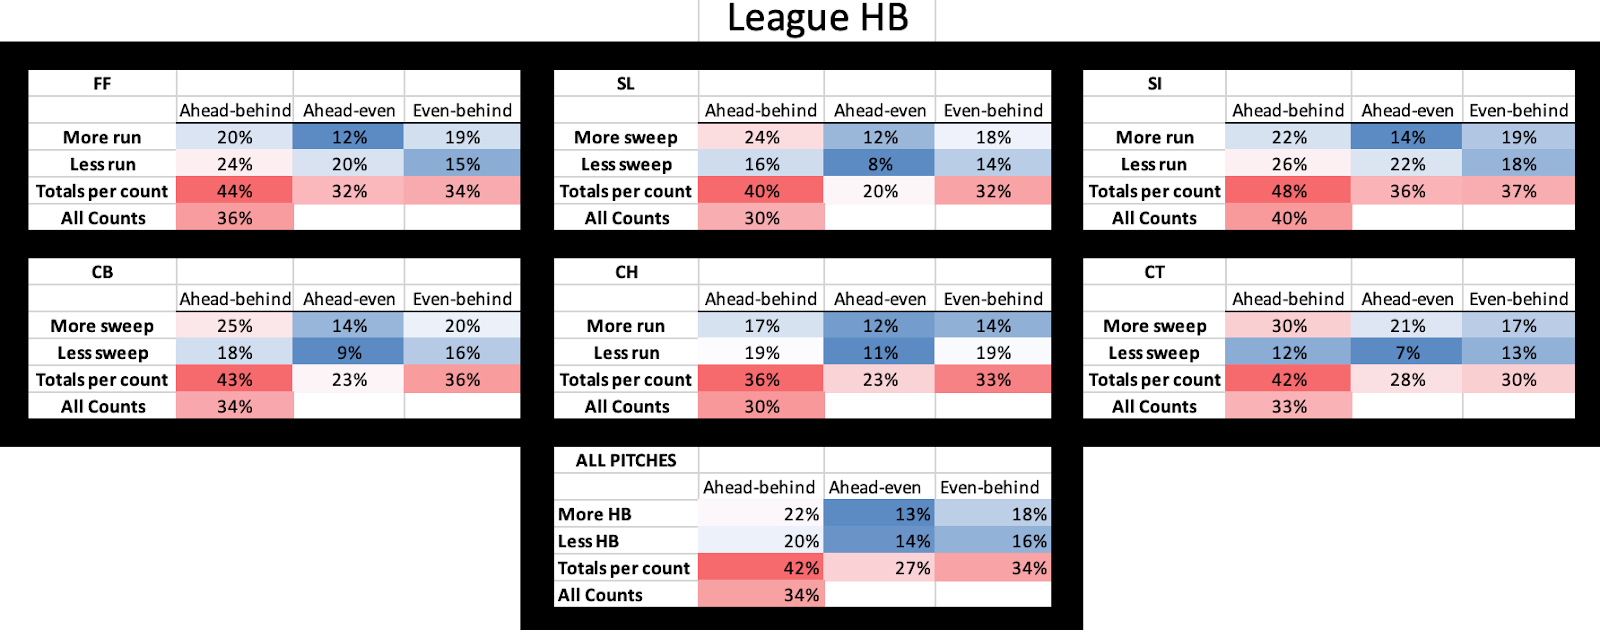
When looking at ahead-behind comparisons amongst all pitches, there were similar results for significantly more HB (22%) and less HB (20%), for a total of 42% of pitches significantly manipulated by horizontal break in either direction. This balance potentially describes both strategies of increasing velocity (less sweep) and/or increasing movement (more sweep) in order to achieve a whiff. Gloveside breaking pitches (sliders, curveballs, cutters) seemed to favor more sweep in ahead counts. Pitches with armside movement (four-seam fastballs, changeups, sinkers) favored less horizontal break while ahead.
Again, sinkers lead the way with 49% of pitches showing significantly different horizontal break while ahead compared to behind. Four-seamers, cutters, sliders, and curveballs saw significance in the 40%-44% range for either gaining or losing HB in ahead counts. In all counts, 34% of all pitch types were significantly manipulated by horizontal break. Overall, in terms of both significantly gaining/losing horizontal break in all counts, sinkers were the most manipulated (40%) and both sliders and changeups were the least (30%).
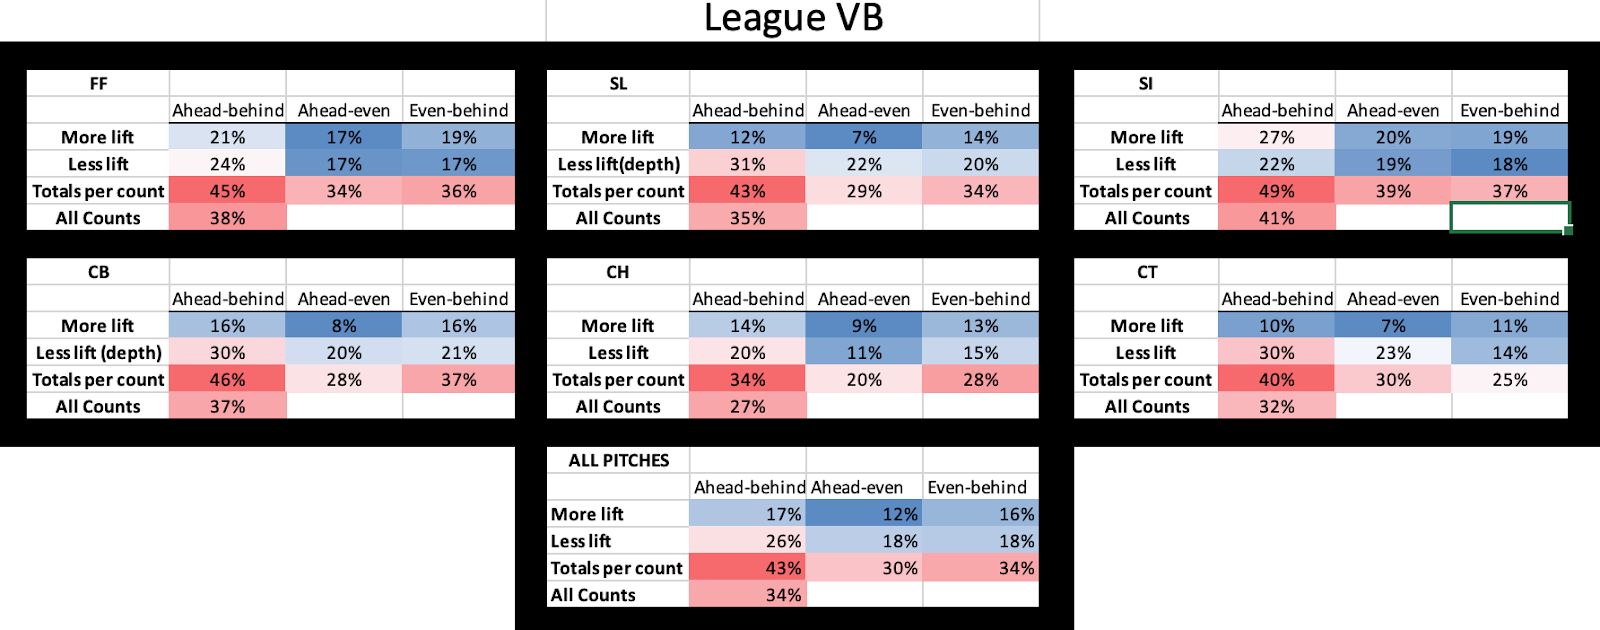
Nearly across the board, pitches tended to have negative vertical break (less lift, more drop) while ahead in the count. For gloveside pitches, curveballs, cutters, and sliders favored more depth (negative VB) while ahead in the count. This supports the theory that while ahead, pitchers may add more downward movement in an attempt to induce a swing and miss. Fastballs and sinkers were roughly split, with the same percentage of more lift and less lift while ahead. Cutters saw a drastic favoring of more lift while ahead in the count at 30%, compared to the 10% of pitches that showed less lift. Overall, in terms of both significantly gaining and losing lift in all counts, sinkers were the most manipulated (41%) and changeups were the least (27%).
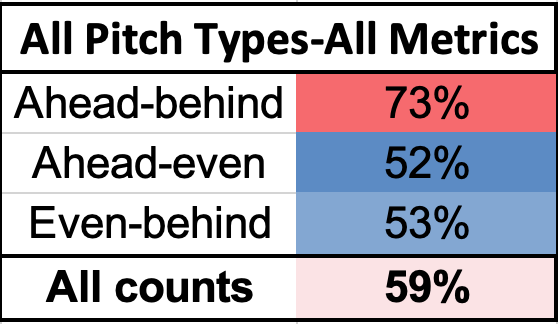
When we take into consideration significant deviations in all pitch types across velocity or movement, 59% of all pitches are thrown with a significantly different profile compared to their profiles in other counts. Specifically, 73% of ahead-count pitches have significant deviation in velocity, movement or both compared to behind counts. 52% of ahead count pitches were intentionally manipulated relative to even counts, while 53% of even count profiles were manipulated compared to behind counts.
Given the intricacies of pitching strategy and pitch movement, it is no surprise that there is meaningful pitch profile manipulation occurring on a pitch by pitch basis in the big leagues. In this piece we aimed to provide quantitative context for which pitch types are changed, how, by how much, and when.
Comment section