Pairing Blast and Hittrax Data

While the beginning of the technology revolution in baseball analytics may have started on the pitching side, hitting is catching up fast.
More people and teams than ever have been using objective, precision-measuring technology to evaluate swing outcomes (batted ball technology like Rapsodo Hitting and HitTrax), swing characteristics (BlastMotion), kinematic movements of swings (K-Vest), and a few other categories that we ambiguously refer to here in a blanket cover-all reference.
We use all these tools at Driveline and they generate a ton of instant, usable data. But what is even more trendy than using any one of these tools by themselves?
Using two or more of them at the same time—and time syncing them to inspect on a swing-by-swing basis.
While we’ve been building a growing database of tools stretching across at least three categories, today we discuss timestamping individual HitTrax and Blast swings over the last few months. Below are some general descriptive results and relationships from around 9,000 swings of over 42 individual players.

Foundations of Hitting
30 modules teaching you everything we know about hitting and hitting mechanics.
Intra-Column Correlations Among Blast Values
First, let’s look at the relationship of the Blast column values to each other. Now there’s not that much literature on what these values should be and how they relate to each other.
Below are some descriptive stats for each of the Blast metrics and the intra-correlations between the metrics:

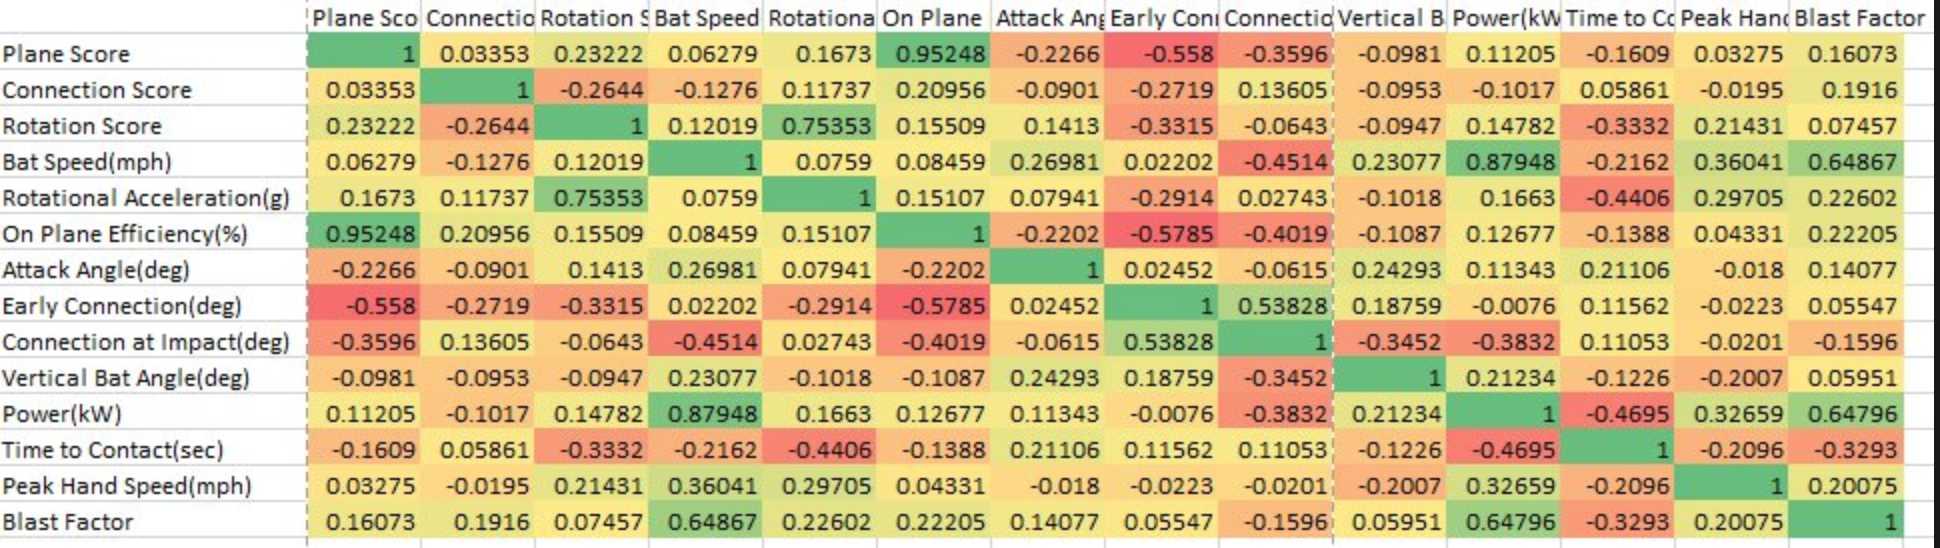
There are some extremely high correlations here between metrics, with not too much variable of a change in magnitude.
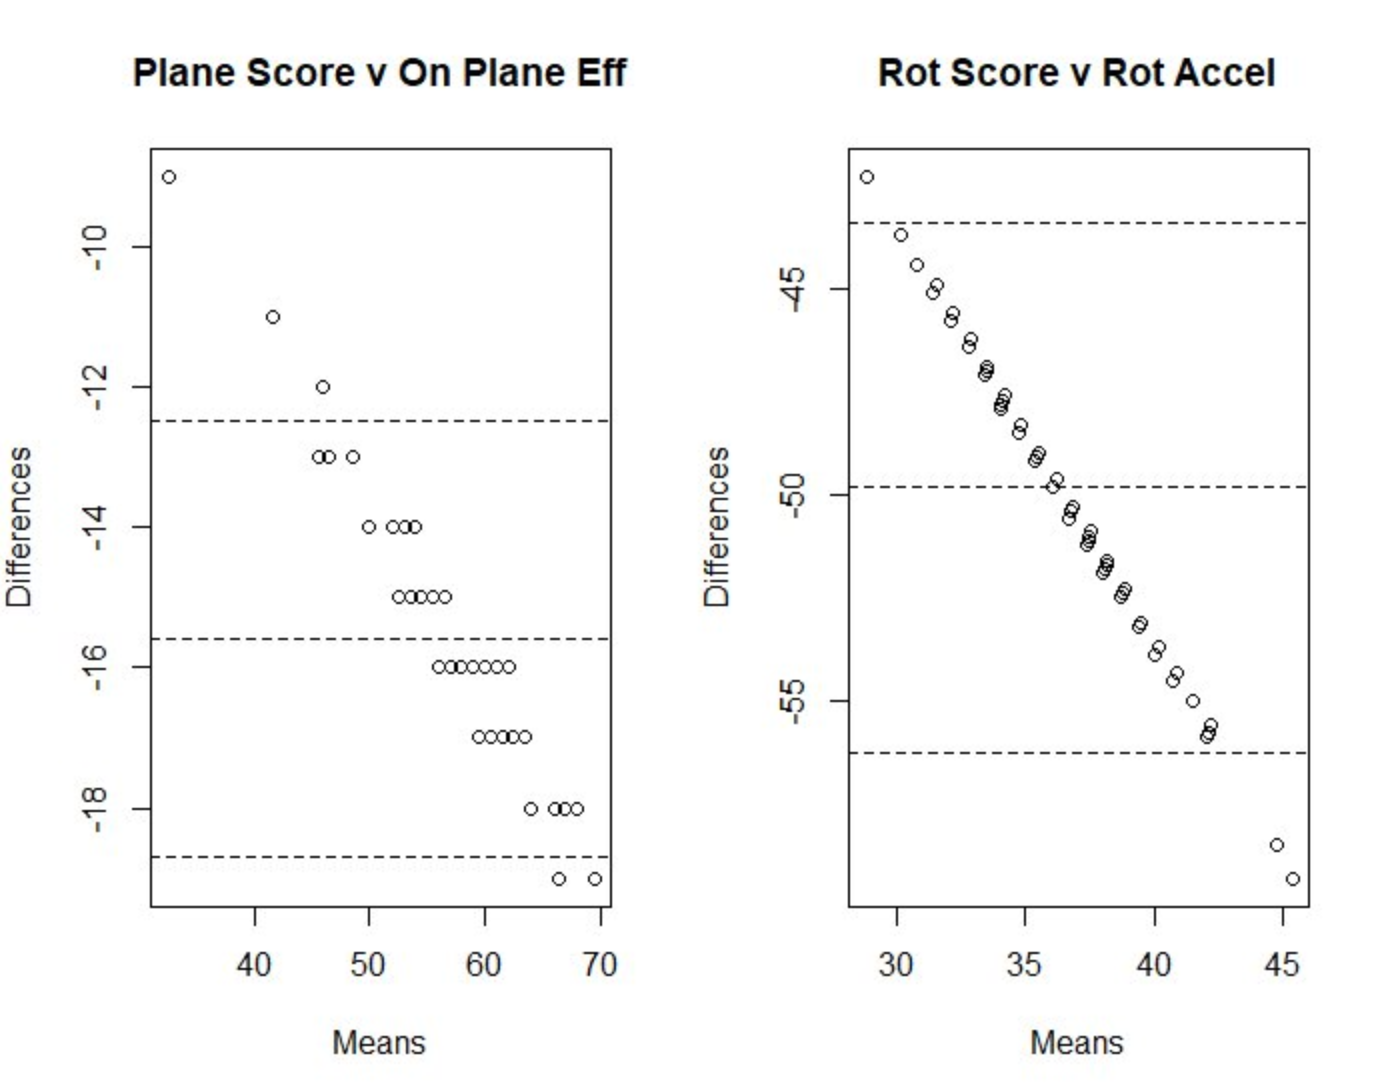
In particular, plane score seems to increase and decrease very closely with on-plane efficiency; the same relationship exists between rotation score and rotational acceleration. A look at the Bland-Altman plots shows an interesting possibility that there may be a constant scalar multiplier turning one metric into another. In other words, only one of each pair of metrics may be especially necessary when evaluating a swing or a set of swings.
Also of interest, and somewhat intuitive for the believers in bat speed, are the very high correlations with bat speed and power, as well as Blast Factor and the peak-hand speed.
There are also healthy, negative (and again intuitive if you can visualize what happens as you cut down on the time it takes to make contact) time-to-contact correlations with the rotation metrics, bat speed, power, and peak-hand speed.

Become the Hitter You Want To Be
Train at Driveline
Inter-Correlations with Blast and HitTrax
Now let’s fold in some HitTrax metrics. To keep it simple, here’s a general view of Blast correlations with some of the main HitTrax metrics.
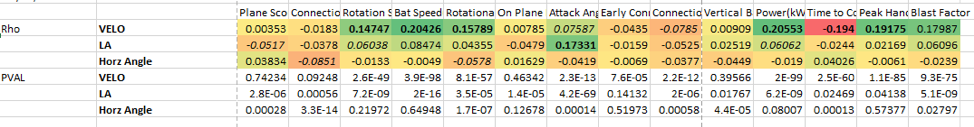
The magnitude of the correlations may not be visible at first glance (especially not when compared to the daunting Blast intra-correlations), but since we’re looking at a sample size of 9,000 pitches, correlations become statistically significant at a very low level. Some of the ones that are particularly relevant include the following:
- Exit velocity increases (in order of strength) with Blast’s power metric, bat speed, peak-hand speed, and the rotation metrics, while decreasing with time to contact.
- Launch angle has a positive significant correlation with attack angle which, while completely different metrics, are often either confused for one another or believed to not be correlated at all.
- Correlations aren’t an end-all–be-all of measuring how these metrics interact of course.
Values by Binning (Level, Pt of Contact, EV, LA)
We can also bin these metrics by skill level and relevant context to gain preliminary insight into what swing characteristics differentiate pros from amateurs and how these metrics can be impacted by specific pitch tendencies.
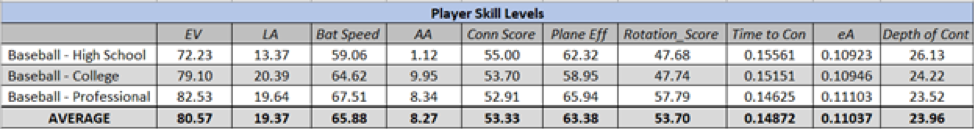
In the table above, we see that both exit velocity and bat speed increase at a significant margin as the level of competition rises. Launch angle and attack angle are similar between our college and professional trainees, but each metric is significantly lower in our HS trainees from a relative perspective.
By examining more detailed Blast Metrics by competition level, higher skilled athletes seem to have a lower time to contact, a higher collision efficiency score, and a tendency to let the ball travel deeper when making contact.
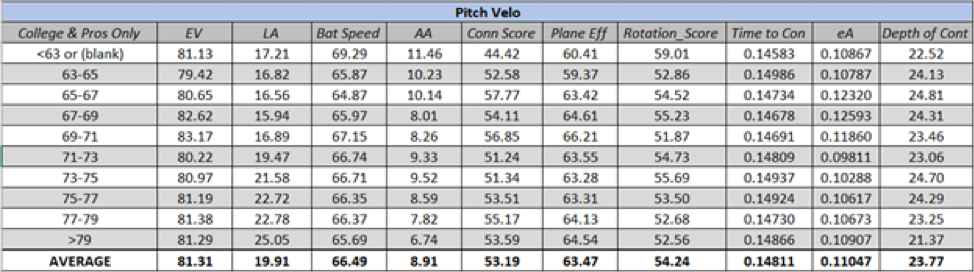
By breaking up these metrics by pitch velocity at contact, we see that as a pitch comes in hotter, launch angle increases as attack angle decreases. Of course, if we’re trying to roughly match the plane of a given pitch to maximize outcomes at the plate, and slower pitches descend at a steeper angle (holding location equal), this intuitively makes sense. Interestingly, metrics such as plane efficiency, time to contact, and depth of contact were relatively unaffected by pitch velocity.
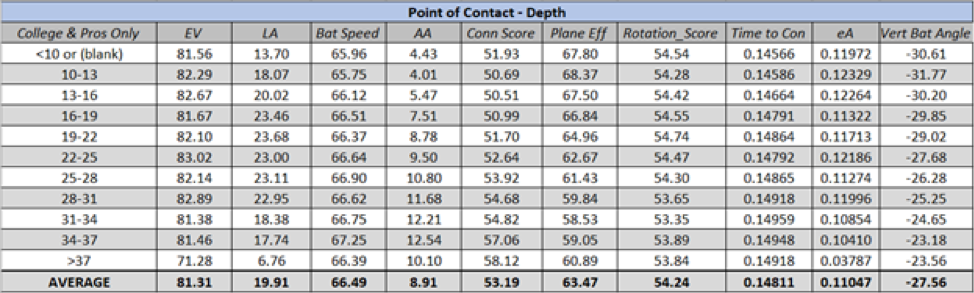
When hitting the ball farther out in front of home plate, batters tend to make contact with a higher attack angle, a longer time to contact, a worse plane efficiency score, and a flatter vertical bat angle. You can can also see that EV peaks at somewhere roughly between 22-25 inches out in front of the backend of home plate in our sample, something that has been confirmed by Hit F/X data at the big league level.
Lastly, we can break pitches up by vertical and horizontal location at contact to see how batters adjust their swing to accommodate pitches in different locations in and around the zone.
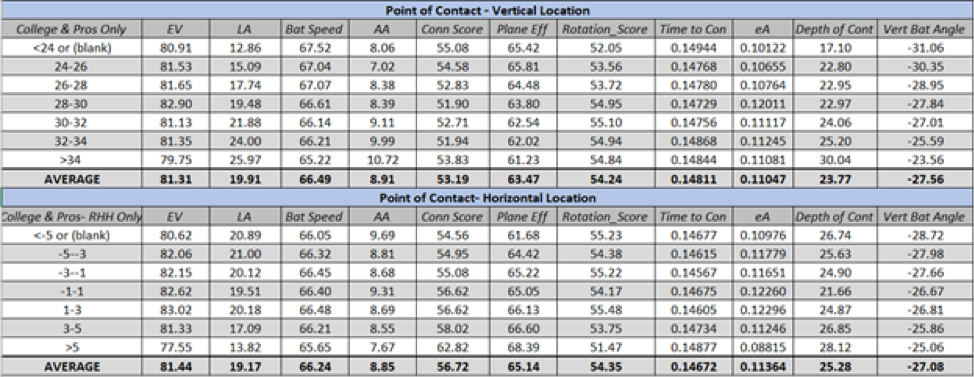
We see that as location height increases, launch angle and attack angle also increase at the expense of bat speed. Going up the ladder also negatively influences plane efficiency score, increases time to contact, and causes hitters to make contact farther out in front.
While there are less interactions between swing metrics and changes in horizontal pitch location (from a catcher’s perspective), it does look like a batter’s attack angle peaks and pitches travel deeper when a pitch is located down the middle. Connection score and plane efficiency also score better, on average, as pitch location moves farther away from a batter.
In general, this initial breakdown of Blast and HitTrax data shows us how important it is to consider the context of a given pitch and batter skill level when interpreting a player’s given Blast and HitTrax metrics. Before diving into intra-player analysis, exploring ways to control for different variables seems important in objectively assessing an athlete’s swing.
Averages per Players (Controlling for Individualized Means)
Since the whole sample spanned over 40 athletes, all with their own swings and tendencies, it’s worth looking at the means across the athletes as well—along with an initial exploration of a linear mixed-model analysis with the athlete serving as the random effect—to explore the possibility of the non-independent, repeated measures by the same athlete influencing our quantitative findings.
First, here’s some of the more commonly investigated metrics and their respective descriptive statistics for a list of the anonymized athletes:
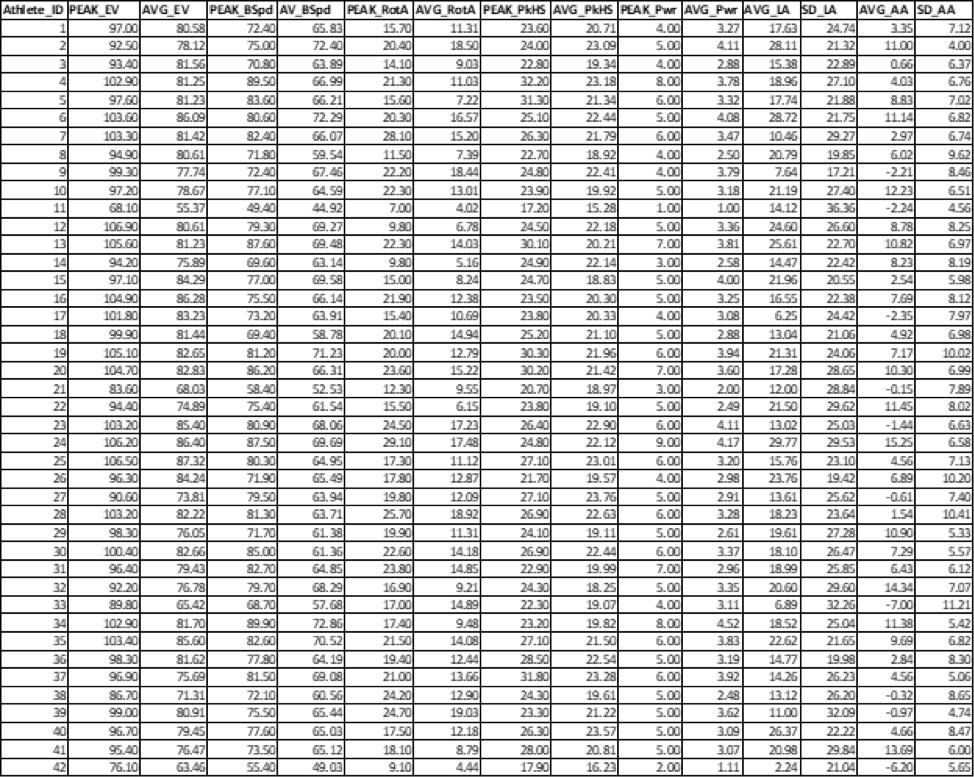
From left to right, the metrics are as follows
- peak and average exit velocity
- peak and average bat speed
- peak and average rotational acceleration
- peak and average peak hand speed
- peak and average power
- the average and standard deviation launch angle
- the average and standard deviation attack angle
Here are some regressions ran against these means across a few different combinations, with the respective proportion of variance they cover. While peak and average EV both show high correlations across the metrics we look at here (bat speed, rotational acceleration, power, and peak hand speed), it’s interesting that one’s peak EV seems to correlate higher in all four cases.
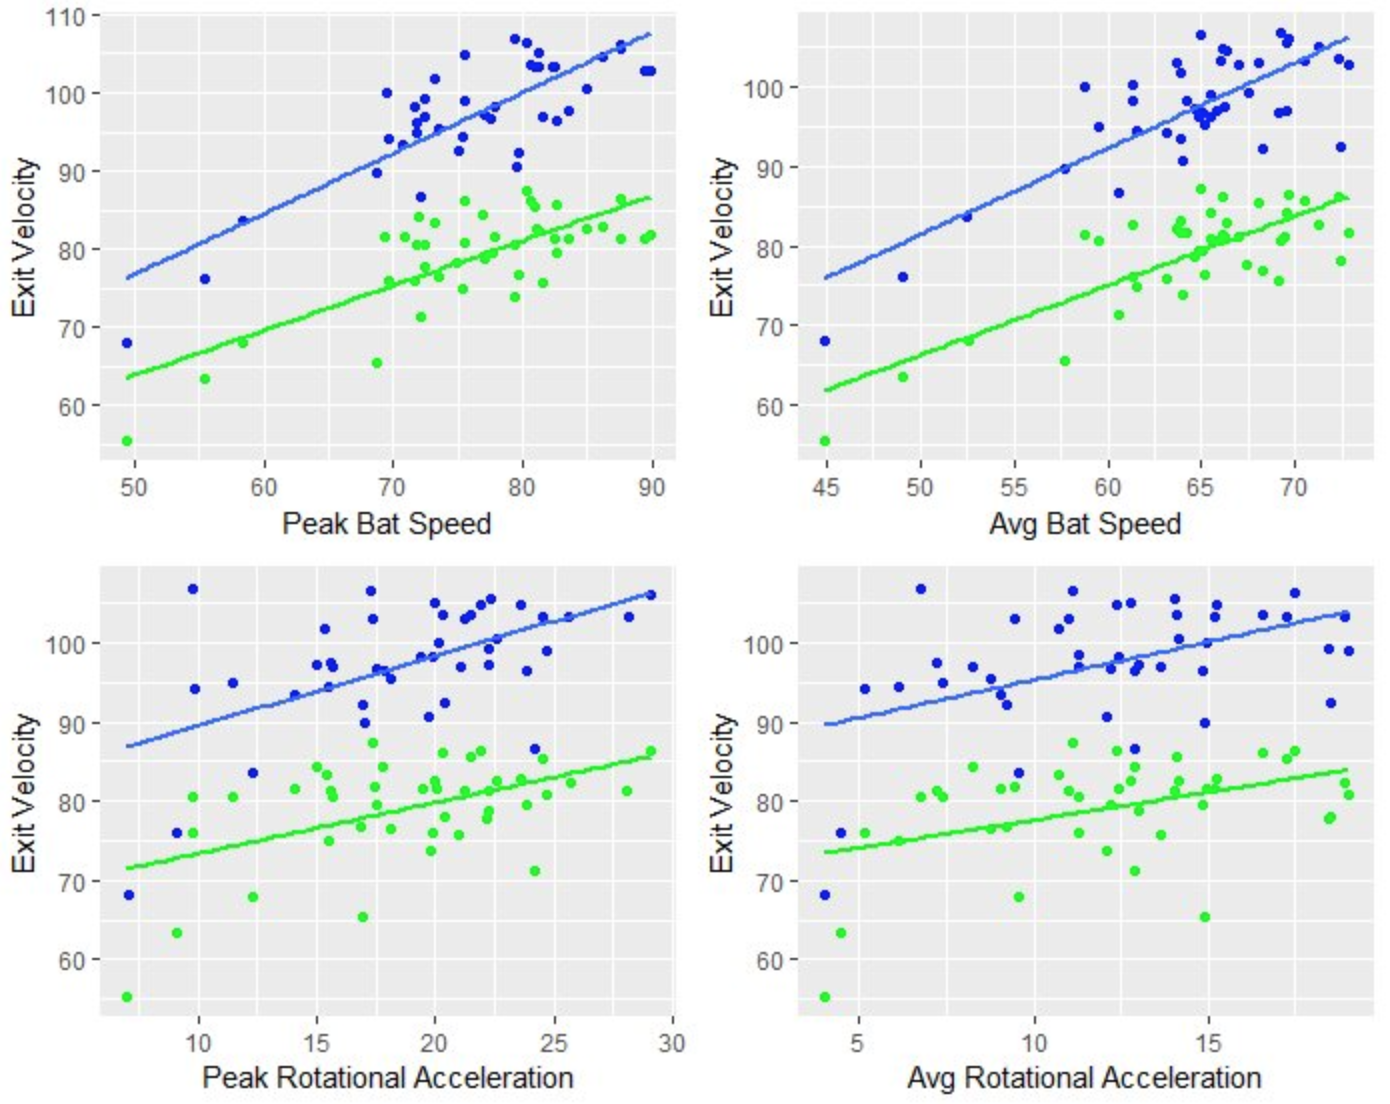
We run the risk of correlations being uneven across different subjects and correlation of averages being a potential misrepresentation of the nature of the data. The correlation coefficient is defined as E[(X−μX)(Y−μY)]/σX σY. Even though it makes sense to take averages in this situation, by definition this changes the relationship between the x’s and μX and y’s and μy.
So to kind of loop back and make conclusions on some of these relationships, we also ran a linear mixed-model analysis on the whole dataset of swings, controlling for the pitcher as the random effect and then running a Wald Chi Square Test to determine the significance of the explanatory variable or the fixed effect across all the swings.
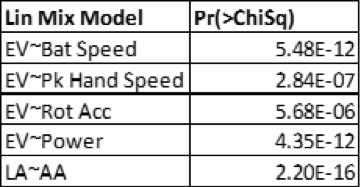
Yup, those are all extremely significant at any conceivable alpha level.
Now that we ironed out some long-thought ideas with some concrete numerical findings, we look forward to explaining some more complex ideas and relationships in Part 2 of the Blast-Hittrax data mash-up blog.
Train at Driveline
Interested in training with us? Both in-gym and remote options are available!
- Athlete Questionnaire: Fill out with this link
- Email: support@drivelinebaseball.com
- Phone: 425-523-4030
Comment section
Add a Comment
You must be logged in to post a comment.
Jim Colton -
Fantastic analysis! A couple thoughts/questions spring to mind (perhaps some get answered in Part 2)
– will you be making the swing data available to download, like the previous blast tee/front toss/hitting
– Blast defines on plane and rotation score as a 20-80 scaled conversion of the on plane efficiency and rotational acceleration, I believe. The only difference is the scale is based on the level of the player.
– Their Connection score is based on an ideal scenario of 90 degrees at early Connection and 90 degrees at contact. It seems many of your hitters are higher than 90 early on but very close to 90 at contact. I presume a high early connection/90 impact connection also would lead to a lower on plane percentage. It makes me question their ideal (ie early connection is not something a coach should be overly concerned about, as long as they are getting back towards 90 at contact)
– I wonder if you could look at the average metrics controlling for differences in attack angle. For instance, bins by launch angle relative to attack angle. This would be some indication of the contact relative to the barrel. Also I believe Hittrax includes the horizontal angle of the incoming pitch, so perhaps you can factor this is as well.
– I’m wondering if an exit velo/ power ratio would be meaningful/interesting given power seems to be an indication of the potential of a given swing and the ratio would show how often a hitter is able to transfer that power into the ball.
– do you have information on swing and misses as well (plus a lot of fouled back swings were Blast is registering but Hittrax is not)? It would be interesting to know if the average blast swing metrics correlate with contact rates and fouled off/fouled back rates.
Mike -
The images of the data can be difficult to read even when opened separately and enlarged.
Driveline Baseball -
We will work on getting those images enlarged or easier to expand!