Comparing Tee, Front Toss, and Machine Swings with a Bat Sensor
What Is Blast?
Blast Motion Baseball by Blast Motion, Inc. is a motion-capture sensor for the bat that measures various data points with every swing. The version that we use at Driveline measures 14 data points:
1.) Attack Angle 8.) Rotational Acceleration
2.) Bat Speed 9.) Connection Score
3.) Blast Factor 10.) Early Connection
4.) Power 11.) Connection at Impact
5.) Plane Score 12.) Peak Hand Speed
6.) On-Plane Efficiency 13.) Vertical Bat Angle
7.) Rotation Score 14.) Time to Contact
Become the Hitter You Want To Be
Train at Driveline
A detailed version of each of these metrics can be found on Blast Motion’s website, but most of the measurements should be self-explanatory.
As technology in baseball continues to evolve and become more accepted, Blast Motion sensors have become extremely popular because they are affordable and easy to use. Blast Motion, Inc. does a great job of making their applications accessible for players, coaches, and parents. The flow of information is seamless and combined with their industry-leading results, it is clear why they continue to be the best in wearable bat-sensor technology.
In 2016, they became the Official Bat Sensor Technology of Major League Baseball, and for the 2017 MiLB season, they were approved for in-game use at the Rookie affiliate level in the Gulf Coast League (GCL) and Arizona League (AZL). Beginning with the 2018 MiLB season, they were approved for in-game use at all levels. Their public partnership with the Houston Astros has also sparked their popularity. As the Houston Astros claimed the 2017 World Series, other teams started to take notice as Blast Motion sensors were a staple in the Astros’ hitting programs. Clearly the Astros see value in the measurements if they committed to a partnership while using the sensor in games and practice.
Get out the rye bread and mustard, grandma…it’s GRAND SALAMI time!! OSCAR CAMPOS!! His 2nd career pro HR is a delicious one, and the ‘Cats lead the Connecticut Tigers 4-0. Follow along on MiLB GameDay:https://t.co/wloaXDfkh4 pic.twitter.com/6GF5jHsY0n
— Tri-City ValleyCats (@ValleyCats) August 7, 2018
— Quad Cities River Bandits (@QCRiverBandits) September 2, 2018
with the 3-run #Astros No. 7 prospect Seth Beer goes deep to left in the 6th to give the @bcreekastros a 3-0 lead as they look to eliminate @WSDashBaseball and advance to the Carolina League finals. Follow live: https://t.co/2r3XIyI89o pic.twitter.com/sKix0e5acH
— MLB Pipeline (@MLBPipeline) September 8, 2018
As all five of the Astros’ top MiLB affiliates made it to their respective league playoffs—with Double-A Corpus Christi and Triple-A Fresno making it to the championship round and Class A Short Season Tri-City ValleyCats and Class A Advanced Buies Creek winning their league titles—the rest of the MLB started to notice. Blast Motion recently announced that the Minnesota Twins will officially partner with them as well. Sensor data is becoming more widely used in the professional baseball ranks and is extremely popular among the amateur baseball crowd.
How Blast Motion Is Used At Driveline
Blast Motion sensors are a regular tool in Driveline’s hitting programs. We use this technology—along with HitTrax, Rapsodo Hitting, K-Coach Baseball (K-Vest) and video—when we assess athletes. We may also use specific tools for more targeted changes throughout an athlete’s stay and retest them every few weeks. This allows us to acquire large data sets for analysis. Comparing data from these sources allows us to identify all swing deficiencies and track hitter progress over time.
Foundations of Hitting
30 modules teaching you everything we know about hitting and hitting mechanics.
One of my weekly responsibilities is consolidating all of the individual hitters’ Blast Motion data from the previous week and comparing it to their overall data. My main focus is to determine how well a hitter performed last week compared to his overall numbers and make adjustments for the upcoming week of training.
Of all the Blast Motion metrics, we tend focus on Bat Speed, Attack Angle, and Time to Contact. For Bat Speed, we look at an athlete’s peak, average, and median values. For Attack Angle, we look at average and median values. Only the average value is compiled in Time to Contact. From the Blast Motion website, a user is able to export all of his data in a single sheet. Using tools created by the R&D staff at Driveline, we can then quickly gather these values and compare athletes’ overall numbers to their numbers from the past week. With all of the hitters at Driveline, this gives us the essential information for our trainers to determine who is making progress and who needs to change their hitting schedule. This is a great way for trainers with multiple hitters to keep track of their progress simply and effectively.
Knowing this, we wanted to look at comparing some common practices that hitters participate in and see what the differences are in Blast measurements. This led us to the research project below, which compared metrics from hitting off a tee, front toss, and a pitching machine.
Comparing Blast Motion Metrics on Tee, Front Toss, and Machine
In this case study, we wanted to see how swings react when under different stressors or environments. Not every swing a hitter takes from the tee or front toss in a controlled environment is the same compared to when he faces a live pitcher. This case study attempted to simulate an in-game environment by using a machine as a substitute for live pitching.
Over the course of a day, we took twelve Driveline hitters of near equal age/skill level and split them into three groups of four. In each group, we had hitters take two rounds of ten off the tee, front toss, and machine, for a total of sixty swings using their game bat for the entire duration. The machine was set at the same velocity/distance for each of the groups for consistency, and the tee was moved each swing. Our machine setting used the average right-handed release point with an 84 mph 4-seam fastball, which simulates a 91 mph 4-seam fastball.
Results

Analysis
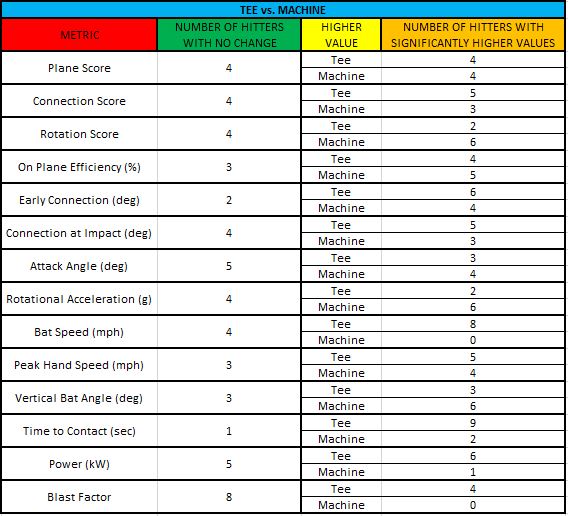
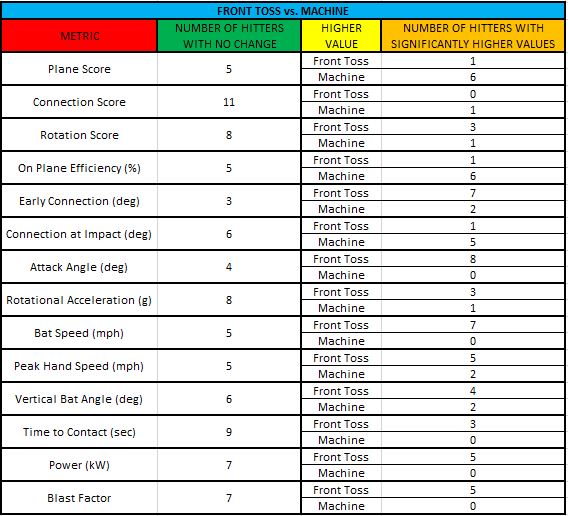
In our statistical analysis, we looked for overall metric summary values for each individual hitter and for all combined hitters throughout the three stations. We also ran comparison tests for the three categories to see if hitters had significantly higher values among them.
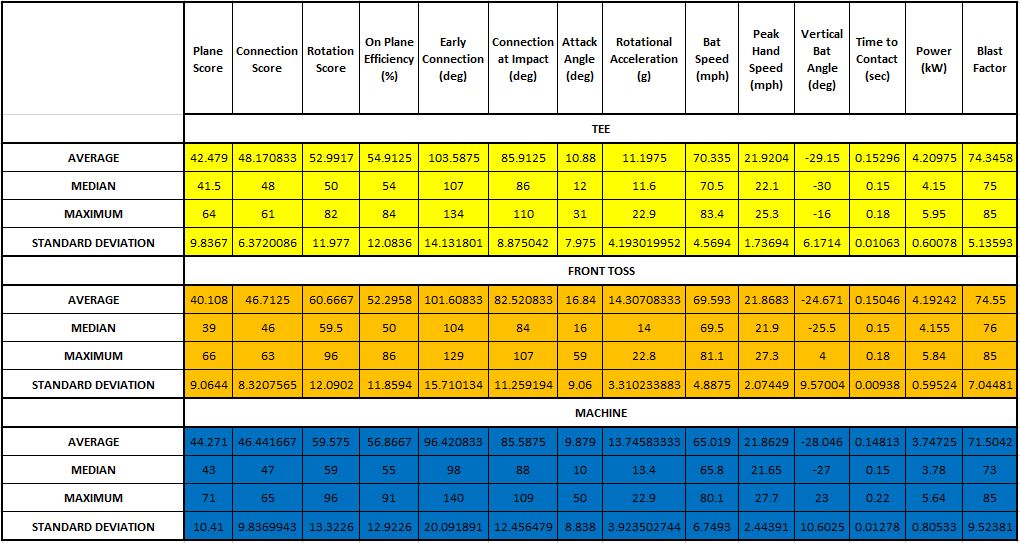
Four categories had significant differences throughout: Attack Angle, Vertical Bat Angle, Bat Speed, and Time to Contact.
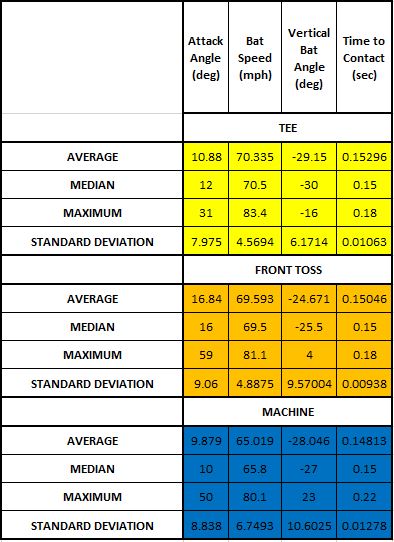
Looking at the summary values, we see that Attack Angle took a near 6-degree jump from 10.88 degrees at the tee to 16.84 degrees at front toss. Attack Angle is defined by Blast Motion as, “the angle of the bat’s path, at impact, relative to horizontal.” It then went down a near 7-degrees at machine work. This may be expected in front toss since front toss is a more relaxed and controlled environment, which means that hitters will look to elevate more and put their best swing on the ball. Eight hitters had a significantly higher attack angle on front toss compared to the machine. Vertical Bat Angle, defined as “the angle of the bat with respect to horizontal at the moment of impact” or “the location of the barrel of the bat relative to the knob of the bat at impact” had 9 hitters with significantly higher front toss values than tee values.
Other notable metrics that changed were Bat Speed and Time to Contact. Bat Speed, “the observed speed of the sweet spot of the bat at impact” decreased a small amount from tee to front toss, but then noticeably dropped from front toss to the machine. Eight hitters had a significantly higher bat speed on the tee than the machine. Seven hitters also had a significantly higher bat speed on front toss than the machine.
This is expected as hitters have less time to react as pitch speed increases. Nine hitters had a significantly higher Time to Contact, “the elapsed time between start of downswing and impact,” on the tee than the machine. Higher pitch speed means less time to react. A hitter having less time to react means that his Time to Contact will need to decrease to make up for it. As a result of the hitter having to react quickly to start his swing, bat speed will decrease. This is normal and expected. It is no secret that higher-velocity pitching exposes swing weaknesses.
Practical Takeaways
All of the previously mentioned metrics also bring up the fact that swings can change based on the drill. There may be different positions that a hitter’s body gets into when swinging off of a tee, compared to front toss, compared to a machine. While the Blast sensor cannot measure those changes directly—meaning we can’t say changes came from specific kinematic differences—we can see that there are differences in how the bat is moving.
We also look at the Time to Contact metric and realize that it is likely going to change based on the depth that contact is made, as well as different body movements. Hitting off a machine is likely to result in a wider range of depth that contact is made, compared to hitting off a tee or front toss.
This may help coaches think of how they are spending their practice time and what changes they are trying to make. We can break the down the types of drills that hitters often spend time working on and rank them by difficulty:
Dry Work -> Tee -> Soft Toss -> Front Toss -> BP -> Machine Work -> Live
Each drill type can be scaled in difficulty as well.
From there, we can start to look at how much time their players are spending on certain drills and then look how far away those are from live game.
Spending most of an off-season working on swing changes on the tee or in front toss may be a way for hitters to see if they’re making progress. But those changes they make may not be desirable, or practical, when they face live pitching. This means the percentage of time that hitters spend on different drills is vitally important.
This should also affect how coaches and players consider using technology to screen hitters. Coaches and players will get more accurate screening data if they can capture it closer to a live-game situation.
Final Thoughts
The goal of each hitter should be to have his best swing at every single pitch. As hitting coaches, we provide programs and implementation for a hitter to do that and transfer over those practice numbers to an in-game setting. Practice may tell one story, but hitting against live-pitching tells the real story. Blast Motion allows us to quantify swing quality, and as in-game sensor data potentially becomes more readily available at Driveline, it will be very interesting to compare it to a practice setting. Then we can conduct official research studies to quantify how live pitching truly affects swing mechanics and look at further nuances in the metrics themselves for how they may change depending on different practice situations. Conducting official research studies using Blast Motion on how live pitching affects swing quality will allow us to accurately identify weaknesses and adjust practice accordingly to maximize in-game hitting performance.
Train at Driveline
Interested in training with us? Both in-gym and remote options are available!
- Athlete Questionnaire: Fill out with this link
- Email: support@drivelinebaseball.com
- Phone: 425-523-4030
This article was written by Research & Development Intern, Griffin Gowdey and edited by Michael O’Connell
Griffin spent the 2018 MiLB season with the Buies Creek Astros, the Class A Advanced or “High-A” affiliate, in the Carolina League as a Minor League Technology Apprentice, where he was responsible for all of their in-game video and data collection as well as overseeing all of the Blast Motion sensors.
Comment section
Add a Comment
You must be logged in to post a comment.
Joe -
The test shows bat speed inversely correlates with pitch speed (0 to 84). Of course swing characteristics would be different, but could the slower barrel speed at moi just relate to the bat’s collision with a moving ball vs. stationary ball?
Christopher p -
I guess you can yes that by hitting a tennis ball vs a plyo off the tee. I’ve done this before but the sensor always seems to pick up barrel speed at impact and anything after impact didn’t matter. I talked w dr Nathan Allan about this and he said contact is so fast that mass of the collision doesn’t matter. I’m not convinced but he is the expert. He can chime in if my take is inaccurate.
christopher p -
I have been doing the same thing for years. I think 3-4 years ago I bought zepp which was great for video but the numbers were off. When Blast and DK came out it changed the game. I always noticed that my numbers and others numbers off the tee were higher by a decent amount vs soft toss then vs machine and live at bats. This got me really wondering and developing a plan to help hitters work translate into games. I started to see an improvement in tee numbers but it wouldnt translate into machine work or games.
Last off season and this off season I collected numbers from an MLB player. I worked with blast, DK, and hit trax and got really into zones off a tee, zones off flips, zones off machine (hard to do), then zones in live ab (almost impossible). What I learned was that fatigue is real and an MLB swing is VERY consistent. He thought he swung harder off machine and live vs tee but he didnt as expected. But it wasnt that dramatic of a difference. Of course attack angles changed but thats expected too. But I took this data and I compared it with Baseball Savant/Statcast data for the same zones to see if there was a correlation between bat speed, attack angle to exit velo, launch angle. All it did was prove that the hitter had issues with fastballs up. He got steep, he popped them up or missed, and his BABIP was under 100 for balls he was trying to hit. So what do we do here? Learn to lay off those pitches or plug the leak? I think zone discipline is key so we headed to a sports vision doctor to see if there were any issues. They we started training the eyes and focusing and target acquisition. The we got good off season live at bats with a few former milb guys and current college guys for 5 sessions in a week. Only time will tell if this works but at least we are working on it.
I wish I had access to a lot of high level athletes and a lab to test and track this data but I dont. Its crazy because I have been into this data and bat fitting ideas for years. I remember in like 2000 talking to other players about the swing and how the golf channel spent 24/7 dissecting swings and drills yet nobody talked about the baseball swing. They thought I was nuts but here we are. Although its different because of the tee. If we played tee ball then we could solve hitting and optimize everything.
Good work and Im jealous you guys get to do this for a job.
Jim Colton -
Have you synced the blast swing data up with Hittrax and/or Rapsodo data as well to see how the different practice environments impact batted ball outcomes? I’m also interested in which Blast categories correlate to consistent Barrel contact.
Kyle Boddy -
We are working on that as a current project!
MB Losi -
Great article on how technology is used in player development.
Justin -
Hi driveline – I have two little boys and I want to get them working on their swings. What is the best way to accomplish this? Tee? Front toss? Are there any programs you would suggest for really young kids (age 4)? Thanks!
Driveline Baseball -
Justin- The program we suggest for kids that young is fun and quality time spent with family, learning, experiencing, etc. Having fun hitting whiffle balls or anything to help develop hand-eye coordination is good. As your boys develop and mature with age, you can check out our Youth Axe Bat Speed System. This will come with the Axe Bat Speed Program that will include off-season and in-season programming, plus tracking sheets. We also offer an Online Hitting program and an Online Baseball Development program geared for youth athletes.
Scott Jarnac -
It’s awesome to see these type of analysis beginning to happen on a more regular basis. As one replier stated above and as an ex-golfer I agree, baseball/softball swing analysis is years behind golf swing analysis. I know how swing analysis through the use of technology helped my golf swing….. That said my challenge is now softball swing analysis (15 yo daughter) so any and all types of analysis conducted specific to the softball swing PLEASE feel free to send my way! Thanks for all you guys do to better the sport and the athletes.
@scottjarnac
Chad -
Great article and like the in-depth analysis. Would your TRAQ software track Blast data points and then be able to aggregate that data by individual drills that are pared with overload/underload bat training?
Driveline Baseball -
Thanks for reaching out, Chad. This is something that we are looking to develop in the future. As of now, you can tag(over/underload) the swings in Blast and then manually enter the averages into the tracking sheet in TRAQ.
Scott -
What type of drills would be used to attempt to sync the differences in swing speeds since they are off? Is it a continuation of focusing on live BP swings?
David Besky -
Scott – generally, we’d recommend making sure that athletes are training in an environment representative of the challenge they face in games, by focusing on live BP type swings in practice. Simulating the reaction time of live pitches in front-toss and BP (using velocities as detailed in this table) can help with carry-over, but actually seeing game-like velocities will be essential for optimizing an athlete’s ability in this setting.